This study investigates whether Tuina alleviates insomnia in a rat model by regulating hypothalamic orexin-A expression, using behavioral assays, immunohistochemistry, and real-time quantitative PCR.
Method Article
Effect of Tuina on Hypothalamic Orexin-A Expression and Sleep Behavior in a Rat Model of Primary Insomnia
* These authors contributed equally
In This Article
Summary
Abstract
Insomnia is a common sleep disorder that leads to impaired daytime function and increased risk of comorbidities, significantly impacting patients’ quality of life. Current treatments, primarily cognitive behavioral therapy and pharmacotherapy, are limited by issues such as drug dependence, tolerance, and withdrawal rebound. Tuina therapy has been shown to regulate the nervous, endocrine, and immune systems, while the orexin system is a key regulator of the sleep-wake cycle. This has prompted the exploration of whether Tuina alleviates insomnia by modulating the hypothalamic orexin system. This protocol describes the methods of Tuina intervention in a rat model of primary insomnia induced by the modified multiple platform water environment method. We randomized 64 Wistar rats into four groups: control, model, Tuina, and orexin antagonist. Behavioral assessments (open field test, pentobarbital-induced sleep test) were conducted, and the expression of Orexin-A in the hypothalamus was detected via real-time quantitative PCR and immunohistochemistry. The protocol aims to evaluate the efficacy of Tuina and investigate its potential mechanism related to the orexin system, providing a reference for the application and mechanistic study of Tuina in sleep disorders.
Introduction
Insomnia, characterized by dissatisfaction with sleep duration or quality leading to daytime impairment, is a prevalent global health issue with a significant burden on individuals and healthcare systems1,2. In China, the prevalence of insomnia is notably high, further exacerbating its public health impact3. This disorder is associated with impaired cognitive function, increased risk of cardiovascular diseases, and high comorbidity with psychiatric conditions like depression and anxiety4,5. Current clinical management primarily relies on cognitive behavioral therapy and pharmacotherapy, notably benzodiazepines and non-benzodiazepine sedative-hypnotics. However, their long-term application is constrained by drug dependence, tolerance, residual daytime effects, and withdrawal symptoms, highlighting the need for effective non-pharmacological alternatives6. In clinical practice, Tuina is particularly suitable for patients with chronic primary insomnia seeking non-pharmacological interventions, especially for elderly individuals at high risk of medication dependence, as well as pregnant or breastfeeding women7.
As a cornerstone of Traditional Chinese Medicine external therapy, Tuina has demonstrated unique advantages in treating insomnia8. Meta-analytic evidence shows Tuina significantly outperforms drugs or acupuncture alone in total effective rate (OR = 4.12), sleep quality, and anxiety-depressive states, with high safety9. Specific Tuina protocols offer distinct advantages: traditional Tuina achieves 89.5% efficacy for phlegm-heat type insomnia, abdominal rubbing reduces relapse rates to 14.7% (vs. 38.2% with conventional Tuina)10. The three-part Tuina method boosts herbal therapy efficacy from 80.49% to 92.68% while improving sleep architecture and neurotransmitter profiles11. Clinical studies and systematic reviews have confirmed that Tuina can significantly improve sleep quality, reduce anxiety and depression scores, and modulate serum levels of neurotransmitters like 5-hydroxytryptamine (5-HT)12. Its therapeutic effects are believed to be mediated through holistic regulation of the neuro-endocrine-immune network. Recent research has increasingly focused on the orexin system, a key neuropeptide system originating from the lateral hypothalamus that is crucial for promoting and maintaining wakefulness13. Abnormal overactivity of orexin neurons is implicated in the pathophysiology of insomnia, while inhibition of this pathway has shown therapeutic potential14. Preliminary evidence suggests that manipulations like abdominal rubbing can influence brain levels of Orexin-A in sleep-deprived rats12, yet a systematic investigation into whether Tuina exerts its anti-insomnia effects specifically through modulating the orexin system is lacking.
Therefore, based on a rat model of primary insomnia, this study aims to: (1) Evaluate the improvement of sleep behavior following standardized Tuina intervention using behavioral tests; and (2) Investigate the underlying mechanism by examining whether Tuina’s effect is associated with the downregulation of Orexin-A expression in the hypothalamus, comparing its efficacy with that of an orexin receptor antagonist. This research seeks to provide experimental evidence for the central mechanism of Tuina in treating insomnia.
Protocol
All experimental procedures and animal welfare assessments were approved by the Animal Ethics Committee of Xinjiang Medical University (ethics approval number: IACUC-20020158). The protocol follows institutional guidelines for animal care and use. The reagents and the equipment used are listed in the Table of Materials.
1. Animal preparation
- House 64 specific pathogen-free (SPF) Wistar rats (body weight 250 g ± 50 g, equal sex distribution) in an SPF barrier system at 18–22 °C with a 12 h light-dark cycle. Provide food and water ad libitum.
- After 1 week of adaptive feeding, randomly divide rats into 4 groups (n = 16 per group): control (Group A), model (Group B), Tuina (Group C), and antagonist (Group D).
2. Establishment of the primary insomnia model
NOTE: Except for Group A, rats in Groups B, C, and D undergo the following modeling procedure.
- Prepare a plastic cylindrical container (top diameter: 30 cm, height: 40 cm) as the rat box.
- Fix a cylindrical platform (diameter: 6 cm, height: 10 cm) at the bottom of the container.
- Add water to the container until the water level is 1 cm below the platform surface. Maintain water temperature at 20 °C.
- Place a circular iron mesh (diameter: 25 cm, mesh size: 1 cm) horizontally inside the container, 15 cm above the platform. Secure the mesh to the container rim using thin iron wires.
- Place drinking water and food on the iron mesh. Replace water daily, and clean and disinfect the container.
- Place one rat per container on the platform for 8 consecutive days.
3. Model evaluation using pentobarbital sodium synergistic sleep test
- The pentobarbital sodium solution is prepared by directly introducing ultrapure water. Weigh 1.0 g of powder, add sterilized ultrapure water to 100 mL, dissolve, and filter at 0.22 µm to obtain a 1% (10 mg/mL) solution.
- On day 9, inject all rats intraperitoneally with pentobarbital sodium solution at the minimum threshold dose that induces sleep (determined in preliminary experiments).
- Record sleep latency (time from injection to first loss of righting reflex) and sleep duration (time from loss to recovery of righting reflex). Define loss of righting reflex for 1 min as sleep onset, and its recovery as sleep end.
4. Tuina intervention
NOTE: Interventions begin on the day after successful model evaluation and continue once daily for 14 consecutive days. Group A and Group B undergo restraint in a fixation frame for 10 min daily. Operators receive rigorous training before the experiment to ensure consistency in force, frequency, and rhythm.
- For Group C, fix the rat in supine position on an operating table.
- Gently fix the rat’s four limbs using the five fingers of the left hand, fully extending the abdomen.
- Perform abdominal Tuina with the right hand: use the pulp of the distal phalanx of the middle finger to apply force at the Guanyuan point (CV4, located 25 mm below the umbilicus). Keep the remaining four fingers naturally extended.
- Drive the middle finger using small anterolateral circular movements from the shoulder joint, performing counterclockwise circular translational friction on the abdomen.
- Follow a closed circular path formed by Jiuwei (CV15, 5 mm below the xiphoid process), Guanyuan (CV4), and bilateral Daimai points (GB26, midpoint between the free end of the 12th rib and the iliac crest superior border).
- Maintain smooth, steady, continuous circular movement at 5–7 cycles/min.
- Perform counterclockwise manipulation for 5 min, then clockwise manipulation for 5 min.
- Ensure force is steady and firm, with the rat remaining calm and not struggling. Apply the intervention once daily for 14 days.
5. Antagonist administration
- For Group D, administer MK-4305 (10 mg/kg) by intragastric gavage once daily for 14 days. Dissolve MK-4305 in normal saline to prepare a 5 mL solution.
6. Open field test
- After the intervention period, perform the open field test using a black cubic box (base: 100 cm × 100 cm, height: 40 cm). Divide the floor into 25 equal squares by gray lines (16 peripheral, 9 central).
- Place the rat into the central square and start timing.
- Record total distance traveled, number of rearing episodes, and time spent in the central area over 3 min using an image acquisition system.
- After each test, remove feces and clean the floor and inner walls with 75% ethanol.
- Image acquisition system operation
- Set up the image acquisition system. Mount a digital CCD camera (resolution: 1280 × 720 pixels; frame rate: 25 fps) vertically 1.5 m above the open field. Connect the camera to a computer through a USB interface.
- Configure the tracking software and analysis settings. Perform automated tracking using behavioral video analysis software. Set the tracking parameters as follows:
- Define the tracking focus as the center point (center of mass) of the rat.
- Set the frame rate to 25 fps for both image acquisition and analysis.
- Calibrate the spatial resolution so that each pixel corresponds to 1.5 mm of actual distance based on the dimensions of the open field and the video resolution.
- Set the background-subtraction threshold to 15 gray levels (range: 0–255) to distinguish the rat from the background.
- Set the minimum event duration to 0.2 s (5 frames) to minimize false-positive detections caused by noise.
- Divide the open field virtually into 5 × 5 equal-area squares (Zones 1–25). Define the central zone as Zones 7, 8, 9, 12, 13, 14, 17, 18, and 19 (the central 3 × 3 squares, representing 36% of the total area). Define the peripheral zone as the remaining squares.
- Record the following output parameters: total distance traveled (mm), average velocity (mm/s), time spent immobile (s), time spent moving (s), time spent in each zone (s), distance moved in each zone (mm), number of entries into each zone, and number of rearing episodes. Verify rearing episodes manually.
7. Perfusion for immunohistochemistry
NOTE: Use 4 rats from each group for immunohistochemistry.
- Prepare 0.9% saline (pre-warmed to 37 °C) and 4% paraformaldehyde solution (stored at 4 °C).
- Deeply anesthetize rats with intraperitoneal urethane (25% solution, 0.6 mL/100 g body weight). Confirm loss of pedal, corneal, and righting reflexes.
- Secure the rat supine on a foam board. Rapidly open the chest cavity by cutting through skin, fascia, and sternum.
- Retract the heart gently to expose the aorta. Insert a needle through the left ventricular apex into the aorta until the needle tip is visible in the aortic lumen. Ensure the needle, left ventricle, and aorta are aligned horizontally.
- Clamp the aorta and needle together with hemostatic forceps. Immediately snip the right atrium to allow blood outflow.
- Perfuse with 150–200 mL of pre-warmed 0.9% saline (37 °C). Successful perfusion is indicated by blanching of the liver, mesentery, and forelimbs, and clear fluid from the right atrium.
- Switch to cold 4% paraformaldehyde (4 °C) and perfuse 400 mL. Perform initial perfusion rapidly until whole-body muscle fasciculations and limb stiffening occur. Then reduce the flow rate to 2 drops/s until all fixative is perfused.
- Confirm successful fixation when the brain appears pale and firm.
8. Brain dissection
- After perfusion, decapitate the rat and carefully remove the whole brain from the skull.
- Incise the skull along the sagittal suture using scissors. Peel away parietal and occipital bones with bone rongeurs.
- Gently lift the brain with a spatula, severing cranial and optic nerves with fine scissors.
- For immunohistochemistry: Immediately transfer the whole brain into 4% paraformaldehyde and post-fix at 4 °C for 24 h.
- For real-time quantitative PCR: Rinse the brain surface with pre-chilled saline, blot dry with filter paper, freeze in liquid nitrogen for 5–10 min, and store at –80 °C. Perform all steps on ice.
9. Immunohistochemical staining
- Embed hypothalamic tissue in paraffin and cut coronal sections at 4–5 µm thickness using a microtome. Mount sections onto anti-drop slides, bake at 65 °C for 1.5–2 h.
- Dewax sections in xylene I and II (10 min each). Rehydrate through graded ethanol: anhydrous ethanol I and II (5 min each), then 95%, 90%, 80%, 70% ethanol (5 min each), then distilled water (5 min).
- Perform antigen retrieval by placing sections in boiling 0.01 M citrate buffer (pH 6.0) in a pressure cooker. Heat until the pressure valve rises, then turn off the heat. Soak for 10 min, then cool naturally to room temperature.
- Inactivate endogenous peroxidase by immersing sections in fresh 3% H₂O₂ for 10 min at room temperature. Wash 3× with PBS (5 min each).
- Circle tissue with an immunohistochemistry pen. Apply rabbit anti-HCRT/Orexin-A polyclonal antibody (dilution 1:50, ~50 µL per slide). Incubate overnight at 4 °C in a humidified box.
- Next day, rewarm at room temperature for 20 min. Wash 3× with PBS (5 min each).
- Apply horseradish peroxidase-labeled secondary antibody. Incubate 20 min at room temperature. Wash 3× with PBS (3 min each).
- Apply horseradish peroxidase-labeled streptavidin working solution. Incubate 20 min at room temperature. Wash 3× with PBS (5 min each).
- Prepare DAB chromogen solution (0.85 mL distilled water + 50 µL each of reagents A, B, C). Apply to sections and develop for 3–10 min at room temperature, monitoring under a microscope. Stop reaction by immersing in tap water for 3 min.
- Counterstain with hematoxylin for 3 min. Differentiate in 1% hydrochloric acid alcohol for 1–2 s. Blue in tap water for 5 min.
- Dehydrate through distilled water (3 min), 70%, 80%, 90%, 95% ethanol (3 min each), and anhydrous ethanol I and II (5 min each). Clear in xylene I and II (5 min each).
- Apply neutral balsam and coverslip. Dry overnight at 37 °C.
- Observe and photograph sections using a light microscope (40×, 100×, 200×, 400×). Count Orexin-A positive cells (brown granular precipitate in cytoplasm) using ImageJ.
- Calculate total score (0–12) as staining intensity score (0 = negative, 1 = light yellow, 2 = light brown, 3 = dark brown) multiplied by positive cell percentage score (0 = 0%, 1 = 1–25%, 2 = 26–50%, 3 = 51–75%, 4 = 76–100%). Define 1–5 as low expression, 6–12 as high expression.
10. Real-Time quantitative PCR for Orexin-A mRNA
- RNA processing after tissue thawing must be performed under RNase-free conditions. The specific RNase-free requirements are as follows:
- Working environment: Use a dedicated RNA work area that has been wiped with an RNase decontaminant and exposed to UV irradiation.
- Consumables: Use certified RNase-free centrifuge tubes and pipette tips, or alternatively, soak them in 0.1% DEPC water followed by autoclaving.
- Reagents: Use RNase-free lysis buffer and DEPC-treated water.
- Operation: Wear powder-free gloves throughout the procedure, change gloves frequently, and avoid direct contact with the interior of consumables and the samples.
- Experimental procedure
NOTE: During the RNA extraction and reverse transcription steps, all consumables and tools that come into contact with RNA or reverse transcription reagents must be RNase-free. In the PCR amplification stage, since cDNA is a double-stranded structure and RNase cannot degrade double-stranded DNA, consumables and tools at this stage need only be free of DNase and other impurities that may inhibit PCR reactions; additional RNase-free treatment is not required. Grind frozen hypothalamic tissue under liquid nitrogen. Weigh 50–100 mg of tissue powder into a tube with 1 mL Trizol. Mix and stand at room temperature for 15 min.
- Add 200 µL chloroform, mix by inversion, and stand at room temperature for 5 min. Centrifuge at 12,000 × g for 15 min at 4 °C.
- Transfer the upper aqueous phase to a new tube. Add equal volume of isopropanol, mix, and stand at –20 °C for 35 min. Centrifuge at 12,000 × g for 15 min at 4 °C. Discard the supernatant.
- Wash the precipitate with 75% ethanol, centrifuge at 12,000 × g for 15 min at 4 °C. Discard the supernatant and repeat the wash once.
- Air-dry precipitate at room temperature. Dissolve in RNase-free water.
- Measure RNA concentration and purity (A260/A280 ratio 1.8–2.1). Assess integrity by 1% agarose gel electrophoresis (clear 28S and 18S bands, weak or absent 5S band).
- Prepare reverse transcription reaction (20 µL): 800 ng total RNA, 1 µL Random Primer (0.1 µg/µL), 10 µL 2× TS Reaction Mix, 1 µL TransScript RT/RI Enzyme Mix, 1 µL gDNA Remover, and RNase-free water to volume.
- Incubate at 25 °C for 10 min, then 85 °C for 5 s to synthesize first-strand cDNA. Dilute cDNA 1:1 with RNase-free water.
- Prepare qPCR reaction (10 µL): 5 µL EvaGreen 2× qPCR MasterMix, 0.3 µL forward primer (10 µM), 0.3 µL reverse primer (10 µM), 1 µL cDNA template, RNase-free water to volume. Run in triplicate.
NOTE: Primers: Orexin-A-F: 5’-CGCCAGAAGACGTGTTCCT-3’; Orexin-A-R: 5’-GCCGCTTTCCCAGAGTGAG-3’ (product length 88 bp); β-Actin-F: 5’-CCCATCTATGAGGGTTACGC-3’
β-Actin-R: 5’-TTTAATGTCACGCACGATTTC-3’ (product length 150 bp). - Run qPCR program: 95 °C for 30 s (pre-denaturation); 40 cycles of 95 °C for 5 s (denaturation) and 60 °C for 30 s (annealing/extension).
- Verify amplification and melting curves. Run 5 µL of product on 2% agarose gel to confirm specificity.
- Calculate relative Orexin-A mRNA expression using the 2⁻ΔΔCt method with β-Actin as internal control.
11. Statistical analysis
- Use SPSS 26.0 for data analysis. Express all data as mean ± standard deviation. For comparisons between two groups, use independent samples t-test if data are normally distributed; otherwise use Mann-Whitney U test.
- For comparisons among multiple groups, use one-way ANOVA with LSD post-hoc test for homogeneous variances or Tamhane’s test for heterogeneous variances. If data are not normally distributed, use Kruskal-Wallis H test.Consider P < 0.05 statistically significant.
Results
Table 1 shows that compared with group A, the sleep latency in groups B, C, and D was significantly prolonged, and the sleep duration was significantly shortened after modeling, indicating that the primary insomnia rat model was successfully established. The findings in Table 2 and Table 3 offer preliminary support for the therapeutic effect of Tuina in treating insomnia. The Open Field Test (OFT) is one of the most classic and commonly used paradigms in behavioral neuroscience for evaluating anxiety-like behavior in rodents15. Studies have shown that preference for the four corner area is a sensitive indicator for measuring anxiety-like behavior, and it may be more discriminative than the central area indicator in moderate to low levels of anxiety. The insomnia model rats exhibited significant anxiety-like behaviors and changes16,17 in exploratory behavior, while the Tuina intervention effectively alleviated the anxiety-like behaviors in these rats. The molecular biology results presented in Table 4 and Table 5, and Figure 1 further demonstrate that Tuina effectively downregulates the overexpression of Orexin-A in the hypothalamus of insomnia model rats.
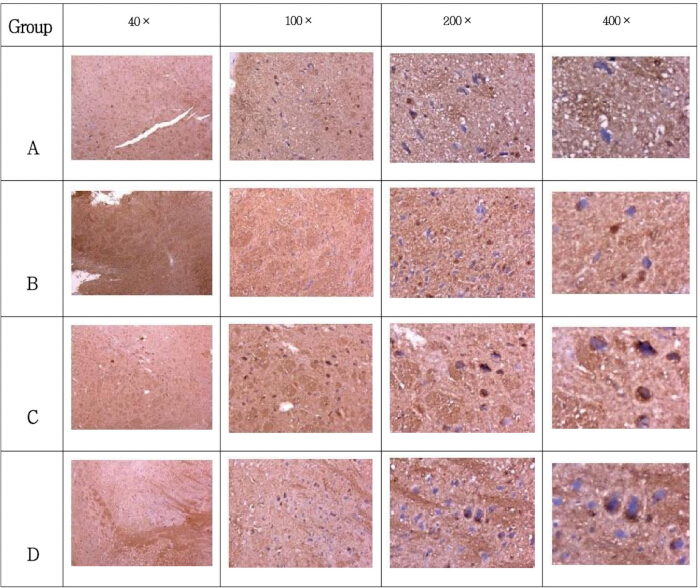
Figure 1: Immunohistochemical staining results of Orexin-A in the hypothalamus of rats in each group (40×, 100×, 200×, 400×). (A) Orexin-A positive neurons were observed in the rat hypothalamic tissue, appearing as dark brown granular signals. The staining intensity score was 3 points, the percentage of positive cells was 40% (falling within the 26%–50% range, scoring 2 points), and the total score was 6 points, which falls within the high-expression range. (B) The number of Orexin-A positive neurons in the rat hypothalamic tissue was significantly increased compared to the normal group, with a denser distribution of positive cells. The staining intensity score was 3 points (dark brown), the percentage of positive cells reached 80% (falling within the 76%–100% range, scoring 4 points), and the total score was 12 points, which falls within the high-expression range. (C) The number of Orexin-A positive neurons in the rat hypothalamic tissue was reduced compared to the model group. The staining intensity score was 3 points (dark brown), the percentage of positive cells was 75% (falling within the 51%–75% range, scoring 3 points), and the total score was 9 points, which falls within the high-expression range. (D) The number of Orexin-A positive neurons in the rat hypothalamic tissue was also reduced compared to the model group. The staining intensity score was 3 points (dark brown), the percentage of positive cells was 60% (falling within the 51%–75% range, scoring 3 points), and the total score was 9 points, which falls within the high-expression range. Please click here to view a larger version of this figure.
| Group | Sleep Latency / min | Sleep Duration / min |
| A | 4.13 ± 1.80 | 49.75 ± 38.46 |
| B | 6.31 ± 2.80* | 22.13 ± 11.41* |
| C | 6.33 ± 2.60* | 24.93 ± 14.43* |
| D | 6.53 ± 1.90* | 24.73 ± 17.59* |
Table 1: Comparison of pentobarbital sodium-induced sleep tests among groups after modeling. * indicates P < 0.05 compared to the control group.
| Group | Rearing Frequency | Immobility Time (s) | Locomotion Time (s) | Locomotion Distance (m) | Time in Center Zone (s) | Distance in Center Zone (m) | Time in Corner Zone (s) | Distance in Corner Zone (m) | Time in Corner Zone (s) | Distance in Lateral Zone (m) |
| A | 1.875 ± 0.835 | 76.700 ± 34.324 | 103.350 ± 34.307 | 18.318 ± 16.314 | 8.750 ± 7.718 | 2.937 ± 5.112 | 103.000 ± 28.582 | 6.315 ± 3.893 | 56.600 ± 27.772 | 6.705 ± 3.666 |
| B | 7.125 ± 5.668 | 31.513 ± 10.964 | 148.488 ± 10.964 | 22.399 ± 9.159 | 16.275 ± 10.703 | 3.244 ± 2.991 | 75.088 ± 21.561 | 6.578 ± 1.972 | 85.463 ± 23.374 | 11.724 ± 4.959 |
| T-value | -2.592 | 3.547 | -3.545 | -0.617 | -1.613 | -0.146 | 2.205 | -0.171 | -2.249 | -2.302 |
| P-value | 0.035 | 0.007* | 0.007* | 0.547 | 0.129 | 0.886 | 0.045* | 0.867 | 0.041* | 0.037* |
Table 2: Analysis of the influence of each indicator level between the control group (A) and the model group (B).* indicates P < 0.05 compared to the control group.
| Group | Rearing Frequency | Immobility Time (s) | Locomotion Time (s) | Locomotion Distance (m) | Time in Center Zone (s) | Distance in Center Zone (m) | Time in Corner Zone (s) | Distance in Corner Zone (m) | Time in Corner Zone (s) | Distance in Lateral Zone (m) |
| B | 5.875 ± 2.295 | 29.819 ± 12.871 | 150.219 ± 12.867 | 19.165 ± 8.054 | 24.838 ± 13.068 | 3.178 ± 2.438 | 69.075 ± 13.992 | 5.823 ± 1.422 | 83.019 ± 15.464 | 9.878 ± 4.393 |
| C | 6.357 ± 0.627 | 35.993 ± 32.237 | 144.021 ± 32.246 | 23.291 ± 4.873 | 14.321 ± 3.774 | 3.106 ± 2.214 | 87.057 ± 12.658 △ | 8.087 ± 1.496 △ | 68.943 ± 9.240 | 10.420 ± 1.225 |
| D | 6.667 ± 1.633 | 30.808 ± 15.389 | 149.200 ± 15.380 | 18.584 ± 4.969 | 27.792 ± 12.460 | 3.085 ± 1.114 | 74.600 ± 22.248 | 5.744 ± 1.291▲ | 74.192 ± 17.011 | 9.465 ± 3.380 |
Table 3: Analysis of the influence of each indicator level among the model group (B), Tuina group (C), and antagonist group (D). △P < 0.05 compared with the model group (B); ▲P < 0.05 compared with the Tuina group (C).
| Group | Orexin-A |
| A | 1.011 ± 0.173 |
| B | 10.436 ± 2.512△ |
| C | 2.392 ± 0.998▲ |
| D | 3.227 ± 1.703▲ |
Table 4: Orexin-A mRNA expression levels in hypothalamic tissue. △P < 0.05 compared with the control group (A); ▲P < 0.05 compared with the model group(B).
| Group | Orexin-A | |||
| Staining Intensity | Percentage of Positive Cells | Percentage Score | Score | |
| A | 3 | 40% | 2 | 6 |
| B | 3 | 80% | 4 | 12 |
| C | 3 | 75% | 3 | 9 |
| D | 3 | 60% | 3 | 9 |
Table 5: Immunohistochemical staining scores of Orexin-A in the hypothalamus of rats in each group. Staining intensity scoring criteria: 0 = negative staining (colorless), 1 = light yellow, 2 = light brown, 3 = dark brown. Percentage of positive cells scoring criteria: 0 = 0%, 1 = 1%–25%, 2 = 26%–50%, 3 = 51%–75%, 4 = 76%–100%. Total score = staining intensity score × percentage score. Total scores of 1–5 were defined as low expression, and scores of 6–12 were defined as high expression.
Discussion
This study aimed to assess the efficacy of Tuina in a primary insomnia rat model and explore its potential mechanism related to the hypothalamic orexin system. The current findings demonstrate that a standardized Tuina protocol significantly improved sleep latency and duration, alleviated anxiety-like behaviors, and effectively downregulated the overexpression of Orexin-A at both mRNA and protein levels in the hypothalamus. Notably, the effect of Tuina was comparable to that of the orexin receptor antagonist MK-4305, suggesting that modulation of the orexin system may be a pivotal mechanism through which Tuina alleviates insomnia.
Compared to pharmacological interventions, Tuina, as a non-invasive external therapy, offers advantages in safety, minimal side effects, and patient compliance12,18. Its therapeutic benefits for insomnia are supported by clinical evidence showing improvements in sleep quality and psychological state18,19. The mechanism is multifaceted, involving regulation of the hypothalamic-pituitary-adrenal axis, autonomic nervous system homeostasis, and key neurotransmitters like 5-HT18,20. The results extend this understanding by pinpointing the orexin system as a specific target. Orexin neurons are central drivers of wakefulness, and their hyperexcitability is linked to sleep instability21,22,23. The downregulation of orexin-A observed after Tuina seems to be consistent with the effect of the novel insomnia drug dual orexin receptor antagonist, highlighting a possible convergent pathway between pharmacological and non-pharmacological interventions24,25.
While this study builds upon our previously published work regarding abdominal Tuina and orexin-A regulation25, the current manuscript represents a substantial extension and methodological refinement beyond the original report. Specifically, this study expands the sample size to 64 rats to enhance statistical power and introduces a comprehensive battery of behavioral assessments, including the open field test and pentobarbital-induced sleep tests, to systematically evaluate sleep architecture and anxiety-like behaviors, which were not addressed in the prior study. Unlike the previous work, which focused heavily on oxidative stress and classical neurotransmitters, this article prioritizes the functional validation of the orexin system through integrated behavioral outcomes and molecular assays, serving as a standalone mechanistic investigation that complements rather than replicates the previous findings.
The experimental design adhered to TCM theory by focusing on the abdomen and specific acupoints like Guanyuan (CV 4), which is believed to tonify primordial Qi and regulate visceral function, within a closed-loop manipulation path26,27. The parameters (frequency, duration, course) were standardized based on preliminary work to ensure consistency and reproducibility, a crucial aspect for mechanistic animal studies12.
However, this protocol has limitations. First, the intervention was administered at a single time point post-modeling. Future studies should investigate different intervention durations and frequencies to establish an optimal “dose-response” relationship for Tuina. Second, this study is an observational research design. Although a correlation was found between Tuina and reduced expression of Orexin-A and behavioral improvement, it is still unclear whether this association is a direct or indirect effect of Tuina or other factors. Future research can use experimental strategies such as gene knockout, chemogenetic inhibition, or antagonist blockade to further verify whether Tuina improves insomnia behavior by regulating Orexin-A expression, thereby elucidating its causal mechanism. Finally, this study did not establish a sham operation or placebo intervention control group. However, this study has taken this into consideration during design, and all groups of animals received the same level of grasping and fixation operations, which, to some extent, controlled for the influence of non-specific stress factors. In addition, the frequency, intensity, and action pathway of the Tuina program in this study were standardized based on preliminary experiments to ensure consistency and reproducibility of the intervention. Future research should focus on developing more rigorous control methods, such as using non-contact simulation or minimal tactile stimulation, to clarify the specific effects of Tuina operations.
Key steps critical to the success of this protocol include: first, strict control of water temperature and platform dimensions in the modified multiple platform water environment method; second, pre-experimental titration of the sub-threshold pentobarbital sodium dose; third, standardization of Tuina manipulation parameters (frequency of 5–7 cycles/min, counterclockwise then clockwise manipulation for 5 min each) and operator training; and fourth, rapid freezing of hypothalamic tissue in liquid nitrogen followed by RNase-free handling to ensure the stability of Orexin-A mRNA.
Possible modifications include: first, the development of an automated mechanical Tuina device to reduce inter-operator variability; second, the use of EEG/EMG telemetry to replace the pentobarbital sodium sleep test, enabling continuous sleep stage monitoring; and third, the combination of chemogenetic or optogenetic approaches to verify the necessity of orexin neurons in mediating the effects of Tuina.
The reproducibility of this protocol is underpinned by: detailed operational trajectories and parameters, the use of a positive control drug, dual-dimension detection at both protein and mRNA levels, and rigorous statistical reporting. Its practical usability is reflected in the following aspects: low equipment requirements for behavioral tests without the need for expensive telemetry systems; a total experimental cycle of just 8 days for modeling and 14 days for Tuina intervention, completing within 4 weeks, which aligns well with the funding cycles and laboratory schedules of most routine research projects, facilitating rapid data collection and methodological validation. Furthermore, the Tuina manipulation protocol is clearly quantified in terms of operational trajectory (CV15 → CV4 → bilateral GB26 → return to CV15), frequency (5–7 cycles/min), directional sequence (counterclockwise followed by clockwise), and duration (10 min per session). These specifications allow different operators to master the technique after brief training, thereby reducing the risk of poor reproducibility caused by individual differences commonly seen in manual manipulation studies.
During the implementation of this protocol, several common problems may arise, and appropriate troubleshooting measures are recommended. First, rats may fall off the platform during the modified multiple platform water environment procedure. This is usually caused by an excessively slippery platform surface. The solution is to lightly roughen the platform surface with fine sandpaper to increase friction. In addition, each container should house only one rat to avoid mutual disturbance. Second, the pentobarbital sodium sleep test may fail to show significant differences between groups. The solution is to re-titrate the minimal sub-threshold dose in 5 mg/kg increments during pilot experiments using a separate cohort of animals (3–4 per group). Injections should be performed at the same time each day (preferably between 9:00 and 11:00 AM) to minimize circadian variation. Third, rats may struggle or vocalize during Tuina manipulation, which typically indicates excessive force or improper restraint. The operator should reduce the applied force until the rat remains calm without struggling. Prior training using a pressure-sensing dummy is recommended to standardize force application. The rat should be positioned supine with all four limbs gently but securely fixed, ensuring full exposure of the abdomen. Fourth, large variability in the percentage of Orexin-A positive cells within the same experimental group often arises from inconsistent section planes across the hypothalamus, subjective counting bias, or batch-to-batch variation in staining. The recommended solution is to standardize the anatomical level by referring to a rat brain atlas (e.g., Paxinos & Watson), collecting coronal sections from bregma –1.8 mm to –3.3 mm for hypothalamic analysis. Two independent observers blinded to group allocation should perform cell counting, and the average value should be used. All samples for a given outcome measure should be stained in the same batch, and semi-automated threshold analysis using ImageJ is encouraged to reduce observer subjectivity.
In conclusion, this study established a standardized Tuina intervention protocol and a multi-level evaluation system in a primary insomnia model. It provides compelling evidence that Tuina improves insomnia behaviors, potentially through a mechanism involving the suppression of hypothalamic Orexin-A overexpression. This methodological framework not only offers a reproducible paradigm for investigating the central mechanisms of Tuina but also provides a reference for mechanistic studies of other non-pharmacological interventions for sleep disorders.
Disclosures
The authors declare that there are no conflicts of interest.
Acknowledgements
This study is supported by the Natural Science Foundation of Xinjiang Uygur Autonomous Region (No. 2025D01C219) and the National Natural Science Foundation of China (NO. 81860885, 82474666). The funders had no role in the design, execution, or writing of the study.
Materials
| Name | Company | Catalog Number | Comments |
|---|---|---|---|
| 5x All-In-One RT MasterMix | abm | G492 | cDNA synthesis |
| Acetylcholine (Ach) | Nanjing Jiancheng | A105-1 | ELISA reagent |
| Adhesion microscope slides | Jiangsu ShiTai Experimental Equipment Co., Ltd. | N/A | Tissue section mounting |
| Agarose | Sangon Biotech (Shanghai) | A811BA0014 | Gel electrophoresis |
| Anhydrous ethanol | Tianjin Fuyu Fine Chemical Co., Ltd. | N/A | Tissue dehydration |
| Antibody diluent | Beijing ZSGB-Bio Technology Co., Ltd. | ZLI-9029 | Primary antibody dilution |
| Basket | Fuzhou Maxim Biotechnologies Co., Ltd. | N/A | Slide holder |
| Citrate powder | Fuzhou Maxim Biotechnologies Co., Ltd. | MVS-0066 | Antigen retrieval buffer preparation |
| Coverslip | Jiangsu ShiTai Experimental Equipment Co., Ltd. | N/A | Microscopy |
| DAB chromogen kit | Fuzhou Maxim Biotechnologies Co., Ltd. | DAB-1031 | Chromogenic detection |
| DEPC | Sangon Biotech (Shanghai) | B417BA0001 | RNase-free treatment |
| Dopamine (DA) | Wuhan Huamei Bioengineering Co., Ltd. | CSB-E08660r | ELISA reagent |
| Electrophoresis cell | Beijing Liuyi Instrument Factory | DYCZ-21 | Gel electrophoresis |
| Electrophoresis power supply | Beijing Liuyi Instrument Factory | DYY-6C | Gel electrophoresis |
| EvaGreen Express 2× qPCR MasterMix-Low Rox | abm | G891 / MasterMix-EL | qPCR reagent |
| Gamma-aminobutyric acid (γ-GABA) | AMOKE | AE91068Ra | Neurotransmitter ELISA reagent |
| Gel imaging system | Shanghai Tanon | 2500 | Gel documentation |
| H2O2 (30%) | Tianjin Fuyu Fine Chemical Co., Ltd. | N/A | Endogenous peroxidase blocking |
| Hematoxylin staining solution | Fuzhou Maxim Biotechnologies Co., Ltd. | CTS-1097 | Counterstain |
| High-speed refrigerated centrifuge | Shanghai Lishen Scientific Equipment Co., Ltd. | Nefuqe 15R | Sample centrifugation |
| Histamine (HIS) | Nanjing Jiancheng Bioengineering Institute | EH171-1 | ELISA reagent |
| Hot air drying oven | Shanghai Jinghong Experimental Equipment Co., Ltd. | DHG series | Drying samples |
| IHC staining humidity chamber | Fuzhou Maxim Biotechnologies Co., Ltd. | BOX-1001 | Humid incubation chamber |
| Immunohistochemistry staining kit | Beijing ZSGB-Bio Technology Co., Ltd. | SP9000 | IHC staining |
| Incubator | Shanghai Jinghong Experimental Equipment Co., Ltd. | DNP-9272 | Temperature-controlled incubation |
| Induction cooker | Guangdong Midea Living Electric Manufacturing Co., Ltd. | C21-RK2101 | Heating source |
| Microplate reader | Bio-Rad, China | xMark | Absorbance measurement |
| Microscope | Nikon | E200 | Microscopy imaging |
| MK-4305 | Meilun Bio | MB3773 | Experimental reagent |
| Neutral balsam | Beijing ZSGB-Bio Technology Co., Ltd. | ZLI-9555 | Mounting medium |
| Norepinephrine (NA) | Nanjing Jiancheng | H096 | ELISA reagent |
| Nucleic acid and protein quantifier | Beijing Kaiao | K5500 | Nucleic acid quantification |
| Orexin A | Wuhan Huamei Bioengineering Co., Ltd. | CSB-E08860r | ELISA reagent |
| PCR thermal cycler | Bio-Rad, USA | MyCycler Thermal Cycler | PCR amplification |
| Phosphate-buffered saline (PBS) | Fuzhou Maxim Biotechnologies Co., Ltd. | PBS-0060/0061 | Wash buffer |
| Pipette | Eppendorf, Germany | Dragon lab | Liquid handling |
| Pressure cooker | Zhejiang Supor Co., Ltd. | YW20F1 | Antigen retrieval |
| Protein quantification kit | TransGen Biotech | DQ111-01 | BCA protein assay kit |
| Rabbit anti-HCRT (Orexin-A) polyclonal antibody | Sangon Biotech (Shanghai) | D163595 | Primary antibody |
| Real-time PCR instrument | ABI (Thermo Fisher) | QuantStudio 6 Flex | qPCR analysis |
| Refrigerator | Hefei Meiling Co., Ltd. | BCD-249LCK | Sample storage |
| Serotonin (5-HT) | Wuhan Huamei Bioengineering Co., Ltd. | CSB-E08364r | ELISA reagent |
| Staining jar | Generic | N/A | Slide staining container |
| Super immunohistochemistry pen | Fuzhou Maxim Biotechnologies Co., Ltd. | PEN-0002 | Hydrophobic barrier pen |
| Trans2K DNA Marker | TransGen Biotech | BM101 | DNA ladder |
| TRIzol Reagent | Ambion | 15596026 | RNA extraction |
| Vortex mixer | Haimen Kylin-Bell Lab Instruments Co., Ltd. | GL-88B | Laboratory mixer |
| Xylene | Tianjin Fuyu Fine Chemical Co., Ltd. | N/A | Deparaffinization |