Cancer pain remains a major concern in advanced-stage patients. This study conducted a bibliometric analysis of 2,139 publications from the Web of Science Core Collection (WoSCC), PubMed, and Scopus to characterize global research trends in acupuncture for cancer pain over 16 years.
Research Article
Research Trends in Acupuncture for Cancer Pain: A Bibliometric Analysis
* These authors contributed equally
In This Article
Summary
Abstract
Approximately 44% of cancer patients experience pain, with over 50% affected in advanced stages. Opioid therapy, though standard, carries significant side effects. Acupuncture, a traditional Chinese therapy, has shown potential in relieving cancer pain with minimal adverse reactions. This study used bibliometric methods to identify research hotspots and frontiers in acupuncture for cancer pain. Publications (2010–2025) were retrieved from the Web of Science Core Collection, PubMed, and Scopus. CiteSpace 6.4.R1 and VOSviewer 1.6.20 were used for bibliometric and thematic analysis, examining countries, institutions, authors, journals, co-cited references, and keywords. The literature selection process was conducted according to the Preferred Reporting Items for Systematic reviews and Meta-Analyses (PRISMA) guidelines. A total of 2,139 publications were included, showing an overall increasing trend. China led in publication volume; Memorial Sloan Kettering Cancer Center (MSK) was the most productive institution; J. Mao was the most productive author; and J Clin Oncol was the most cited journal. Core keywords included "acupuncture", "breast cancer", "pain", "quality of life", "management", "cancer pain", and "electroacupuncture". Cluster analysis generated 15 thematic clusters. Emerging themes included acupoint stimulation, complementary therapies, symptom management, integrative medicine, and clinical evaluation. This study maps 16-year trends in acupuncture for cancer pain, revealing collaborations, hotspots, and emerging directions to guide future research.
Introduction
Pain ranks among the most prevalent symptoms in cancer patients. It can have a severe negative impact on both their physical and mental health, often leading to negative emotions such as anxiety and anger, and significantly reducing their quality of life.
Per the International Association for the Study of Pain, any chronic pain stemming from the primary tumor, its metastases, or cancer therapy—including pain that persists after treatment—is categorized as cancer pain1. Data indicate that among cancer patients, 44% experience pain symptoms, with 30% suffering from moderate to severe pain. For patients in advanced or metastatic stages, over 50% report experiencing pain2.
Opioids are currently the most used drugs in clinical settings for treating cancer pain, significantly alleviating moderate to severe cancer pain3. However, long-term use of opioids can easily lead to adverse reactions such as constipation, respiratory depression, nausea, dizziness, and cognitive impairment. Although the World Health Organization (WHO) provides guidelines for the use of clinical analgesics, the side effects and drug dependence associated with pain medications pose a major challenge to clinical management4.
Acupuncture has been increasingly investigated as a potential approach for cancer pain management5. Trials and reviews on acupuncture for cancer pain relief continue to emerge, with numerous studies investigating its potential benefits in cancer pain management and reporting minimal adverse events6. The article by Li evaluates research trends in acupuncture for cancer pain management worldwide and outlines the general direction for future clinical cancer pain management7. Previous bibliometric analyses may not fully reflect recent developments and emerging trends in acupuncture for cancer pain management8. Consequently, a new bibliometric analysis of acupuncture for cancer pain is warranted.
Bibliometrics applies mathematical and statistical techniques to quantify and analyze patterns in published literature. The Java-based program CiteSpace was developed in 2004 by Professor Chaomei Chen. Primarily designed for data analysis and visualization, it assists researchers in identifying trends and current states within research subjects9. CiteSpace conceptualizes research fields as a mapping function between research frontiers and foundations, identifying highly cited and pivotal points to help researchers understand emerging trends.
Given this context, a comprehensive review of the existing research on acupuncture for cancer pain is necessary to synthesize findings and identify key knowledge gaps. The integration of multiple databases may provide broader literature coverage and reduce potential bias associated with single-database analyses. In this study, the visualization software CiteSpace analyzed 2,139 publications on cancer pain in the acupuncture field from 2010 to 2025. Using visual bibliometrics, this study comprehensively presents the current status and trends in acupuncture treatment for cancer pain from multiple perspectives, including annual publication volume, country, institution, keywords, citation count, and authors. This study aims to reveal key collaborative partners, research hotspots, and cutting-edge trends through a systematic analysis, thereby providing a foundation for future research.
Protocol
Ethics approval was not required for this study because it involved the analysis of publicly available literature data and did not include direct involvement of human participants or animals.
Data sources
In this study, the Web of Science Core Collection (WoSCC), PubMed, and Scopus were selected as data sources. WoSCC provides structured citation records and supports citation-based analyses. PubMed offers extensive coverage of biomedical and clinical literature. Scopus provides broad multidisciplinary indexing and citation information. The integration of these three databases aimed to improve literature coverage and reduce potential selection bias caused by differences in database indexing.
Search strategy
Search strategies were developed for the WoSCC, PubMed, and Scopus databases. The core search concepts were consistent across databases, while retrieval syntax was tailored to each database's requirements. The detailed search strategies are presented in Table 1. The final search was conducted on January 20, 2026.
Selection criteria
Publications were initially retrieved without restriction on document type. After screening according to predefined eligibility criteria, only English-language publications were included in the final bibliometric analysis. From January 1, 2010, to December 31, 2025, a total of 2,145 records were initially collected. After merging records from different databases, duplicate records were removed. Titles and abstracts were subsequently screened according to predefined eligibility criteria. Finally, 2,139 publications were included in the bibliometric analysis. The literature search strategy is as follows (Figure 1 and Table 1).
Data analysis
To evaluate the final 2,139 articles on acupuncture treatment for cancer pain, a bibliometric analysis was performed. Data management and visualization were conducted using spreadsheet software, bibliometric analysis software including CiteSpace 6.4.R1, and VOSviewer 1.6.20. Two reviewers independently handled study selection, data extraction, and analysis to safeguard the reliability of the findings10. The node types selected for analysis included countries/regions, institutions, authors, keywords, cited references, cited authors, and cited journals. To ensure analytical focus, we employed distinct selection criteria: for countries/regions, institutions, and authors, the top 10 entities were ranked primarily according to publication frequency, with betweenness centrality and citation-related indicators reported where applicable. Keyword analyses were based on occurrence frequency and network characteristics. For cited references, cited journals, and cited authors, the g-index criterion was applied for node selection. N denotes the number of network nodes, Density represents the density of the graph, and E indicates the number of connections11.
Records were retrieved from WoSCC, PubMed, and Scopus and exported with complete bibliographic information and cited references. The exported data included titles, authors, affiliations, abstracts, keywords, publication years, journal information, citation counts, and references. Keywords Plus were obtained from WoSCC when available. After merging records from the three databases, duplicates were removed based on title, authors, publication year, and DOI. Inconsistent information was manually checked and standardized before analysis.
The parameters in CiteSpace were configured as follows: the analysis covered the period from 2010 to 2025, with time slices spanning one year each, and node labels were extracted from the "Term Source" field, including titles, abstracts, author keywords, and Keywords Plus. The selection criterion was set as the modified g-index with k = 25. Cosine similarity was used to calculate link strength. Pathfinder pruning, pruning sliced networks, and pruning the merged network were applied to simplify the networks. The research findings are visualized through co-occurrence and clustering. CiteSpace reveals key focal areas and emerging trends across key dimensions of literature, including countries/regions, institutions, authors, cited references, cited journals, high-frequency keywords, and emerging terms. Author, country/region, and institutional impact are ranked by frequency and centrality, with node size and color in the visualization serving as the primary indicators.
The minimum citation thresholds for documents were set according to the requirements of each analysis. The clustering resolution was set to 1.0, and association strength was used for normalization.
Results
The following data presents the representative bibliometric outcomes generated through the computational workflow detailed in the Protocol. To construct a robust and homogenized dataset from multiple sources, raw export files from PubMed and Scopus were first converted to the Web of Science Core Collection (WoSCC) plain-text format using the built-in data processing utilities in CiteSpace. Following this critical format standardization, all records were merged and subjected to the CiteSpace deduplication module. This algorithmic matching ensured that overlapping records across the three databases were accurately identified and removed, clarifying the precise number of excluded duplicates and yielding the final corpus of unique records. Subsequently, this clean dataset was utilized to generate the specific bibliometric figures. CiteSpace was employed to construct the timeline visualizations, burst detection maps, and institutional collaboration networks using strict time-slicing and node selection criteria. Concurrently, VOSviewer was used to generate the journal and keyword co-occurrence maps, leveraging its association-strength normalization to optimize spatial clustering. In this context, a successful outcome of the analytical technique is visually demonstrated by the generation of highly readable and thematically distinct network maps with clearly defined clusters and properly segregated timelines. These successful outcomes validate the rigor of the aforementioned data conversion, deduplication process, and optimized software parameter selection, including a modified g-index set at k = 25 and Pathfinder pruning applied to both sliced and merged networks. Conversely, suboptimal outcomes manifest as dense, overlapping, and uninterpretable networks resulting from inadequate format conversion, insufficient deduplication, or the omission of crucial network pruning algorithms. By avoiding these methodological pitfalls through rigorous parameter control, the current workflow successfully generated the valid and highly visual bibliometric trends presented below.
Analysis of yearly publication trends
Following the literature search and screening process, a total of 2,139 papers were published between 2010 and 2025. The annual distribution of publications is shown in Figure 2. Although publication volume fluctuates, it exhibits an overall upward trend. From 2010 to 2016, the number of published articles remained relatively low, with fewer than 100 research papers on acupuncture treatment for cancer pain appearing each year. Over time, research interest in acupuncture for cancer pain has increased, as demonstrated by the upward trend in annual publications.
Type of publication
The types of literature on acupuncture treatment for cancer pain include: Journal Article, Article, Review, Letter, Early Access, Meeting Abstract, Article; Early Access, Editorial Material, Article; Editorial, Article; Proceedings Paper, Review; Early Access, Article; Publication with Expression of Concern, Editorial Material; Early Access, News, Review; Book Chapter. Journal articles, original articles, and review articles constitute the three primary publication types, with clinical trials and basic research papers accounting for most of the output in the field of acupuncture treatment for cancer pain (Figure 3).
Analysis of countries
CiteSpace generated the national collaboration network map (Figure 4). Table 2 presents the ten most productive regions in terms of publication output. A total of 64 countries published research in the relevant field. China published 482 articles, ranking first, while the United States and South Korea ranked second and third. Overall, the national collaboration pattern indicates that research on acupuncture for cancer pain has evolved into a globally collaborative field, with increasing interactions among major research-producing countries.
Citation analysis shows that the United States has the highest number of citations at 10,715, while Canada has the highest average citations per article at 35.129. The findings indicate that while China ranks first in the total number of papers, academic achievements from other countries receive relatively greater international recognition.
Analysis of institutions
Based on CiteSpace data, we have listed the top 10 institutions with the highest number of published articles (Table 3). MSK contributed the most publications, with a total of 64 articles. Beijing University of Chinese Medicine ranked second, while Chengdu University of Traditional Chinese Medicine came in third. Six institutions published ≥ 40 papers in this field, demonstrating high academic expertise in acupuncture for cancer pain. As shown in Figure 5, with N = 468 nodes, E = 566 edges, and a network density of 0.0052, institutional collaboration in this field is relatively sparse. Nevertheless, some institutions maintain cooperative relationships.
Analysis of authors
According to CiteSpace data, we identified the 10 most productive authors with the highest number of published articles (Table 4). JUN J MAO contributed the most publications, with a total of 80 articles. Bao, Ting, ranked second, published 44 articles. Both authors have published over 40 papers, demonstrating deep research in this field. As shown in Figure 6, with N = 829, number of connections/edges E = 1410, and network density = 0.0041, the collaboration between authors in related fields is not particularly close and appears relatively dispersed.
JUN J MAO primarily focuses on the pain-relieving effects of acupuncture, electroacupuncture, acupressure, and auricular therapy for cancer pain patients, particularly those with advanced cancer. Randomized controlled trials (RCTs) demonstrate that acupuncture can alleviate pain and other symptoms such as fatigue and insomnia in advanced cancer patients. Within 26 weeks12, acupuncture can also alleviate pain and other symptoms in cancer survivors. Clinical research findings from 2021 indicate that electroacupuncture and auricular acupuncture effectively relieve chronic musculoskeletal pain in survivors of various cancers compared to conventional treatments. Furthermore, these modalities improve sleep disorders in such patients13,14. A secondary analysis of the PEACE trial also demonstrated that both electroacupuncture and auricular acupuncture improved functional performance in the upper and lower limbs of cancer patients with chronic pain compared to the control group. Optimizing pain management through acupuncture prior to rehabilitation facilitated better patient engagement in rehabilitation programs, thereby enhancing the quality of life for patients with chronic cancer pain15.
Leading journals and highly cited journals
According to the VOSviewer analysis, articles included in this study were published in 76 journals. For the journal co-citation analysis, 101 journals were included based on citation relationships. Figure 7 presents the journal co-citation visualization network, in which these journals were classified into five major clusters distinguished by different colors.
Table 5 and Figure 8 list the top 10 most cited journals for the acupuncture treatment of cancer pain research. The most frequently cited journal is Journal of Clinical Oncology (1,489 citations), followed by Pain (1,180 citations). Among the cited journals, Journal of the American Medical Association (JAMA) holds the highest Impact Factor (IF) for 2023 at 120.7. Journal of Clinical Oncology and Journal of the American Medical Association are widely recognized as authoritative publications, while Pain and the Cochrane Database of Systematic Reviews also enjoy high reputations within their respective fields.
Analysis of keywords
The co-occurrence network of literature keywords is shown in Figure 9, featuring 579 nodes and 888 connections. Keywords forming central clusters in the network include "acupuncture", "breast cancer", "pain", "quality of life", "management", "cancer pain", and "electroacupuncture", indicating these terms receive heightened attention in research on acupuncture treatment for cancer pain.
This study conducts a keyword clustering analysis further to examine research hotspots and trends in the field. Figure 10 depicts the analysis yielding 15 clusters, with keywords categorized into four groups. Keywords can be categorized into four groups: 1. Core diseases and symptoms; 2. Intervention methods; 3. Research types and methodologies; 4. Mechanisms. The detailed cluster labels and their relationships are presented in Figure 10. These clusters have recently become hot topics, revealing future research directions.
The keyword timeline map illustrates the temporal evolution of major research themes and the persistence of prominent keywords across different clusters during the study period (Figure 11). As shown in Figure 12, a salience analysis of keywords yielded 25 salient terms. "stimulation", "osteoarthritis", "nausea", "complementary", "care", "acupoint stimulation", "multiple myeloma", "meta analysis", "joint symptoms", "trial", "symptom management", "massage therapy", "complementary therapy", "complementary therapies", "integrative medicine", "risk factors", "bee venom", "risk", "safety", "prevention", "network meta-analysis", "colorectal cancer", "inflammatory factors", "transcutaneous electrical acupoint stimulation", "transcutaneous electrical nerve stimulation", emerge as key research focuses among these keywords. Keyword (Figure 12) emergence enables us to identify keywords with high-frequency change rates within a specific time period, partially indicating future development trends in that field. Starting in 2023, "network meta-analysis", "colorectal cancer", "inflammatory factors", "transcutaneous electrical acupoint stimulation", and "transcutaneous electrical nerve stimulation" emerged as frequently used keywords, reflecting shifts in research priorities within this field in recent years.
DATA AVAILABILITY:
The original bibliometric data analyzed in this study were derived from publicly available databases (Web of Science Core Collection, PubMed, and Scopus). The curated dataset, source data, and related files supporting the analyses are provided in Supplementary File 1.
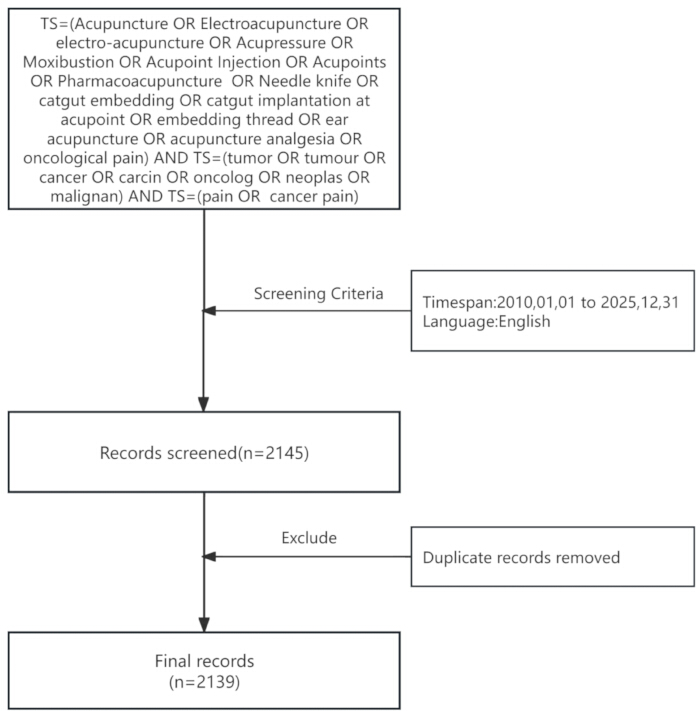
Figure 1: Retrieval flowchart. Flowchart illustrating the study workflow, including literature retrieval from the Web of Science Core Collection (WoSCC), PubMed, and Scopus databases, data conversion, duplicate removal, dataset integration, bibliometric analysis, and visualization. Network analyses and visualizations were performed using CiteSpace and VOSviewer. The literature search covered publications from 2010 to 2025. Please click here to view a larger version of this figure.
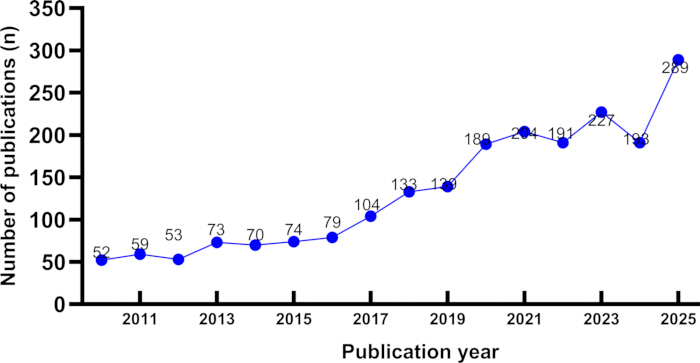
Figure 2: Distribution of publication dates for acupuncture research on cancer pain. Annual publication trends in acupuncture research on cancer pain from 2010 to 2025. Annual publication counts are presented to illustrate the overall growth in research output during the study period. Please click here to view a larger version of this figure.
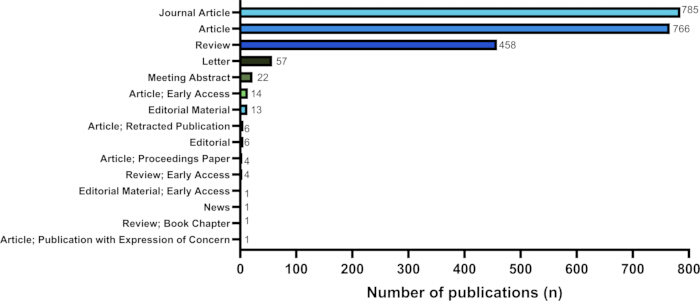
Figure 3: Distribution of included publications by article type from 2010 to 2025. Distribution of publications according to document type among studies retrieved from WoSCC, PubMed, and Scopus between 2010 and 2025. The figure summarizes the composition of the final bibliometric dataset by publication category. Please click here to view a larger version of this figure.
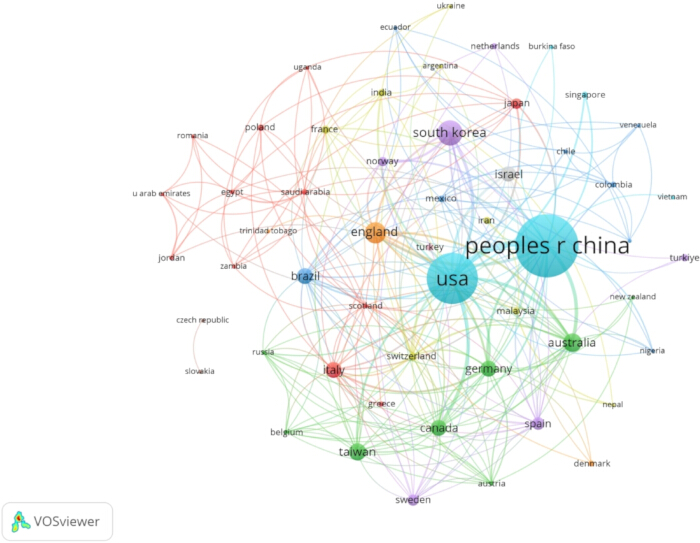
Figure 4: National collaboration network for acupuncture research on cancer pain from 2010 to 2025. Country collaboration network generated using CiteSpace based on publications retrieved from WoSCC, PubMed, and Scopus. Nodes represent countries, node size is proportional to publication frequency, connecting lines indicate collaborative relationships, and purple rings denote countries with high betweenness centrality. Please click here to view a larger version of this figure.
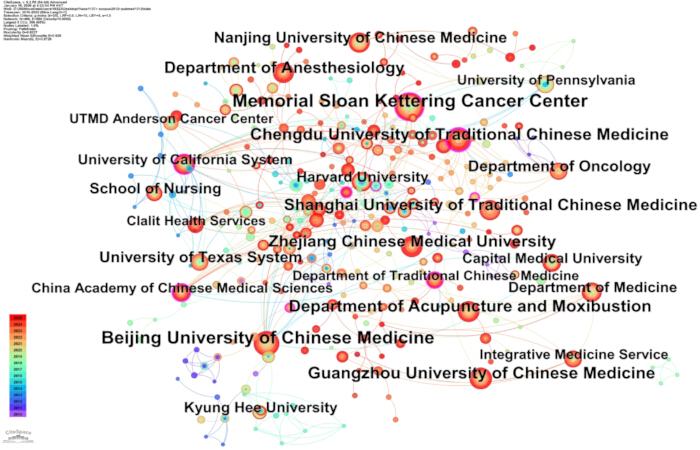
Figure 5: Collaborative network map of institutions involved in acupuncture research for cancer pain management, 2010–2025. Institutional collaboration network generated using CiteSpace. Nodes represent research institutions, node size reflects publication frequency, links indicate collaborative relationships, and purple rings indicate institutions with relatively high betweenness centrality. Please click here to view a larger version of this figure.
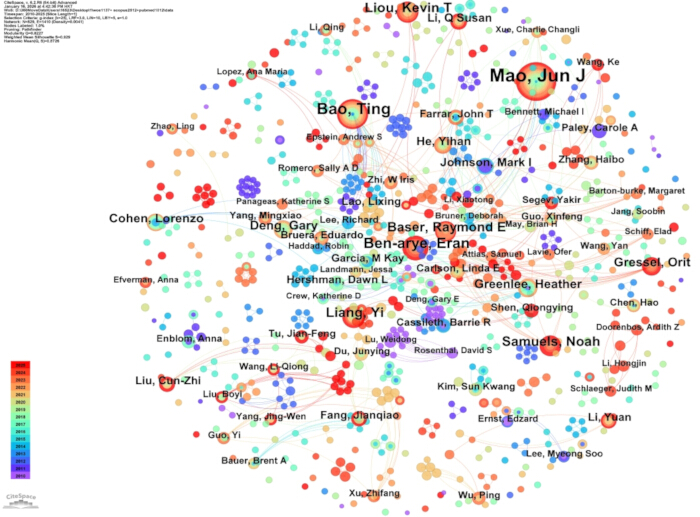
Figure 6: Author network of acupuncture research for cancer pain management from 2010–2025. Author collaboration network generated using CiteSpace. Nodes represent individual authors, node size corresponds to publication frequency, connecting lines indicate co-authorship relationships, and purple rings denote authors with high betweenness centrality. Please click here to view a larger version of this figure.
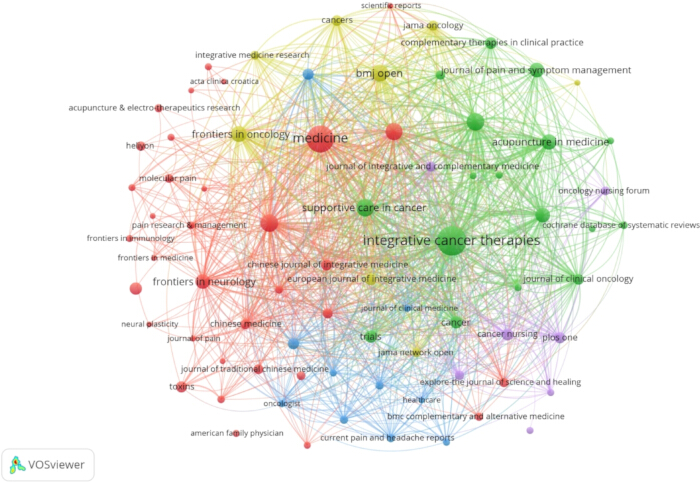
Figure 7: Visualization of journals, 2010–2025. Journal visualization generated using VOSviewer based on publications retrieved from WoSCC, PubMed, and Scopus. Nodes represent journals, node size reflects publication frequency, links indicate relationships between journals, and colors represent clusters identified by the software. Please click here to view a larger version of this figure.
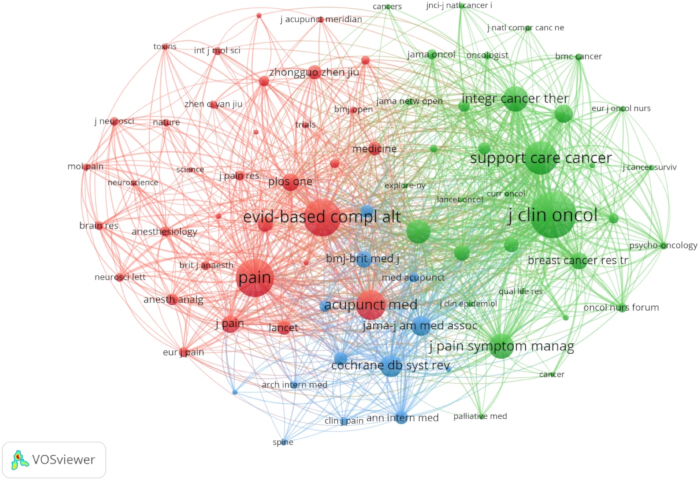
Figure 8: Journal map of acupuncture research for cancer pain management, 2010–2025. Journal co-citation network generated using CiteSpace. Nodes represent cited journals, node size corresponds to co-citation frequency, connecting lines indicate co-citation relationships, and purple rings denote journals with relatively high betweenness centrality. Please click here to view a larger version of this figure.
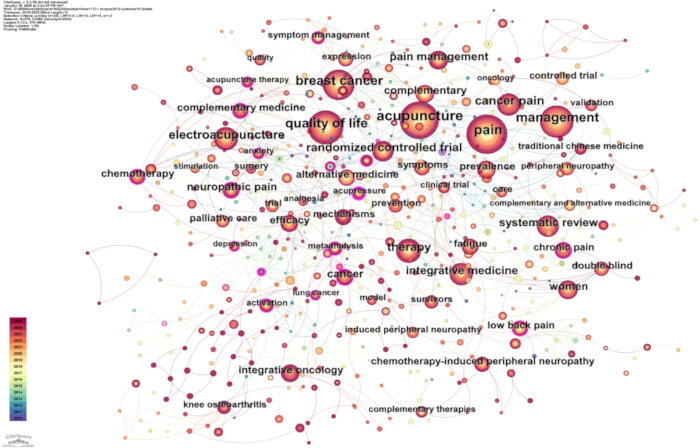
Figure 9: Keyword co-occurrence in acupuncture research for cancer pain management, 2010–2025. Keyword co-occurrence network generated using VOSviewer. Nodes represent keywords, node size is proportional to occurrence frequency, connecting lines indicate co-occurrence relationships, and colors identify keyword clusters within the bibliometric network. Please click here to view a larger version of this figure.
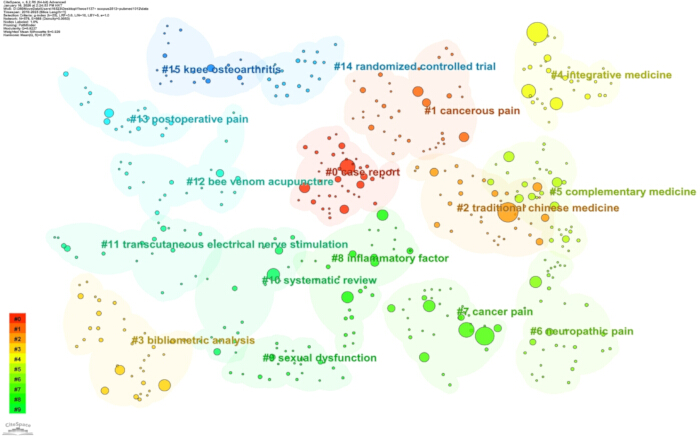
Figure 10: Keyword clustering in acupuncture research for cancer pain management, 2010–2025. Keyword cluster map generated using CiteSpace illustrating thematic groups identified from keyword co-occurrence analysis. Different colors represent distinct research clusters, while node size reflects keyword occurrence frequency. Please click here to view a larger version of this figure.
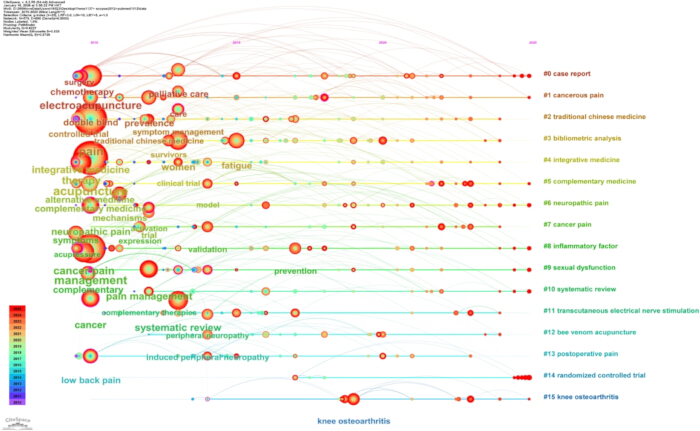
Figure 11: Keyword timeline map for acupuncture research on cancer pain, 2010–2025. Timeline visualization generated using CiteSpace showing the temporal evolution of major keyword clusters. Horizontal lines represent keyword clusters, nodes indicate individual keywords, and their positions correspond to the years in which the keywords appeared or remained active. Please click here to view a larger version of this figure.
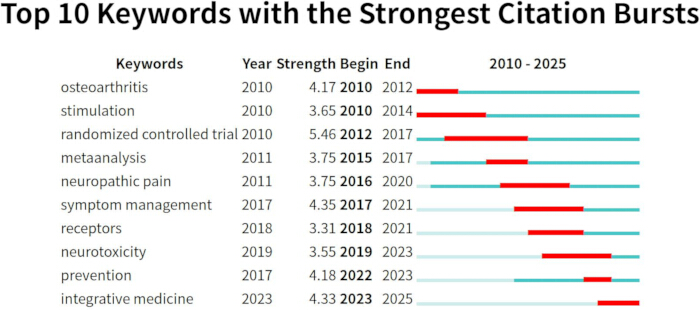
Figure 12: Keyword emergence in acupuncture research for cancer pain treatment, 2010–2025. Keywords with the strongest citation bursts identified using CiteSpace. Burst strength represents periods of rapidly increasing research attention, and the red segments indicate the time intervals during which each keyword exhibited a significant citation burst. Please click here to view a larger version of this figure.
Table 1: Subject retrieval queries. Search strategies used to retrieve publications from the Web of Science Core Collection (WoSCC), PubMed, and Scopus databases. The table presents the database-specific search syntax, search fields, date limits, and retrieval terms used for literature identification. The final search was conducted on January 20, 2026. Please click here to download this file.
Table 2: Top 10 countries with the highest publication frequency and strongest centrality in acupuncture research for cancer pain. Countries are ranked according to publication frequency. Publication frequency and betweenness centrality were calculated using CiteSpace based on records retrieved from WoSCC, PubMed, and Scopus between 2010 and 2025. Higher centrality values indicate a greater role in international research collaboration. Please click here to download this file.
Table 3: Top 10 institutions with the highest publication frequency and strongest centrality in acupuncture research for cancer pain. Institutions are ranked according to publication frequency. Publication frequency and betweenness centrality were generated using CiteSpace from publications indexed in WoSCC, PubMed, and Scopus during 2010–2025. Higher centrality values indicate stronger collaborative influence within the institutional network. Please click here to download this file.
Table 4: Top 10 most frequently published and most central authors in acupuncture research for cancer pain. Authors are ranked according to publication frequency. Publication frequency and betweenness centrality were calculated using CiteSpace based on records retrieved from WoSCC, PubMed, and Scopus between 2010 and 2025. Higher centrality values indicate greater connectivity within the author collaboration network. Please click here to download this file.
Table 5: Top 10 most cited journals with the highest publication frequency and strongest centrality in acupuncture research for cancer pain. Journals are ranked according to total citation frequency. Citation counts, publication frequency, and centrality values were obtained through bibliometric analysis using CiteSpace and VOSviewer from publications indexed in WoSCC, PubMed, and Scopus between 2010 and 2025. IF denotes the 2023 Journal Impact Factor. Please click here to download this file.
Table 6: Methodological differentiation and architectural parameter contrast between the present study and Li et al. (2023). Comparison of the literature sources, study period, dataset size, analytical software, bibliometric parameters, and visualization methods used in the present study and the previous bibliometric analysis. The comparison highlights methodological differences in database coverage, analytical workflow, and reporting. Please click here to download this file.
Supplementary File 1: Curated dataset and source data. This file contains the curated dataset used for the final analysis, together with the source data underlying the study and the relevant input, output, and raw data files required to support the reported analyses and results. Please click here to download this file.
Discussion
This study employed a robust scientometric workflow driven by CiteSpace and VOSviewer to map the global research landscape of acupuncture for cancer pain management. By executing a multi-dimensional topological analysis, we systematically evaluated the structural characteristics, collaborative networks, and evolutionary trajectories across countries, institutions, authors, core journals, co-cited references, and keywords.
General information and geopolitical landscape
Acupuncture has attracted escalating clinical and scientific interest as a crucial integrative modality for cancer pain management, transitioning from an alternative empiric practice into a highly active domain of evidence-based oncology. The curated dataset for this bibliometric analysis encompassed 2,139 publications spanning from 2010 to 2025, capturing an overall upward trajectory in annual scholarly output that culminated in a historical peak in 2025. This sustained growth in publication volume underscores an intensifying academic consensus regarding the clinical utility and scientific evaluation of acupuncture-based supportive care. Geopolitically, the People's Republic of China emerged as the primary hub of scholarly output. This dominant position is fundamentally underpinned by the deep historical roots of Traditional Chinese Medicine (TCM) in the region, extensive clinical integration across tertiary healthcare levels, and substantial governmental funding to modernize acupuncture research infrastructure. Concurrently, Memorial Sloan Kettering Cancer Center (MSK) was identified as the most prolific institution globally in the present bibliometric analysis. This institutional leadership is largely attributable to MSK's pioneering establishment of a dedicated, multidisciplinary integrative medicine program, which has sustained long-term, rigorous clinical trials focusing on cancer symptom alleviation and supportive oncology. Regarding dissemination channels, Journal of Clinical Oncology stood out as the most heavily cited venue with 1,489 citations. This exceptionally high citation density highlights the journal’s paramount role in anchoring the field's intellectual foundation and hosting high-impact evidence that guides clinical oncology guidelines. Furthermore, the mapped author networks reveal the successful crystallization of several highly interconnected core research clusters. These groups drive the frontier of the field by consistently executing large-scale, randomized controlled trials (RCTs) evaluating acupuncture for cancer-related symptoms. Viewed holistically, the temporal evolution of co-citation networks and keyword co-occurrences demonstrates a progressive paradigm shift where research has matured from rudimentary clinical efficacy observations toward a multi-faceted domain encompassing structured symptom management, specialized electroacupuncture protocols, standardized complementary care, and deep neurobiological mechanism dissection.
Research hotspots and shifting frontiers
The persistence of "pain" and "cancer pain" as central high-frequency nodes in the keyword network reinforces the reality that cancer-related pain remains a formidable clinical challenge that severely compromises patient quality of life. Because malignant pain possesses a highly complex, multi-factorial etiology—arising from direct tumor compression, osteolytic metastases, surgical trauma, and treatment-induced toxicities—the oncology community is perpetually seeking diversified and individualized pain management strategies. Furthermore, the narrow therapeutic index and well-documented adverse profiles of conventional pharmacological analgesics serve as a powerful catalyst for the current sustained interest in non-pharmacological, opioid-sparing interventions like acupuncture. Over the past two decades, an expanding body of clinical trials and high-quality meta-analyses has rigorously validated the clinical value of acupuncture. Notably, landmark studies7 have consistently demonstrated statistically significant reductions in malignant pain scores and a concurrent decrease in daily opioid consumption among patients receiving verum acupuncture. The scientific trajectory mapped in our analysis reveals that acupuncture interventions are no longer applied uniformly, but are increasingly optimized for specific clinical contexts. These specialized applications encompass mitigating acute postoperative pain following major thoracic or abdominal cancer resections, managing chronic endocrine-therapy-related toxicities such as aromatase inhibitor-induced arthralgia (AIA) in breast cancer survivors, and alleviating chronic refractory pain in advanced palliative settings16,17,18,19,20.
Emerging mechanistic trajectories
In tandem with clinical validation, the elucidation of the underlying biological substrates has surged as a critical frontier in contemporary acupuncture research. The keyword burst and reference co-citation dynamics identified in this study reflect a powerful transition from empirical clinical reporting to rigorous mechanistic decoding. Accumulating evidence indicates that acupuncture-induced analgesia is mediated via highly coordinated, multi-level, and multi-target neurobiological pathways. At the local acupoint and peripheral tissue levels, needle stimulation regulates the expression of transient receptor potential (TRP) channels (e.g., TRPV1) and purinergic receptors (e.g., P2X3) within the dorsal root ganglia (DRG), thereby suppressing peripheral sensitization. Concurrently, acupuncture exerts robust anti-inflammatory effects by inhibiting the overactivation of pro-inflammatory cytokines and signaling cascades, thereby dampening the local neuroinflammatory soup that drives malignant hyperalgesia. Within the central nervous system, acupuncture engages the descending pain-modulating system by prompting the endogenous release of opioid peptides and serotonin, while simultaneously suppressing spinal glial cell activation to mitigate long-term potentiation of central pain pathways3,21,22,23,24. While these mechanistic insights have significantly advanced the scientific credibility of acupuncture, transitioning it from an empirical phenomenon to a biologically plausible therapy, a critical translational gap remains. Because the vast majority of mechanistic data are currently derived from preclinical rodent models of bone cancer or neuropathic pain, further human-based functional neuroimaging and biomarker-driven clinical studies are urgently needed to fully substantiate these pathways in oncological cohorts.
Methodological differentiation from prior scientometric work
To clearly delineate the incremental contribution of this study, it is essential to contrast our methodology with prior bibliometric literature. A previous bibliometric study8 provided valuable foundational insights into the global research trends in acupuncture for cancer pain. However, the present study significantly expands upon that earlier work in terms of database breadth, temporal scope, and analytical rigor. A comprehensive, side-by-side methodological comparison is delineated in Table 6. Unlike the previous bibliometric study8, which relied exclusively on literature retrieved from the Web of Science Core Collection (WoSCC) up to October 2022, our study employed a three-database search strategy incorporating WoSCC, PubMed, and Scopus, extending the observation window to December 2025. This broader coverage captured a larger publication corpus (2,139 vs. 790 records) compared with the previous study8, potentially reducing limitations associated with single-database retrieval. Furthermore, to ensure scientific transparency and algorithmic reproducibility, we have explicitly reported all advanced visualization parameters, including CiteSpace time-slicing configurations, network pruning algorithms, and VOSviewer thresholding metrics. This rigorous framework enables us to perform a more precise and updated synthesis of shifting research boundaries, highlighting the rapid, post-2023 escalation of topics such as electroacupuncture optimization, multimodal symptom clustering, and spinal neuroimmune mechanisms.
Strengths and methodological limitations
This study represents a comprehensive and objective scientometric synthesis of the acupuncture-cancer pain paradigm over a 16-year horizon, offering a highly visual, data-driven roadmap for clinicians and trialists. By leveraging the complementary computational strengths of CiteSpace and VOSviewer, we minimized investigator subjectivity during literature screening and trend extraction. Nevertheless, several inherent methodological limitations must be considered when interpreting these findings. First, while a three-database approach was deployed, variations in journal indexing, metadata abstracting, and initial database overlap may introduce subtle distortions during multi-source data fusion and software deduplication. Second, the search protocol was strictly restricted to English-language publications, meaning high-quality clinical protocols or mechanistic studies published in vernacular languages were excluded, potentially underrepresenting certain regional research dynamics. Third, scientometric indicators—such as citation counts, h-index, and betweenness centrality—primarily reflect academic visibility, publication velocity, and network topology rather than the actual clinical efficacy or safety profiles of the interventions. Thus, identified research "hotspots" must be interpreted as areas of high academic activity rather than direct evidence of superior therapeutic outcomes. Additionally, author and institutional self-citations were not mathematically isolated or filtered out, which may marginally skew the citation-based rankings and institutional collaboration strengths. Finally, citation-based metrics naturally favor older publications because citations take time to accumulate. Consequently, highly innovative, breakthrough clinical trials published recently may exhibit deceptively low centrality or citation counts, a recency effect that warrants caution when assessing newly emerging literature.
In conclusion, acupuncture for cancer pain management has established itself as a dynamically evolving and globally recognized research domain. Clinical and academic frontiers have converged on specific high-burden oncological syndromes, notably gastric cancer pain, breast cancer-related AIA, and lung cancer postoperative pain. Accumulating clinical evidence has successfully substantiated the clinical efficacy and favorable safety profile of acupuncture in these settings. However, the field has not yet achieved absolute standardization regarding optimal acupoint selections, treatment frequencies, and uniform clinical trial outcome measures. Moving forward, because malignant pain exerts a profoundly debilitating impact on both the physiological integrity and psychological well-being of patients, the trajectory of future research must transcend isolated clinical observations. The next generation of studies should focus on formulating standardized, syndrome-specific clinical pathways that seamlessly integrate acupuncture within conventional oncology, executing biomarker-driven, rigorous multicenter trials, and prioritizing holistic patient-reported outcomes that encompass both physical analgesia and psychological health, thereby ultimately maximizing the global quality of life for cancer patients.
Disclosures
The authors report no conflicts of interest.
Acknowledgements
This study is funded by the Scientific Research Projects of Higher Education Institutions in Anhui Province (No. 2022AH050415).
Materials
| Name | Company | Catalog Number | Comments |
|---|---|---|---|
| CiteSpace | Chaomei Chen, Drexel University | Version 6.4.R1 | Bibliometric visualization software for knowledge mapping, co-citation analysis, keyword co-occurrence analysis, citation burst detection, clustering analysis, and timeline visualization. |
| Microsoft Excel | Microsoft Corporation | 2019 | Spreadsheet/data management software |
| PubMed | U.S. National Library of Medicine | N/A | Biomedical literature database |
| Scopus | Elsevier | N/A | Abstract and citation database |
| VOSviewer | Centre for Science and Technology Studies (CWTS), Leiden University, The Netherlands | Version 1.6.20 | Bibliometric network visualization software for co-authorship analysis, keyword co-occurrence analysis, co-citation analysis, and bibliographic coupling analysis. |
| Web of Science Core Collection (WoSCC) | Clarivate | N/A | Bibliographic and citation database |
References
- Bennett MI, et al. The IASP classification of chronic pain for ICD-11: chronic cancer-related pain. Pain. 2019;160(1):38-44.
- Snijders RAH, Brom L, Theunissen M, van den Beuken-van Everdingen MHJ. Update on Prevalence of Pain in Patients with Cancer 2022: A Systematic Literature Review and Meta-Analysis. Cancers. 2023;15(3):591.
- Xu M, et al. Electroacupuncture Attenuates Cancer-Induced Bone Pain via NF-κB/CXCL12 Signaling in Midbrain Periaqueductal Gray. ACS Chemical Neuroscience. 2021;12(18):3323-34.
- Paice JA, et al. Use of Opioids for Adults With Pain From Cancer or Cancer Treatment: ASCO Guideline. Journal of Clinical Oncology. 2023;41(4):914-30.
- Deng G. Acupuncture As a Potential Opioid-Sparing Pain Management Intervention for Patients Undergoing Cancer Treatment. Medical Acupuncture. 2020;32(6):394-5.
- Hu C, et al. Acupuncture for Pain Management in Cancer: A Systematic Review and Meta-Analysis. Evidence-Based Complementary and Alternative Medicine. 2016;2016(1):1720239.
- He Y, et al. Clinical Evidence for Association of Acupuncture and Acupressure With Improved Cancer Pain: A Systematic Review and Meta-Analysis. JAMA Oncology. 2020;6(2):271-8.
- Li C, et al. Global research trends of acupuncture therapy on cancer pain: A bibliometric and visualized study. Frontiers in Oncology. 2023;13:1077961.
- Synnestvedt MB, Chen C, Holmes JH. CiteSpace II: visualization and knowledge discovery in bibliographic databases. AMIA Annual Symposium Proceedings. 2005;2005:724-8.
- Liu S, Sun YP, Gao XL, Sui Y. Knowledge domain and emerging trends in Alzheimer's disease: a scientometric review based on CiteSpace analysis. Neural Regeneration Research. 2019;14(9):1643-50.
- Chen C, Song M. Visualizing a field of research: A methodology of systematic scientometric reviews. PLoS One. 2019;14(10):e0223994.
- Epstein AS, et al. Acupuncture vs Massage for Pain in Patients Living With Advanced Cancer: The IMPACT Randomized Clinical Trial. JAMA Network Open. 2023;6(11):e2342482.
- Mao JJ, et al. Effectiveness of Electroacupuncture or Auricular Acupuncture vs Usual Care for Chronic Musculoskeletal Pain Among Cancer Survivors: The PEACE Randomized Clinical Trial. JAMA Oncology. 2021;7(5):720-7.
- Yang M, et al. Effect of acupuncture versus usual care on sleep quality in cancer survivors with chronic pain: Secondary analysis of a randomized clinical trial. Cancer. 2023;129(13):2084-94.
- Sun L, et al. Acupuncture Improves Functional Limitations for Cancer Patients with Chronic Pain: A Secondary Analysis of PEACE Randomized Clinical Trial. Current Oncology. 2025;32(11):640.
- Zhang FF, et al. Evaluating health-related quality of life in gastric cancer patients in Suzhou, China. Annals of Palliative Medicine. 2021;10(7):8024-33.
- Zhou J, et al. The effect of acupuncture on chemotherapy-associated gastrointestinal symptoms in gastric cancer. Current Oncology. 2017;24(1):e1-e5.
- Hershman DL, et al. Effect of Acupuncture vs Sham Acupuncture or Waitlist Control on Joint Pain Related to Aromatase Inhibitors Among Women With Early-Stage Breast Cancer: A Randomized Clinical Trial. JAMA. 2018;320(2):167-76.
- Liu X, et al. Acupuncture for Arthralgia Induced by Aromatase Inhibitors in Patients with Breast Cancer: A Systematic Review and Meta-analysis. Integrative Cancer Therapies. 2021;20:1534735420980811.
- Zhou X, et al. Effects of Transcutaneous Electrical Acupoint Stimulation (TEAS) on Postoperative Recovery in Patients with Gastric Cancer: A Randomized Controlled Trial. Cancer Management and Research. 2021;13:1449-58.
- Zhang Z, et al. The effects of electroacupuncture at the ST36 (Zusanli) acupoint on cancer pain and transient receptor potential vanilloid subfamily 1 expression in Walker 256 tumor-bearing rats. Anesthesia & Analgesia. 2012;114(4):879-85.
- Tian SX, et al. Analgesic effect of electroacupuncture on bone cancer pain in rat model: the role of peripheral P2X3 receptor. Purinergic Signalling. 2023;19(1):13-27.
- Zhang R, Lao L, Ren K, Berman BM. Mechanisms of acupuncture-electroacupuncture on persistent pain. Anesthesiology. 2014;120(2):482-503.
- Zhang C, et al. Wrist-ankle acupuncture attenuates cancer-induced bone pain by regulating descending pain-modulating system in a rat model. Chinese Medicine. 2020;15:13.