This study evaluated the association between Taohong Siwu Decoction-based targeted drug penetration therapy and postoperative lower limb deep vein thrombosis after hip fracture surgery. The findings suggest potential benefits through modulation of coagulation, inflammation, and venous hemodynamics.
Research Article
Taohong Siwu Decoction-Based Targeted Drug Penetration Therapy for Deep Vein Thrombosis After Hip Fracture Surgery: A Retrospective Study
In This Article
Summary
Abstract
Postoperative lower limb deep vein thrombosis (DVT) remains a common complication after hip fracture surgery, and complementary strategies targeting coagulation, inflammation, and venous circulation may provide additional preventive benefits. This retrospective cohort study included 86 patients who underwent hip fracture surgery between June 2023 and June 2024. Patients were assigned to a control group (n = 43), receiving standard low-molecular-weight heparin (LMWH) prophylaxis, or an observation group (n = 43), receiving additional Taohong Siwu Decoction-based targeted drug penetration therapy. The primary outcome was postoperative lower limb DVT within 10 days after surgery. Secondary outcomes included coagulation parameters, inflammatory markers, femoral venous blood flow velocities, postoperative pain, limb swelling, and treatment-related adverse events. DVT occurred in 1/43 patients (2.33%) in the observation group and 10/43 patients (23.26%) in the control group (Fisher’s exact P = 0.007). In a parsimonious Firth penalized logistic regression model adjusting for age and baseline D-dimer, adjunctive therapy remained associated with a lower likelihood of postoperative DVT (adjusted odds ratio [OR] = 0.12, 95% confidence interval [CI]: 0.02–0.68, P = 0.017). After 10 days of treatment, the observation group had lower Faces Pain Scale-Revised scores and limb swelling, longer activated partial thromboplastin time and prothrombin time, lower D-dimer levels, higher common and superficial femoral vein blood flow velocities, and lower serum tumor necrosis factor-alpha and interleukin-6 levels than the control group (all P < 0.05). No statistically significant between-group difference was observed in overall adverse-event occurrence, and no severe treatment-related adverse events were recorded. Taohong Siwu Decoction-based targeted drug penetration therapy combined with standard anticoagulation was associated with a lower incidence of early postoperative DVT and favorable differences in coagulation, inflammatory, and venous hemodynamic parameters.
Introduction
Deep vein thrombosis (DVT) obstructs venous return and promotes abnormal platelet aggregation, leading to thrombus formation, limb swelling, pain, superficial venous dilation, and other clinical manifestations. This condition predominantly affects the lower extremities1. If a thrombus detaches from its original site, it may cause pulmonary embolism, a potentially fatal complication that severely impairs patients' quality of life2. China is currently experiencing an aging population, resulting in a substantial annual incidence of hip fractures among elderly individuals. Prolonged preoperative immobilization, intraoperative positioning, anesthetic effects, and postoperative pain collectively predispose these patients to a hypercoagulable state, placing them at high risk for DVT. Studies have reported that without effective perioperative interventions, the incidence of lower limb DVT in hip fracture patients ranges from 45% to 70%, with 0.5% to 2.0% of cases progressing to fatal pulmonary embolism3. Therefore, early initiation of thromboprophylaxis is critical. Timely and appropriate preventive measures can substantially reduce the occurrence of DVT in this vulnerable population. Established risk factors for DVT include vascular endothelial injury, hypercoagulability, and venous stasis4,5. In Western medicine, low molecular weight heparin (LMWH) is widely used as a standard prophylactic agent targeting these pathways. However, despite LMWH administration, some patients still develop DVT, and concerns remain regarding delayed wound healing and increased risk of postoperative infection. In Traditional Chinese Medicine (TCM), DVT is attributed to obstruction of the meridians and blood stasis. Accordingly, TCM treatment strategies aim to promote blood circulation, dissipate stasis, and maintain normal venous return. The application of TCM for DVT prevention has gained increasing attention, and related research continues to expand. Huang et al. reported that Chinese herbal medicines could effectively prevent lower limb DVT by enhancing circulation and resolving blood stasis6. Similarly, Xuefu Zhuyu Decoction, a well-established formula, has been shown to reduce DVT incidence, potentially through modulation of the SIRT1/NF‑κB pathway, thereby inhibiting platelet and neutrophil activation and mitigating endothelial injury7.
Bioelectric drug conduction, also known as TCM-targeted drug penetration therapy, is an emerging external treatment modality within traditional Chinese medicine. By applying modulated medium-frequency electrical stimulation, this technique may reduce skin resistance, enhance local microcirculation, and facilitate transdermal absorption of active herbal components. Although this approach has been explored in several musculoskeletal disorders, its application in the prevention of postoperative lower limb DVT remains insufficiently investigated. Therefore, further clinical evaluation is needed to determine whether TCM-targeted drug penetration therapy can provide additional benefits in reducing thrombotic events and improving perioperative recovery in patients undergoing hip fracture surgery8,9. Thus, this retrospective cohort study aimed to evaluate the association between Taohong Siwu Decoction-based targeted drug penetration therapy and postoperative DVT risk in patients undergoing hip fracture surgery. In addition to clinical thrombotic outcomes, we further explored potential biological mechanisms by assessing coagulation profiles, inflammatory mediators, and venous hemodynamic parameters. These multidimensional analyses may provide preliminary clinical evidence regarding the potential role of TCM-targeted drug penetration therapy as an adjunctive strategy for perioperative thromboprophylaxis.
Protocol
General information
This retrospective study was approved by the institutional ethics committee of Shenzhen Integrated Traditional Chinese and Western Medicine Hospital (KY-2025-030-02), and the requirement for informed consent was waived due to the retrospective design. As this was a retrospective observational study, it was not registered in a prospective clinical trial registry.
This study included 86 patients with hip fractures who underwent surgery at our hospital between June 2023 and June 2024. According to the perioperative treatment strategy, patients were categorized into the control group (n = 43), who received standard low-molecular-weight heparin therapy alone, and the observation group (n = 43), who received additional TCM-targeted drug penetration therapy in combination with low-molecular-weight heparin. Demographic characteristics, clinical outcomes, coagulation profiles, inflammatory markers, venous hemodynamic parameters, postoperative pain, limb swelling, treatment-related adverse events, and treatment compliance were collected and analyzed retrospectively. Surgical procedures included hip arthroplasty and internal fixation, according to fracture type and routine clinical indications. The primary endpoint was the incidence of lower limb DVT within 10 days after surgery, which was assessed using color Doppler ultrasound. Secondary endpoints included changes in coagulation indicators, inflammatory factors, venous blood flow velocity, postoperative pain scores, limb swelling, and safety outcomes.
As this was a retrospective cohort study, treatment allocation was based on clinical decisions rather than random assignment. Outcome assessors and laboratory personnel were blinded to group information during assessment to minimize measurement bias. Missing data was reviewed from medical records. Patients with incomplete primary outcome assessment were excluded from the final analysis. No missing data requiring imputation was identified.
Case selection criteria
Inclusion criteria: ① hip fracture diagnosed by imaging examination; ② patients undergoing surgical treatment for hip fracture, including hip arthroplasty or internal fixation; ③ age > 50 years old; ④ normal lower limb ultrasound examination before surgery, indicating no DVT.
Exclusion criteria: ① patients with significant liver, renal, and cardiac problems; ② patients with abnormal coagulation function; ③ patients with severe infection; ④ patients who used anticoagulant-related drugs one month before inclusion in the study; ⑤ patients who were allergic to low molecular weight heparin or the traditional Chinese medicine ingredients used in this study; ⑥ patients who were discharged or transferred to another hospital before completing treatment.
Because of the retrospective exploratory design, the sample size was determined by the number of consecutive eligible patients who underwent hip fracture surgery at our institution during the predefined study period (June 2023 to June 2024) and met all inclusion and exclusion criteria. All available eligible patients were included to minimize selection bias and maximize the use of available clinical data.
DVT prevention and treatment
The control group received low molecular weight heparin as anticoagulation therapy. At 12 h postoperatively, after confirming the absence of active bleeding, heparin (1 mL: 5000 units) was administered subcutaneously once daily for 10 consecutive days. Patients in the observation group received the same heparin regimen combined with TCM‑targeted drug penetration therapy. This therapy employed a directional drug penetration device and a decoction of Taohong Siwu, consisting of the following herbal components: safflower 10 g, peach kernel 10 g, Chuanxiong rhizome 10 g, white peony 10 g, ripened dihuang (Rehmanniae Radix Praeparata) 15 g, and Angelica sinensis 15 g. The Taohong Siwu Decoction was prepared daily according to a standardized hospital pharmacy procedure. The prescribed herbs were mixed and soaked in approximately 500 mL of purified water for 30 min before decoction. The mixture was then boiled and gently decocted for 30 min, after which the liquid extract was filtered through sterile gauze. A second extraction was performed by adding approximately 300 mL of water to the herbal residue and decocting for an additional 20 min. The two filtrates were combined and further concentrated by gentle heating to a final volume of 50 mL. The freshly prepared concentrated decoction was used on the same day for TCM-targeted drug penetration therapy. The preparation was applied at 50 °C to the corresponding acupoints and tender points, with the electrode pads placed firmly on the skin surface. The device was set to a medium frequency, with the output current maintained below 50 mA and the frequency at 2000 Hz. Each treatment session lasted 25 min and was administered once daily for 10 consecutive days.
Outcome measures
Incidence of postoperative lower limb DVT
The incidence of DVT was assessed 10 days after surgery. All patients underwent bilateral lower-limb color Doppler ultrasound examinations on postoperative day 10 using a color Doppler ultrasound system. DVT diagnosis was based on venous incompressibility, presence of intraluminal echogenic material, and absence or reduction of venous blood flow. Two experienced sonographers, blinded to group allocation, performed all examinations, and any disagreements were resolved by consensus. Deep vein thrombosis was identified by the presence of mass‑like, cord‑like, or silty solid echoes within the deep veins.
Pain intensity and limb swelling
Pain intensity was evaluated using the Faces Pain Scale-Revised (FPS-R), which comprises six facial expressions corresponding to scores of 0, 2, 4, 6, 8, and 10, with lower scores indicating less pain10. The FPS-R has also demonstrated acceptable reliability and validity for pain assessment in older adults11. This scale was initially developed for pediatric pain assessment and has subsequently been validated for use in elderly populations. Limb swelling was quantified by measuring the calf circumference of both the affected and healthy limbs using a soft tape measure. Measurements were taken three times, and the mean values were calculated. A smaller difference between the affected and healthy limb circumferences indicated less swelling.
Inflammatory cytokine measurement
Fasting venous blood samples (5 mL) were collected before treatment and on postoperative day 10. Serum was separated by centrifugation at 1,500 × g for 10 min and stored at -80 °C until analysis. Serum concentrations of interleukin‑6 (IL‑6) and tumor necrosis factor‑α (TNF‑α) were determined using commercially available enzyme‑linked immunosorbent assay (ELISA) kits following the manufacturer's instructions. All samples were analyzed in duplicate, and laboratory personnel were blinded to treatment allocation. The intra‑assay coefficient of variation was less than 10%, indicating acceptable analytical reliability.
Coagulation parameters
Fasting venous blood (3 mL) was drawn in the morning before treatment and on postoperative day 10. Coagulation parameters, including D‑dimer, prothrombin time (PT), and activated partial thromboplastin time (APTT), were measured using an automatic coagulation analyzer. Internal quality control procedures were performed daily in accordance with laboratory standards. Calibration was performed before each batch of sample analysis, and all measurements were conducted in the same laboratory to minimize analytical variation.
Venous hemodynamic assessment
Lower limb venous blood flow velocities were measured using color Doppler ultrasonography before treatment and on postoperative day 10. The blood flow velocities of the common femoral vein and superficial femoral vein were recorded for each patient.
Toxicity assessment
Safety assessment was performed by recording treatment-related adverse events, including skin irritation, discomfort during treatment, allergic reactions, and other postoperative complications. The severity and occurrence of adverse events were documented during the intervention period. Minor bleeding events were defined as clinically apparent bleeding without requiring transfusion or surgical intervention.
Statistical analysis
Statistical analyses were performed using SPSS version 25.0. Continuous variables were assessed for normality using the Shapiro-Wilk test. Normally distributed variables were expressed as mean ± standard deviation (SD) and compared using the independent-sample t-test, whereas non-normally distributed variables were presented as median (interquartile range, IQR) and analyzed using the Mann–Whitney U test. Categorical variables were expressed as number and percentage [n (%)], and comparisons were performed using the chi-square test or Fisher’s exact test as appropriate.
For within-group comparisons before and after treatment, paired t-tests were used for normally distributed variables, whereas the Wilcoxon signed-rank test was applied for non-normally distributed variables. Changes from baseline to postoperative day 10 were compared between groups using independent-samples tests based on the distribution of the data.
For the primary outcome of postoperative lower limb DVT, logistic regression analyses were performed to evaluate the association between treatment strategy and DVT occurrence. Because only 11 postoperative DVT events occurred in the overall cohort, the adjusted analysis was deliberately restricted to minimize model overfitting. Postoperative variables, including postoperative D-dimer levels and femoral venous blood flow measurements, were not included in the adjusted model because these measurements were obtained after treatment initiation and could represent intermediate variables on the pathway between treatment and DVT.
Considering the limited number of outcome events, Firth’s penalized logistic regression was used to reduce small-sample bias. The prespecified parsimonious model included treatment strategy as the primary exposure together with age and baseline D-dimer level as clinically relevant pre-treatment covariates. No data-driven stepwise variable selection was performed. Adjusted odds ratios (ORs) with 95% confidence intervals (CIs) were reported. Postoperative coagulation, inflammatory, and venous hemodynamic parameters were analyzed separately as secondary outcomes and were not interpreted as baseline confounders. All statistical tests were two-sided, and P < 0.05 was considered statistically significant. The de-identified patient-level dataset used for statistical analyses is provided as supplementary material.
A detailed list of all materials, equipment, instruments, and software used in this study is provided in the Table of Materials.
Results
General information
A total of 86 patients with hip fractures who underwent surgery at our hospital between June 2023 and June 2024 were included in this retrospective cohort study. According to the perioperative treatment strategy, 43 patients were assigned to the control group and 43 to the observation group. The baseline characteristics of the two groups are presented in Table 1. No statistically significant between-group differences were observed in the assessed baseline demographic and fracture-related characteristics (all P > 0.05; Table 1). The overall study workflow, treatment grouping, outcome assessment strategy, and key findings are summarized in Figure 1.
Incidence of postoperative lower limb DVT
The incidence of postoperative lower limb DVT within 10 days after surgery was assessed using color Doppler ultrasound. The observation group showed a significantly lower incidence of DVT compared with the control group (2.33% vs. 23.26%, Fisher’s exact P = 0.007).
Comparison of postoperative pain and limb swelling between the two groups
Before treatment, no significant between-group differences were observed in FPS-R pain scores (4.08 ± 0.61 vs. 4.10 ± 0.60, P = 0.896) or limb swelling (1.10 ± 0.24 vs. 1.06 ± 0.22 cm, P = 0.397). After 10 days of treatment, the observation group had significantly lower FPS-R pain scores than the control group (1.71 ± 0.45 vs. 2.31 ± 0.50), with a mean difference of -0.60 (95% CI: -0.81 to -0.40, P < 0.001). Limb swelling was also significantly lower in the observation group (0.69 ± 0.18 vs. 0.98 ± 0.20 cm), with a mean difference of -0.29 cm (95% CI: -0.37 to -0.21, P < 0.001). The detailed results are presented in Table 2.
Comparison of coagulation parameters between the two groups
Before treatment, no significant between-group differences were observed in APTT, PT, or D-dimer levels (all P > 0.05). After 10 days of treatment, the observation group had a significantly longer APTT than the control group (37.93 ± 3.22 vs. 35.03 ± 4.21 s), with a mean difference of 2.90 s (95% CI: 1.29–4.51, P < 0.001). PT was also significantly longer in the observation group (15.36 ± 1.08 vs. 13.26 ± 1.28 s), with a mean difference of 2.11 s (95% CI: 1.60–2.61, P < 0.001). Postoperative D-dimer levels were significantly lower in the observation group than in the control group (4.11 ± 1.14 vs. 4.67 ± 1.28 mg/L), with a mean difference of -0.56 mg/L (95% CI: -1.08–-0.04, P = 0.036). These findings indicate that adjunctive TCM-targeted drug penetration therapy was associated with differences in postoperative coagulation parameters. The detailed coagulation results are presented in Table 3.
Comparison of femoral vein blood flow velocity between the two groups
Before treatment, no significant between-group differences were observed in common femoral vein or superficial femoral vein blood flow velocities (both P > 0.05). After 10 days of treatment, common femoral vein blood flow velocity was significantly higher in the observation group than in the control group (24.16 ± 4.45 vs. 20.48 ± 4.35 cm/s), with a mean difference of 3.68 cm/s (95% CI: 1.80–5.57, P < 0.001). Superficial femoral vein blood flow velocity was also significantly higher in the observation group (21.81 ± 4.12 vs. 16.06 ± 3.47 cm/s), with a mean difference of 5.75 cm/s (95% CI: 4.12–7.39, P < 0.001). The detailed results are presented in Table 4.
Comparison of serum inflammatory markers between the two groups
Before treatment, no significant between-group differences were observed in serum TNF-α or IL-6 levels (both P > 0.05). After 10 days of treatment, TNF-α levels were significantly lower in the observation group than in the control group (26.31 ± 7.37 vs. 36.33 ± 7.48 pg/mL), with a mean difference of -10.03 pg/mL (95% CI: -13.21–-6.85, P < 0.001). IL-6 levels were also significantly lower in the observation group (18.27 ± 5.24 vs. 26.55 ± 4.28 pg/mL), with a mean difference of -8.28 pg/mL (95% CI: -10.33–-6.22, P < 0.001). The detailed inflammatory marker data are presented in Table 5.
Treatment-related adverse events
No severe treatment‑related adverse events occurred in either group. Mild reactions, including local skin irritation and transient discomfort during TCM‑targeted drug penetration therapy, appeared in a few patients and resolved without intervention. Minor bleeding events linked to anticoagulation were also recorded, with comparable frequencies between groups. The overall recorded treatment-related adverse-event rates were 67.44% in the observation group and 62.79% in the control group (P = 0.651). Local skin irritation occurred in 14 (32.56%) and 10 (23.26%) patients, transient discomfort in 8 (18.60%) and 7 (16.28%) patients, and minor bleeding events in 7 (16.28%) and 10 (23.26%) patients in the observation and control groups, respectively. No severe treatment-related adverse events were recorded. Taken together, the TCM‑targeted drug penetration therapy was well tolerated over the perioperative period. Detailed safety outcomes appear in Table 6.
Logistic regression analysis of factors associated with postoperative DVT
Because postoperative DVT occurred in only 11 of the 86 patients, a parsimonious Firth penalized logistic regression model was used to reduce small-sample bias and the risk of overfitting. Postoperative D-dimer levels and femoral venous blood flow velocities were excluded from the adjusted model because they were measured after initiation of the intervention and could represent intermediate variables rather than baseline confounders.
The adjusted model was restricted to treatment strategy, age, and baseline D-dimer level. In the Firth penalized logistic regression analysis, adjunctive TCM-targeted drug penetration therapy was associated with a lower likelihood of postoperative DVT (adjusted OR = 0.12, 95% CI: 0.02–0.68, P = 0.017). Neither age (adjusted OR = 0.99 per 1-year increase, 95% CI: 0.88–1.12, P = 0.891) nor baseline D-dimer level (adjusted OR = 0.95 per 1 mg/L increase, 95% CI: 0.71–1.26, P = 0.706) was significantly associated with postoperative DVT. Given the small number of DVT events, these estimates should be interpreted cautiously and considered exploratory. The results are presented in Table 7.
Summary of principal findings
In this retrospective cohort study, adding Taohong Siwu Decoction‑based targeted drug penetration therapy to standard LMWH prophylaxis was associated with a lower incidence of postoperative lower limb DVT after hip fracture surgery. Patients receiving the combined regimen also showed better coagulation profiles, lower inflammatory markers, faster femoral venous flow, and improved symptom control, with less pain and swelling. The parsimonious Firth penalized logistic regression analysis showed that the association between adjunctive therapy and lower thrombotic risk persisted after limited adjustment for prespecified baseline factors, although the small number of DVT events requires cautious interpretation. The absence of severe adverse events further supports the tolerability of this approach during the perioperative period.
DATA AVAILABILITY:
The de-identified patient-level dataset generated and analyzed during the current study, including baseline characteristics, clinical outcomes, coagulation parameters, inflammatory markers, venous hemodynamic measurements, and treatment-related adverse events, is provided as Supplementary File 1.
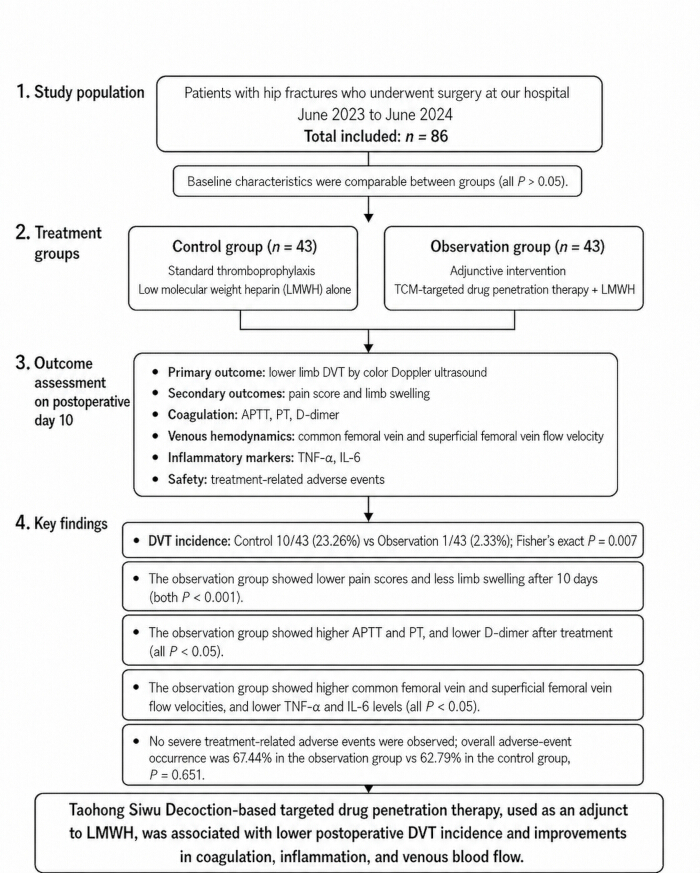
Figure 1. Study workflow and key findings of the retrospective cohort study. This workflow summarizes patient selection, treatment grouping, outcome assessment, and major findings. A total of 86 patients with hip fractures who underwent surgery between June 2023 and June 2024 were retrospectively analyzed. Patients were divided into the control group receiving low molecular weight heparin (LMWH) alone and the observation group receiving additional Taohong Siwu Decoction-based targeted drug penetration therapy. Outcomes assessed on postoperative day 10 included lower limb deep vein thrombosis (DVT) incidence, pain score, limb swelling, coagulation parameters, venous hemodynamic indicators, inflammatory markers, and treatment-related adverse events. Please click here to view a larger version of this figure.
| Characteristic | Control group (n = 43) | Observation group (n = 43) | t/χ2 | P value |
| Age (years), mean ± SD | 68.09 ± 5.11 | 67.47 ± 6.37 | 0.493 | 0.623 |
| Sex, n (%) | 2.284 | 0.131 | ||
| Male | 19 (44.19) | 26 (60.47) | ||
| Female | 24 (55.81) | 17 (39.53) | ||
| Smoking, n (%) | 0.047 | 0.828 | ||
| Yes | 19 (44.19) | 18 (41.86) | ||
| No | 24 (55.81) | 25 (58.14) | ||
| Drinking, n (%) | 1.675 | 0.196 | ||
| Yes | 18 (41.86) | 24 (55.81) | ||
| No | 25 (58.14) | 19 (44.19) | ||
| Hypertension, n (%) | 0.427 | 0.514 | ||
| Yes | 26 (60.47) | 23 (53.49) | ||
| No | 17 (39.53) | 20 (46.51) | ||
| Diabetes mellitus, n (%) | 0.191 | 0.662 | ||
| Yes | 17 (39.53) | 19 (44.19) | ||
| No | 26 (60.47) | 24 (55.81) | ||
| BMI (kg/m²), mean ± SD | 23.22 ± 1.49 | 23.43 ± 1.19 | -0.736 | 0.464 |
| Fracture type, n (%) | 5.242 | 0.073 | ||
| Femoral neck fracture | 15 (34.88) | 12 (27.91) | ||
| Intertrochanteric fracture | 13 (30.23) | 23 (53.49) | ||
| Subtrochanteric fracture | 15 (34.88) | 8 (18.60) |
Table 1: Baseline characteristics of patients in the control and observation groups. This table summarizes baseline demographic and clinical characteristics, including age, sex, smoking and drinking status, hypertension, diabetes mellitus, body mass index (BMI), and fracture type. Continuous variables are presented as mean ± standard deviation (SD), and categorical variables as n (%). No statistically significant between-group differences were observed in the assessed baseline characteristics.
| Outcome | Observation group (n = 43) | Control group (n = 43) | t | P value |
| FPS-R pain score | ||||
| Before treatment | 4.08 ± 0.61 | 4.10 ± 0.60 | -0.131 | 0.896 |
| After 10 days | 1.71 ± 0.45 | 2.31 ± 0.50 | -5.847 | <0.001 |
| Limb swelling (cm) | ||||
| Before treatment | 1.10 ± 0.24 | 1.06 ± 0.22 | 0.852 | 0.397 |
| After 10 days | 0.69 ± 0.18 | 0.98 ± 0.20 | -7.015 | <0.001 |
Table 2: Comparison of pain scores and limb swelling between the two groups. This table compares Faces Pain Scale-Revised (FPS-R) scores and limb swelling before treatment and after 10 days of treatment. Continuous variables are presented as mean ± standard deviation (SD). The observation group showed significantly lower FPS-R scores and less limb swelling after 10 days of treatment than the control group. Data are presented as mean ± standard deviation. The t-statistics represent comparisons of the observation group with the control group using independent-samples t-tests.
| Parameter | Observation group (n = 43) | Control group (n = 43) | t | P value |
| APTT (s) | ||||
| Before treatment | 30.24 ± 5.88 | 29.71 ± 6.15 | 0.41 | 0.683 |
| After 10 days | 37.93 ± 3.22 | 35.03 ± 4.21 | 3.591 | <0.001 |
| PT (s) | ||||
| Before treatment | 10.02 ± 1.34 | 10.22 ± 0.98 | -0.781 | 0.437 |
| After 10 days | 15.36 ± 1.08 | 13.26 ± 1.28 | 8.222 | <0.001 |
| D-dimer (mg/L) | ||||
| Before treatment | 5.57 ± 2.25 | 5.87 ± 2.30 | -0.61 | 0.544 |
| After 10 days | 4.11 ± 1.14 | 4.67 ± 1.28 | -2.131 | 0.036 |
Table 3: Comparison of coagulation parameters between the two groups. This table summarizes activated partial thromboplastin time (APTT), prothrombin time (PT), and D-dimer levels before treatment and after 10 days of treatment. Data are presented as mean ± standard deviation (SD). After 10 days, the observation group showed longer APTT and PT and lower D-dimer levels than the control group. Data are presented as mean ± standard deviation. The t-statistics represent comparisons of the observation group with the control group using independent-samples t-tests.
| Parameter | Observation group (n = 43) | Control group (n = 43) | t | P value |
| Common femoral vein (cm/s) | ||||
| Before treatment | 19.89 ± 4.90 | 18.60 ± 3.91 | 1.355 | 0.179 |
| After 10 days | 24.16 ± 4.45 | 20.48 ± 4.35 | 3.881 | <0.001 |
| Superficial femoral vein (cm/s) | ||||
| Before treatment | 13.25 ± 2.59 | 12.72 ± 2.53 | 0.969 | 0.335 |
| After 10 days | 21.81 ± 4.12 | 16.06 ± 3.47 | 6.999 | <0.001 |
Table 4: Comparison of femoral vein blood flow velocities between the two groups. This table compares common femoral vein and superficial femoral vein blood flow velocities before treatment and after 10 days of treatment. Data are presented as mean ± standard deviation (SD). Between-group comparisons were performed using independent samples t-tests. After 10 days, both venous blood flow velocities were significantly higher in the observation group than in the control group.
| Parameter | Observation group (n = 43) | Control group (n = 43) | t | P value |
| TNF-α (pg/mL) | ||||
| Before treatment | 46.85 ± 8.11 | 45.46 ± 6.91 | 0.853 | 0.396 |
| After 10 days | 26.31 ± 7.37 | 36.33 ± 7.48 | -6.266 | <0.001 |
| IL-6 (pg/mL) | ||||
| Before treatment | 31.73 ± 5.63 | 32.35 ± 5.53 | -0.516 | 0.607 |
| After 10 days | 18.27 ± 5.24 | 26.55 ± 4.28 | -8.022 | <0.001 |
Table 5: Comparison of serum inflammatory markers between the two groups. This table compares serum tumor necrosis factor-alpha (TNF-α) and interleukin-6 (IL-6) concentrations before treatment and after 10 days of treatment. Data are presented as mean ± standard deviation (SD). Between-group comparisons were performed using independent samples t-tests. After 10 days, both TNF-α and IL-6 levels were significantly lower in the observation group than in the control group.
| Adverse event | Observation group (n = 43) | Control group (n = 43) | χ2 | P value |
| Local skin irritation | 14 (32.56%) | 10 (23.26%) | 0.925 | 0.336 |
| Transient discomfort | 8 (18.60%) | 7 (16.28%) | 0.081 | 0.776 |
| Minor bleeding events | 7 (16.28%) | 10 (23.26%) | 0.66 | 0.417 |
| Any adverse event | 29 (67.44%) | 27 (62.79%) | 0.205 | 0.651 |
Table 6: Treatment-related adverse events in the observation and control groups. This table summarizes treatment-related adverse events, including local skin irritation, transient discomfort, minor bleeding events, and the overall recorded treatment-related adverse-event rate during the treatment period. Data are presented as n (%). Between-group comparisons were performed using Pearson’s chi-square test. No statistically significant between-group differences were observed for individual adverse events or overall recorded treatment-related adverse-event rate.
| Variable | Adjusted OR | 95% CI | P value |
| TCM-targeted drug penetration therapy vs. control | 0.12 | 0.02–0.68 | 0.017 |
| Age, per 1-year increase | 0.99 | 0.88–1.12 | 0.891 |
| Baseline D-dimer, per 1 mg/L increase | 0.95 | 0.71–1.26 | 0.706 |
Table 7: Parsimonious Firth penalized logistic regression analysis of postoperative lower limb deep vein thrombosis. This table presents the adjusted associations of treatment strategy, age, and baseline D-dimer level with postoperative lower limb deep vein thrombosis (DVT). Adjusted odds ratios (ORs) with 95% confidence intervals (CIs) are reported. Traditional Chinese medicine (TCM)-targeted drug penetration therapy was associated with a lower likelihood of postoperative DVT. Firth penalized logistic regression was used because only 11 DVT events occurred among the 86 patients. The model was restricted priority to treatment strategy and two clinically relevant baseline covariates to reduce small-sample bias and overfitting. Postoperative D-dimer levels and venous blood flow measurements were excluded because they were measured after treatment initiation and could represent intermediate variables on the pathway between treatment and DVT.
Supplementary File 1: De-identified patient-level dataset. Please click here to download this File.
Discussion
In this retrospective cohort study, adding Taohong Siwu Decoction-based targeted drug penetration therapy to standard LMWH prophylaxis was associated with a lower incidence of postoperative lower limb DVT after hip fracture surgery (2.33% vs. 23.26%). In the parsimonious Firth-penalized logistic regression model, adjusting only for prespecified baseline covariates, the adjunctive treatment remained associated with lower DVT risk. Given the limited number of DVT events, however, this adjusted association should be interpreted cautiously and requires confirmation in larger prospective cohorts. Patients receiving the combined intervention also showed prolonged APTT and PT, reduced D‑dimer, lower IL‑6 and TNF‑α levels, and faster femoral venous flow, alongside better pain and swelling control. These multidimensional improvements suggest that the adjunctive therapy may modulate multiple components of Virchow's triad rather than coagulation alone. Low molecular weight heparin remains the standard thromboprophylaxis after orthopedic surgery, yet residual thrombotic risk persists, particularly in elderly hip fracture patients12. Other strategies, including direct oral anticoagulants, aspirin, and intermittent pneumatic compression, have been investigated, but each has limitations in efficacy, bleeding risk, or practicality13,14,15. Complementary approaches that concurrently address coagulation, inflammation, and venous stasis may offer additional benefit. In this context, our findings support the potential role of TCM‑targeted drug penetration therapy as an adjunctive rather than replacement strategy.
From a Traditional Chinese Medicine perspective, postoperative DVT is attributed to qi and blood deficiency, with "stasis" as the core pathogenesis16,17. Taohong Siwu Decoction, a classical formula derived from Siwu Decoction by adding peach kernel and safflower, has traditionally been used to promote blood circulation and resolve blood stasis. Modern pharmacological studies suggest that Taohong Siwu Decoction and its bioactive constituents may exert anti-inflammatory effects, inhibit platelet activation and aggregation, improve hemorheology and microcirculation, and modulate vascular function18,19,20. Experimental evidence has also demonstrated inhibitory effects of Taohong Siwu Decoction on platelet adhesion and aggregation20. Its constituent herbs, including Angelica sinensis, Rehmanniae Radix Praeparata, peach kernel, safflower, Chuanxiong rhizome, and white peony, contain multiple bioactive compounds with reported vascular, anti-inflammatory, and hematologic activities18,19. These pharmacological properties may provide a biological basis for the observed differences in coagulation, inflammatory markers, and venous hemodynamics in the present study; however, the underlying mechanisms were not directly investigated and require further experimental confirmation.
The observed improvements in pain and limb swelling further support the clinical relevance of the adjunctive therapy. Fracture‑induced damage to venous and lymphatic systems often impairs return flow, leading to edema and discomfort21. Enhanced local drug delivery via the penetration device may allow active herbal components to reach the perivascular tissues more directly, thereby accelerating the resolution of edema and alleviating discomfort8,9. This symptomatic benefit may, in turn, facilitate earlier mobilization, which itself reduces venous stasis and thrombotic risk.
The regression analysis was conducted to account for the limited number of postoperative DVT events and the temporal relationship between treatment and postoperative laboratory or hemodynamic measurements. Specifically, postoperative D-dimer levels and femoral venous blood flow velocities were not treated as confounders because these variables were measured after treatment initiation and could lie on the causal pathway between the intervention and DVT. Instead, a parsimonious Firth penalized logistic regression model incorporating treatment strategy, age, and baseline D-dimer level was used. The association between adjunctive TCM-targeted drug penetration therapy and lower DVT risk persisted after this limited baseline adjustment, although the wide confidence interval and small number of thrombotic events warrant cautious interpretation. Postoperative changes in D-dimer, inflammatory markers, and venous blood flow should therefore be considered secondary mechanistic observations rather than independent baseline predictors of treatment effectiveness. The observed prolongation of APTT and PT, along with reduced D‑dimer levels, suggests that the combined therapy may help restore the coagulation‑fibrinolysis balance22,23,24. D‑dimer, a fibrin degradation product, reflects ongoing thrombus formation and lysis; its reduction in the observation group implies attenuated thrombin generation and fibrin deposition25. Similarly, the increased femoral venous flow velocities indicate improved venous return, reducing stasis‑related thrombotic risk26,27. These hemodynamic improvements may be partly attributable to enhanced local microcirculation and reduced inflammation‑induced endothelial dysfunction, as supported by the concurrent decline in IL‑6 and TNF‑α levels. Inflammatory cytokines can upregulate tissue factor expression, suppress plasminogen activator release, and promote leukocyte‑endothelial adhesion, all of which favor a prothrombotic state28,29. The reduction of these mediators in the observation group thus represents a potential mechanistic link between TCM therapy and DVT prevention.
Recent multi‑omics studies have identified inflammatory signatures, platelet‑related proteins, and metabolic alterations as potential biomarkers for venous thromboembolism30,31. While the present study did not employ such approaches, our findings linking TCM therapy to reduced IL‑6/TNF‑α and improved coagulation provide a clinical foundation for future mechanistic investigations using transcriptomic or proteomic platforms to pinpoint key molecular targets.
Several limitations should be acknowledged. First, the retrospective, single-center design introduces the possibility of selection bias, treatment-selection bias, and residual confounding despite adjustment for available baseline characteristics. Treatment allocation was based on routine clinical practice rather than randomization; therefore, the observed associations should not be interpreted as establishing causality. Second, the sample size was relatively small, with only 11 postoperative DVT events. This limited the number of covariates that could reasonably be included in the regression analysis and resulted in relatively imprecise effect estimates. We therefore adopted a parsimonious Firth-penalized logistic regression model restricted to the treatment strategy and two prespecified baseline covariates, though residual confounding remains possible. Third, postoperative D-dimer levels and venous blood flow measurements were not included as adjustment variables because they were obtained after initiation of treatment and may represent intermediate biological responses to the intervention. Their associations with treatment should therefore be regarded as exploratory mechanistic findings rather than evidence of independent confounding or mediation. Fourth, the follow-up period was limited to 10 postoperative days. Consequently, the study primarily captured early postoperative DVT and may have missed delayed thrombotic events occurring after discharge or later during recovery. The short observation period also precludes conclusions regarding longer-term efficacy and safety. Finally, the relatively small sample and single-center setting limit the generalizability of the findings. Larger multicenter prospective studies with longer follow-up and a greater number of DVT events are required to confirm these observations.
In summary, Taohong Siwu Decoction‑based targeted drug penetration therapy as an adjunct to standard LMWH anticoagulation was associated with reduced postoperative lower limb DVT, improved coagulation function, attenuated inflammatory response, enhanced venous blood flow, and better symptom control in patients undergoing hip fracture surgery. The therapy was well tolerated, with no severe adverse events. These findings suggest a potential association between adjunctive Taohong Siwu Decoction-based targeted drug penetration therapy and reduced early postoperative DVT risk. However, given the retrospective single-center design, limited sample size, small number of DVT events, and 10-day follow-up period, the results should be considered preliminary and require confirmation in adequately powered multicenter prospective studies.
Disclosures
The authors declare that they have no conflicts of interest related to this study.
This research received no specific grant from any funding agency in the public, commercial, or not-for-profit sectors.
Acknowledgements
The authors would like to thank the medical staff involved in the diagnosis, treatment, and follow-up of patients with hip fractures at our institution. We also acknowledge the assistance of the clinical laboratory and imaging departments in providing coagulation, inflammatory markers, and ultrasound assessment data.
Materials
| Name | Company | Catalog Number | Comments |
|---|---|---|---|
| Activated partial thromboplastin time and coagulation analysis system | Werfen, USA | ACL TOP automatic coagulation analyzer | Measurement of coagulation parameters including APTT, PT, and D-dimer |
| Color Doppler ultrasound system | Mindray Medical, China | DC-35Pro | Detection of postoperative lower limb DVT and measurement of femoral vein blood flow velocity |
| Enzyme-linked immunosorbent assay kits for IL-6 and TNF-α | Tianjin Ruichuang Biotechnology Co., Ltd., China | Not applicable | Measurement of serum inflammatory cytokine concentrations |
| Low molecular weight heparin | Hainan General Alliance Pharmaceutical Co., Ltd., China | 1 mL: 5000 units | Standard postoperative anticoagulation therapy |
| Statistical analysis software | IBM Corp., USA | SPSS version 25.0 | Statistical analysis and logistic regression modeling |
| Taohong Siwu Decoction components | Pharmaceutical materials obtained according to clinical prescription | Not applicable | Preparation of TCM-targeted drug penetration therapy |
| TCM-targeted drug penetration therapy device | Jiangsu Aize Biotechnology Co., Ltd., China | HJDX-A | Delivery of targeted drug penetration therapy |
References
- Zaki HA, et al. Deep venous thrombosis (DVT) diagnostics: gleaning insights from point-of-care ultrasound (PoCUS) techniques in emergencies: a systematic review and meta-analysis. Ultrasound J. 2024;16(1):37.
- Yang WT, et al. Recurrence in isolated distal DVT after anticoagulation: a systematic review and meta-analysis of axial and muscular venous thrombosis. Thromb J. 2024;22(1):57.
- Matharu GS, et al. Clinical effectiveness and safety of aspirin for venous thromboembolism prophylaxis after total hip and knee replacement: a systematic review and meta-analysis of randomized clinical trials. JAMA Intern Med. 2020;180(3):376-384.
- Migliorini F, et al. Antithrombotic prophylaxis following total hip arthroplasty: a level I Bayesian network meta-analysis. J Orthop Traumatol. 2024;25(1):1.
- Liu HZ, Liang J, Hu AX. The efficacy and safety of aspirin in preventing venous thrombosis in major orthopedic surgery: an updated meta-analysis of randomized controlled trials. Medicine (Baltimore). 2023;102(42):e35602.
- Huang H, et al. Chinese herbal medicines for promoting blood circulation and removing blood stasis for preventing deep venous thrombosis after total hip arthroplasty: a systematic review and meta-analysis. Comb Chem High Throughput Screen. 2021;24(7):893-907.
- Huang B, et al. Xuefu Zhuyu decoction alleviates deep vein thrombosis through inhibiting the activation of platelets and neutrophils via sirtuin 1/nuclear factor kappa-B pathway. J Ethnopharmacol. 2024;333:118485.
- Li F, Zhu L, Geng Y, Wang G. Effect of hip replacement surgery on clinical efficacy, VAS score and Harris hip score in patients with femoral head necrosis. Am J Transl Res. 2021;13(4):3851-3855.
- Murphy J, et al. Mechanisms and preventative strategies for persistent pain following knee and hip joint replacement surgery: a narrative review. Int J Mol Sci. 2024;25(9):4722.
- Hicks CL, et al. The Faces Pain Scale-Revised: toward a common metric in pediatric pain measurement. Pain. 2001;93(2):173-183.
- Miró J, et al. Evaluation of reliability, validity, and preference for a pain intensity scale for use with the elderly. J Pain. 2005;6(11):727-735.
- Zheng X, et al. Comparison of efficacy and safety between aspirin and oral anticoagulants for venous thromboembolism prophylaxis after major orthopaedic surgery: a meta-analysis of randomized clinical trials. Front Pharmacol. 2024;14:1326224.
- Ding K, et al. The safety and efficacy of NOACs versus LMWH for thromboprophylaxis after THA or TKA: a systemic review and meta-analysis. Asian J Surg. 2024;47(10):4260-4270.
- Yi YH, et al. New oral anticoagulants for venous thromboembolism prophylaxis in total hip and knee arthroplasty: a systematic review and network meta-analysis. Front Pharmacol. 2022;12:775126.
- Haibier A, et al. Efficacy and safety study of low-molecular-weight heparin and fondaparinux sodium after hip arthroplasty: a retrospective cohort study. Orthop Res Rev. 2023;15:253-261.
- Zheng D, et al. Efficacy of traditional Chinese medicine combined with rivaroxaban in the treatment of lower extremity deep vein thrombosis: a meta-analysis. Medicine (Baltimore). 2022;101(39):e29483.
- Fan W, Lan S, Yang Y, Liang J. Network pharmacology prediction and molecular docking-based strategy to discover the potential pharmacological mechanism of Huang-Qi-Gui-Zhi-Wu-Wu decoction against deep vein thrombosis. J Orthop Surg Res. 2023;18(1):475.
- Shao CL, Cui GH, Guo HD. Effects and mechanisms of Taohong Siwu Decoction on the prevention and treatment of myocardial injury. Front Pharmacol. 2022;13:816347.
- Cai M, et al. [Research progress on chemical constituents, pharmacological effects, and clinical application of classic Taohong Siwu Decoction and predictive analysis of quality markers]. Zhongguo Zhong Yao Za Zhi. 2025;50(20):5671-5683. Chinese.
- Han L, et al. [Studies on anti-platelet activation effect and partial mechanisms of Taohong Siwu decoction]. Zhongguo Zhong Yao Za Zhi. 2010;35(19):2609-2612. Chinese.
- Carnevale Pellino V, et al. Pneumatic compression combined with standard treatment after total hip arthroplasty and its effects on edema of the operated limb and on physical outcomes: a pilot clinical randomized controlled study. J Clin Med. 2023;12(12):4164.
- Mackman N. Triggers, targets and treatments for thrombosis. Nature. 2008;451(7181):914-918.
- Li J, et al. Incidence and locations of deep venous thrombosis of the lower extremity following surgeries of tibial plateau fractures: a prospective cohort study. J Orthop Surg Res. 2020;15(1):605.
- Ageno W, et al. Rivaroxaban treatment for six weeks versus three months in patients with symptomatic isolated distal deep vein thrombosis: randomised controlled trial. BMJ. 2022;379:e072623.
- Liu Q, et al. A new method of monitoring catheter-directed thrombolysis for deep venous thrombosis-application of D-dimer and fibrinogen testing. Phlebology. 2022;37(3):216-222.
- Li Y, Sutedjo J, Chen YC, Gu JP. Efficacy of modified pressure cuff for thrombolytic treatment on lower extremity deep venous thrombosis. Medicine (Baltimore). 2021;100(17):e25664.
- Chen X, et al. Intermittent pneumatic compression (IPC) combined with an electric stimulator in the prevention of venous thromboembolism in stroke patients. Am J Transl Res. 2021;13(9):10837-10842.
- Kondreddy V, et al. The Gab2-MALT1 axis regulates thromboinflammation and deep vein thrombosis. Blood. 2022;140(13):1549-1564.
- Liu Q, Yang F, Kong K, Lu F. Potential causal relationships between blood metabolites, inflammatory cytokines, and venous thromboembolism. Front Immunol. 2024;15:1445790.
- Zhang K, et al. Integrated landscape of plasma metabolism and proteome of patients with post-traumatic deep vein thrombosis. Nat Commun. 2024;15(1):7831.
- Wu Z, Du Y, Cai X, Xu Q. Caprini score combined with thrombotic molecular markers for predicting DVT in patients with traumatic fractures. Sci Rep. 2025;15(1):1847.