Here, we describe an interpretable machine-learning workflow for three outcome-specific tasks in acute cholangitis: general-ward sepsis prediction, general-ward in-hospital mortality prediction, and ICU 28-day mortality prediction. The workflow integrates feature selection, model comparison, SHAP interpretation, regression analyses, and nomogram construction.
Research Article
Machine Learning Model for Predicting Risk Factor Analysis and a Mortality Prediction Model of Acute Cholangitis Complicated with Sepsis
* These authors contributed equally
In This Article
Summary
Abstract
This study examined factors associated with sepsis in acute cholangitis and developed outcome-specific models for sepsis and mortality. We retrospectively analyzed data from 1,999 patients across two centers, including 1,561 admitted to general wards and 438 to the ICU. For each prediction task, the data were divided into training and internal-validation cohorts at a 7:3 ratio. Logistic regression (LR), random forest (RF), support vector machine (SVM), and Extreme Gradient Boosting (XGBoost) models were developed and compared, and Shapley Additive Explanations (SHAP) were used for interpretation. Sepsis occurred in 544 general-ward patients (34.85%) and 299 ICU patients (68.3%). LR achieved the highest internal-validation AUC for general-ward sepsis prediction (0.826; training AUC, 0.893). Sepsis was associated with poorer in-hospital survival in the general-ward cohort and poorer 28-day survival in the ICU cohort. The ICU 28-day mortality nomogram incorporated Acute Physiology Score III (APS III), hemoglobin (Hb), alanine aminotransferase (ALT), lactate (Lac), total bilirubin (TBil), albumin, sepsis status, and kidney injury and yielded an AUC of 0.840. The general-ward in-hospital mortality nomogram incorporated albumin, kidney injury, sepsis status, blood urea nitrogen (BUN), TBil, and aspartate aminotransferase (AST), yielding an AUC of 0.904. The internally validated models showed preliminary discriminatory ability for outcome-specific risk stratification. Prospective multicenter external validation is required before clinical implementation.
Introduction
Acute cholangitis is a potentially life-threatening biliary tract infection caused by biliary obstruction and bacterial proliferation1. First described by Charcot in 1877 as "liver fever," its classic presentation is Charcot triad: fever, right upper-quadrant abdominal pain, and jaundice. Severe disease may manifest as the Reynolds pentad, which adds hypotension and altered mental status2. Common causes include choledocholithiasis, biliary strictures, biliary tumors, and parasitic obstruction; choledocholithiasis accounts for approximately half of cases1. Biliary obstruction causes bile stasis and increased intraductal pressure, which can impair the biliary epithelial barrier, promote bacterial translocation, and trigger inflammation3. Overall mortality ranges from approximately 2.7% to 10% but may reach 50% in severe disease4. Bacteria and endotoxins may enter the circulation in severe acute cholangitis, provoking systemic inflammation and sepsis.
Sepsis is characterized by life-threatening organ dysfunction caused by a dysregulated host response to infection and may progress to multiorgan failure5. Globally, an estimated 48.9 million sepsis cases occur each year, and sepsis-related deaths account for approximately 19.7% of all deaths6. Despite advances in emergency and critical care, sepsis mortality remains substantial7. The Tokyo Guidelines 2018 (TG18) are widely used to diagnose and grade the severity of acute cholangitis2. However, identifying concomitant sepsis and predicting adverse outcomes remain challenging14. Improved risk-stratification approaches may therefore help identify patients who warrant closer assessment.
Previous studies have identified hematologic indices and measures of hepatic and renal function as potential markers of acute cholangitis severity and prognosis8. The Sequential Organ Failure Assessment (SOFA) score is widely used to quantify organ dysfunction and has prognostic value in sepsis9. Acute Physiology Score III (APS III), the acute physiology component of APACHE III, summarizes physiologic derangement and contributes to mortality-risk assessment in ICU patients10. Comorbidities such as cardiovascular disease, diabetes, and chronic liver disease may further increase the risk of adverse outcomes11. Nevertheless, evidence remains limited regarding outcome-specific prediction models for sepsis and mortality in acute cholangitis.
Machine learning has increasingly been applied to structured clinical data to identify complex patterns and support risk estimation12,13. Accordingly, we developed and internally validated interpretable machine-learning models for three distinct tasks: general-ward sepsis prediction, general-ward in-hospital mortality prediction, and ICU 28-day mortality prediction. We compared LR, RF, SVM, and XGBoost and used SHAP to quantify feature importance and explain individual predictions. The objective was to evaluate outcome-specific predictive performance and model interpretability, rather than to establish a clinical decision-making system. Prospective multicenter external validation is required before these models can be considered for routine clinical use.
Protocol
This study was performed in line with the principles of the Declaration of Helsinki. Approval was granted by the Ethics Committee of Binhai County People's Hospital (Approval No. 2024-BHKYLL-055).
Methodology
Patients
We retrospectively enrolled 1,999 adults diagnosed with acute cholangitis at two centers between January 2020 and August 2024: Binhai County People's Hospital and Huai'an Second People's Hospital. Of these patients, 1,561 were managed in general wards, and 438 were admitted to the ICU. The study protocol was approved by the Ethics Committee of Binhai County People's Hospital (Approval No. 2024-BHKYLL-055). Written informed consent was obtained from each participant or a legally authorized representative.
Patients were eligible if they (1) had a physician-confirmed diagnosis of acute cholangitis, (2) were aged 18 years or older, and (3) had complete medical records and follow-up data for the relevant outcome.
Patients were excluded if they (1) had a concurrent malignancy expected to substantially affect survival, (2) were unable to provide informed consent, or (3) were lost to follow-up.
Clinical data collection and follow-up
Clinical characteristics and laboratory data were retrospectively extracted from the medical records of Binhai County People's Hospital and Huai'an Second People's Hospital. Demographic and medical-history variables included sex, age, cardiovascular disease, diabetes, hepatitis, cirrhosis, hyperlipidemia, and stroke. The first available laboratory measurements after admission to the general ward or ICU included white blood cell count (WBC), platelet count (PLT), hemoglobin (Hb), albumin, sodium, potassium, chloride, lactate (Lac), total bilirubin (TBil), alanine aminotransferase (ALT), aspartate aminotransferase (AST), creatinine (CR), and blood urea nitrogen (BUN). Recorded interventions included biliary stent placement, endoscopic retrograde cholangiopancreatography (ERCP), and percutaneous drainage. Disease-severity measures included the SOFA score, APS III, and the requirement for mechanical ventilation. Blood specimens were processed using standardized automated laboratory procedures. Patients discharged alive were followed through outpatient visits or telephone contact when follow-up was required. Sepsis status was assessed throughout hospitalization according to Sepsis-3 criteria; the sepsis group therefore included patients with sepsis at admission and those who developed sepsis later. Because the exact onset time of sepsis was unavailable and hospital length of stay was retained in the final general-ward sepsis model, a uniform prospective admission-time prediction landmark could not be established for that model. It should therefore be interpreted as a retrospective in-hospital risk-stratification model.
Outcome
The study evaluated three related but distinct prediction tasks. The primary outcome was sepsis status during hospitalization among general-ward patients with acute cholangitis, as determined using Sepsis-3 criteria. The secondary outcomes were all-cause in-hospital mortality in the general-ward cohort, defined as death before discharge, and all-cause 28-day mortality in the ICU cohort, defined as death within 28 days after ICU admission.
Statistical analysis
The distribution of each continuous variable was assessed using the Shapiro-Wilk test. Normally distributed variables were presented as the mean ± standard deviation and were compared using the independent-samples Student's t-test; Welch's t-test was used when the homogeneity-of-variance assumption was not met. Non-normally distributed variables were presented as the median and interquartile range (IQR) and were compared using the Wilcoxon rank-sum test. Categorical variables were presented as counts and percentages and compared using the chi-square or Fisher's exact test, as appropriate. All tests were two-sided, and P < 0.05 was considered statistically significant.
Patients were stratified according to the presence or absence of sepsis. In the general-ward cohort, multivariable logistic regression was used to identify factors associated with sepsis; results are reported as odds ratios (ORs) with 95% confidence intervals (CIs). Kaplan-Meier curves and log-rank tests were used to compare in-hospital survival in the general-ward cohort and 28-day survival in the ICU cohort between patients with and without sepsis. Cox proportional hazards models were fitted separately for the two cohorts, and results are reported as hazard ratios (HRs) with 95% CIs.
Four progressively adjusted Cox models were constructed. Model 1 was unadjusted. Model 2 was adjusted for age and sex. Model 3 was additionally adjusted for hypertension, diabetes, heart failure, stroke, and kidney injury. In the general-ward cohort, Model 4 was further adjusted for WBC, Hb, PLT, albumin, CR, BUN, AST, ALT, sodium, potassium, chloride, and Lac. In the ICU cohort, Model 4 additionally included APS III and SOFA because these severity scores were available only for ICU patients.
For each prediction task, a fixed random seed of 500 was used to divide the corresponding complete-case dataset into training and internal-validation cohorts at a 7:3 ratio. All feature-selection procedures were conducted exclusively in the training cohort; the internal-validation cohort was not used for predictor selection. Within the training cohort, LASSO regression with 10-fold cross-validation and the Boruta algorithm were used to identify candidate predictors. For LASSO, predictors with nonzero coefficients at lambda.min were retained. Boruta was run independently for up to 5,000 iterations. The resulting candidate predictors were used consistently to develop four models for each task: LR, RF, SVM, and XGBoost. Binary clinical variables were encoded as 0 or 1. No manual normalization or transformation was applied before fitting LR, RF, or XGBoost. Scaling for LASSO and SVM followed the default settings of their respective software implementations, and preprocessing parameters derived from the training cohort were applied unchanged to the internal validation cohort. No oversampling, undersampling, synthetic minority oversampling technique, or manually specified class weighting was used. The best-performing model was defined as the model with the highest overall internal-validation performance among the four prespecified implementations, rather than a fully optimized version of each algorithm. The fitted training-cohort models were then evaluated in the internal-validation cohort. The complete workflow is shown in Supplementary Figure 1, and implementation details are provided in Supplementary Table 1.
Model performance was evaluated using the area under the receiver operating characteristic curve (AUC), sensitivity, specificity, recall, F1 score, and accuracy. AUC summarizes discrimination across all possible classification thresholds, with 0.5 indicating no discrimination and 1.0 indicating perfect discrimination. At the selected threshold, true positives (TP) and true negatives (TN) were correctly classified positive and negative cases, whereas false positives (FP) and false negatives (FN) were incorrectly classified cases. Sensitivity, equivalent to recall in binary classification, was calculated as TP/(TP + FN); specificity as TN/(TN + FP); precision as TP/(TP + FP); F1 score as 2 × precision × recall/(precision + recall); and accuracy as (TP + TN)/(TP + TN + FP + FN). The positive classes were sepsis (coded as 1) for the general-ward sepsis prediction model, in-hospital death (coded as 1) for the general-ward in-hospital mortality model, and death within 28 days (coded as 1) for the ICU 28-day mortality model. The corresponding negative classes were absence of sepsis, discharge alive, and survival at 28 days (all coded as 0), respectively.
Four supervised machine-learning algorithms were selected to represent complementary strategies for structured clinical data. LR served as an interpretable reference model for additive linear associations. RF represented a bagging-based ensemble capable of modeling nonlinear relationships and interactions while reducing variance. SVM represented a margin-based classifier capable of accommodating nonlinear decision boundaries in moderately sized datasets. XGBoost represented a regularized boosting algorithm capable of capturing higher-order interactions and nonlinear patterns. All algorithms used the same candidate predictor set and were evaluated in the same training and internal-validation cohorts for each prediction task.
SHAP analysis was performed for the best-performing model for each outcome to quantify global feature importance and explain individual predictions. Nomogram development followed outcome-specific procedures. For the general-ward sepsis outcome, candidate predictors were entered into a multivariable logistic regression model, and variables that remained statistically significant at P < 0.05 were incorporated into the final nomogram. For the two mortality outcomes, predictor inclusion was based on the global SHAP feature-importance results of the corresponding best-performing models, without additional P-value-based elimination.
During retrospective database assembly, records missing clinical, laboratory, or outcome data required for the relevant analysis were excluded before entry into the final analytical dataset. A detailed pre-entry screening log was not retained; therefore, the number of records excluded due to missing data and the original variable-level patterns of missingness could not be reconstructed. The finalized general-ward cohort (n = 1,561) and ICU cohort (n = 438) contained no missing values for the variables used in the corresponding analyses (0% missing), and no statistical imputation was performed. All 1,561 general-ward patients were included in the sepsis and in-hospital mortality analyses, and all 438 ICU patients were included in the 28-day mortality analysis. Variable-level completeness in the finalized datasets is reported in Supplementary Table 2.
Machine-learning analyses were conducted using the machine-learning analysis platform. Conventional statistical analyses were performed using an open-source statistical computing environment and Statistical software. All statistical tests were two-sided, and P < 0.05 was considered statistically significant.
Results
Baseline characteristics of the study cohorts
The study included 1,999 patients hospitalized with acute cholangitis: 1,561 in the general-ward cohort and 438 in the ICU cohort. In the general-ward cohort, 544 patients developed or had sepsis, and 1,017 did not; in the ICU cohort, 299 patients had sepsis, and 139 did not. Baseline characteristics stratified by sepsis status are presented in Table 1. In the general-ward cohort, patients with sepsis were older and had higher potassium, AST, CR, and BUN values than patients without sepsis (all P < 0.05), whereas Hb, PLT, and albumin were lower (all P < 0.05). Diabetes, heart failure, hyperlipidemia, kidney injury, and longer hospital stay were more common or greater among patients with sepsis (all P < 0.05); stroke, hypertension, and hepatitis did not differ significantly between groups. In the ICU cohort, patients with sepsis had higher potassium, TBil, AST, CR, and BUN and lower albumin than patients without sepsis (all P < 0.05). Kidney injury and longer ICU stay were also associated with sepsis status (P < 0.05), whereas the other evaluated comorbidities did not differ significantly. SOFA and APS III scores were higher in ICU patients with sepsis than in those without sepsis (both P < 0.05).
Feature selection for general-ward sepsis prediction
The general-ward dataset was divided into a training cohort of 1,092 patients and an internal-validation cohort of 469 patients. For the sepsis outcome, the training cohort included 380 patients with sepsis and 712 without sepsis, and the internal-validation cohort included 164 patients with sepsis and 305 without sepsis. For general-ward in-hospital mortality, the training cohort included 56 deaths and 1,036 survivors, and the internal-validation cohort included 24 deaths and 445 survivors. The ICU training cohort included 306 patients (76 deaths within 28 days and 230 survivors), and the internal-validation cohort included 132 patients (33 deaths and 99 survivors at 28 days). For general-ward sepsis prediction, 27 variables were initially considered. Boruta classified variables as confirmed important, tentative, or rejected (Figure 1A). Eleven variables were classified as important: albumin, kidney injury, hospital length of stay, CR, WBC, PLT, heart failure, age, and Hb. LASSO regression with 10-fold cross-validation retained 19 candidate features (Figures 1B,C). The feature-selection results and clinical relevance were then considered together, yielding 11 candidate predictors: BUN, CR, WBC, PLT, age, heart failure, albumin, kidney injury, hospital length of stay, Hb, and cirrhosis.
Model comparison and SHAP interpretation for general-ward sepsis prediction
LR, RF, SVM, and XGBoost were compared for the general-ward sepsis prediction task using the same training and internal-validation cohorts (Figure 2). The training-cohort AUCs were 0.893 for LR, 0.853 for RF, 0.718 for SVM, and 0.767 for XGBoost; the corresponding internal-validation AUCs were 0.826, 0.787, 0.647, and 0.737, respectively (Figure 2A,B). LR achieved the highest internal-validation AUC and the best overall performance among the four evaluated models and was therefore selected for further interpretation. Detailed performance measures are provided in Supplementary Table 3. Within the evaluated threshold-probability range, decision-curve analysis indicated a greater net benefit for LR (Figure 2D), and the calibration plot showed agreement between predicted and observed sepsis probabilities (Figure 2E). These findings are based on internal validation and do not establish readiness for routine clinical implementation.
SHAP analysis was used to interpret the selected LR model. Figure 2C,F show global predictor contributions, with predictors ordered by their overall influence on model estimates. In descending order of importance, the predictors were BUN, CR, WBC, PLT, age, heart failure, albumin, kidney injury, hospital length of stay, Hb, and cirrhosis. Figure 2G provides a patient-level force plot. Red features increased the estimated probability of sepsis, whereas blue features decreased it. The term f(x) represents the model output for the individual relative to the baseline expectation.
Construction of the general-ward sepsis nomogram
Candidate predictors retained after feature selection were entered into a multivariable logistic regression model (Table 2). Variables that remained significant at P < 0.05 were incorporated into the final nomogram (Figure 3A): kidney injury, heart failure, WBC, PLT, albumin, and hospital length of stay. The nomogram yielded an AUC of 0.791 (Figure 3B), and the calibration plot showed agreement between predicted and observed sepsis probabilities (Figure 3C).
Association between sepsis and survival outcomes
Kaplan-Meier curves were used to compare survival according to sepsis status (Figure 4). In the ICU cohort, patients with sepsis had poorer 28-day survival than those without sepsis (Figure 4A; log-rank P < 0.001). In the general-ward cohort, patients with sepsis had poorer in-hospital survival than those without sepsis (Figure 4B; log-rank P < 0.001).
Four progressively adjusted Cox proportional hazards models were used to evaluate the association between sepsis and mortality (Table 3). In the general-ward cohort, sepsis was associated with in-hospital mortality in the unadjusted model (Model 1: HR, 4.48; 95% CI, 2.53-7.95; P < 0.001). The association remained after adjustment for age and sex (Model 2: HR, 4.11; 95% CI, 2.31-7.32; P < 0.001), additional comorbidities (Model 3: HR, 3.51; 95% CI, 1.94-6.35; P < 0.001), and laboratory variables (Model 4: HR, 2.18; 95% CI, 1.15-4.15; P = 0.018). In the ICU cohort, sepsis was associated with 28-day mortality in Model 1 (HR, 5.94; 95% CI, 3.00-11.76; P < 0.001), Model 2 (HR, 5.89; 95% CI, 2.98-11.67; P < 0.001), Model 3 (HR, 4.81; 95% CI, 2.41-9.61; P < 0.001), and Model 4 (HR, 4.54; 95% CI, 2.22-9.29; P < 0.001). These findings were consistent with the Kaplan-Meier analyses.
Feature selection for the mortality models
Boruta and LASSO were used to select candidate predictors for general-ward in-hospital mortality and ICU 28-day mortality (Figure 5). For ICU 28-day mortality, Boruta identified 10 important variables, including APS III, TBil, PLT, ALT, sepsis status, and Hb (Figure 5A). LASSO with 10-fold cross-validation retained 15 candidate features (Figures 5B,C). Considering both feature-selection procedures and clinical relevance, eight predictors were retained: APS III, Hb, ALT, Lac, TBil, sepsis status, kidney injury, and albumin. For general-ward in-hospital mortality, six predictors were retained: albumin, kidney injury, sepsis status, BUN, TBil, and AST (Figures 5D–F).
Model comparison and SHAP interpretation for the mortality outcomes
LR, RF, SVM, and XGBoost were compared for ICU 28-day mortality using the corresponding training and internal-validation cohorts (Figure 6). The training-cohort AUCs were 0.831 for LR, 0.883 for RF, 0.481 for SVM, and 0.862 for XGBoost; the corresponding internal-validation AUCs were 0.773, 0.810, 0.322, and 0.805, respectively (Figures 6A,B). RF was selected as the best-performing model based on its validation AUC and overall performance metrics. Detailed results are provided in Supplementary Table 4. Within the evaluated threshold-probability range, decision-curve analysis indicated a potential net benefit for RF (Figure 6D), whereas calibration showed only moderate agreement between predicted and observed 28-day mortality probabilities (Figure 6E). Global SHAP analyses ranked predictors as follows: APS III, Hb, ALT, Lac, TBil, albumin, sepsis status, and kidney injury (Figures 6C,F). Figure 6G presents a representative patient-level explanation.
For general-ward in-hospital mortality, the training-cohort AUCs were 0.951 for LR, 0.873 for RF, 0.641 for SVM, and 0.902 for XGBoost; the corresponding internal-validation AUCs were 0.900, 0.829, 0.564, and 0.871, respectively (Figures 7A,B). LR achieved the highest internal-validation AUC and was selected as the best-performing model. Detailed results are provided in Supplementary Table 4. Within the evaluated threshold-probability range, decision-curve analysis indicated a potential net benefit for LR (Figure 7D), and calibration showed moderate agreement between predicted and observed in-hospital mortality probabilities (Figure 7E). Global SHAP analyses ranked predictors as follows: albumin, kidney injury, sepsis status, BUN, TBil, and AST (Figures 7C,F). Figure 7G presents a representative patient-level explanation.
Construction of the ICU 28-day mortality and general-ward in-hospital mortality nomograms
Separate nomograms were constructed using predictors prioritized by global SHAP feature importance in the best-performing mortality models (Figure 8). The ICU 28-day mortality nomogram incorporated APS III, Hb, ALT, Lac, TBil, albumin, sepsis status, and kidney injury (Figure 8A). It yielded an AUC of 0.840 (Figure 8B), and calibration showed agreement between predicted and observed 28-day mortality probabilities within the study cohort (Figure 8C). The general-ward in-hospital mortality nomogram incorporated albumin, kidney injury, sepsis status, BUN, TBil, and AST (Figure 8D). It yielded an AUC of 0.904 (Figure 8E), and calibration showed agreement between predicted and observed in-hospital mortality probabilities within the study cohort (Figure 8F). Because these estimates were derived solely from internal validation, they should be considered preliminary and require confirmation in independent external cohorts.
Assessment of model complexity relative to outcome events
Model complexity was assessed by comparing the number of outcome events in each training cohort with the number of predictors in the corresponding final nomogram. The general-ward sepsis prediction model included 380 sepsis events and six predictors (63.3 events per predictor). The general-ward in-hospital mortality model included 56 deaths and six predictors (9.3 events per predictor), and the ICU 28-day mortality model included 76 deaths and eight predictors (9.5 events per predictor). Thus, event support was substantial for the sepsis model but more limited for the two mortality models, which were close to the commonly cited rule of thumb of approximately 10 events per predictor.
DATA AVAILABILITY:
All anonymized patient-level data used in this study are publicly available in the supplementary files attached to this article. Supplementary Table 5 contains the data of the general ward cohort, and Supplementary Table 6 contains the data of the intensive care unit cohort. Before submission, all direct personal identification information and other potentially identifiable information have been removed.
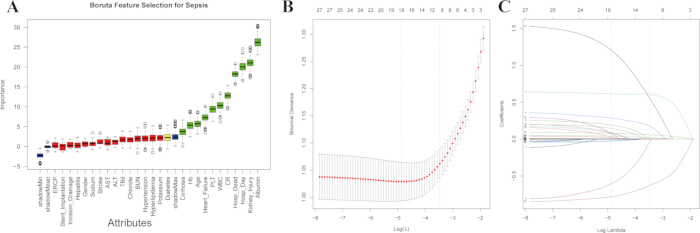
Figure 1: Feature selection for the general-ward sepsis prediction model in patients with acute cholangitis. (A) Boruta feature-selection analysis; (B,C) LASSO coefficient-path and 10-fold cross-validation analyses. Please click here to view a larger version of this figure.
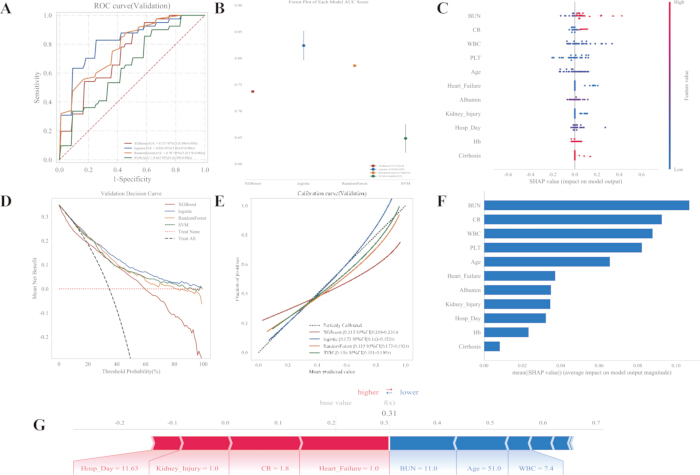
Figure 2: Comparison and interpretation of machine-learning models for general-ward sepsis prediction in patients with acute cholangitis. (A,B) ROC curves for the candidate machine-learning models in the training and internal-validation cohorts; (C,F) global SHAP analyses of predictor contributions; (D) decision-curve analysis; (E) calibration curves; (G) individual SHAP explanation for a representative patient. Please click here to view a larger version of this figure.
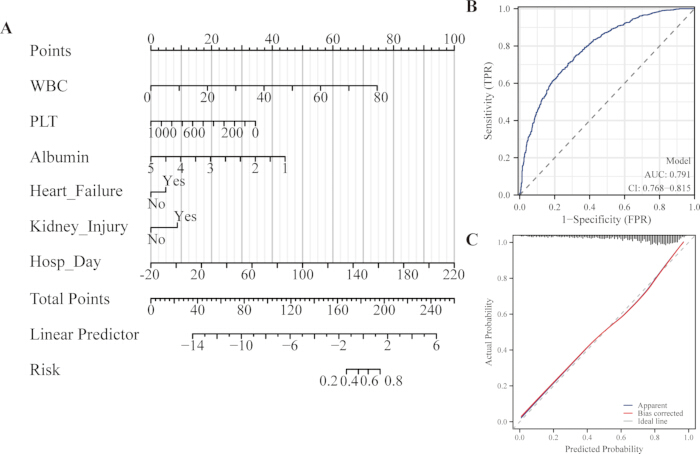
Figure 3: Construction and evaluation of the general-ward sepsis prediction nomogram. (A) Nomogram; (B) ROC curve; (C) calibration curve. Please click here to view a larger version of this figure.
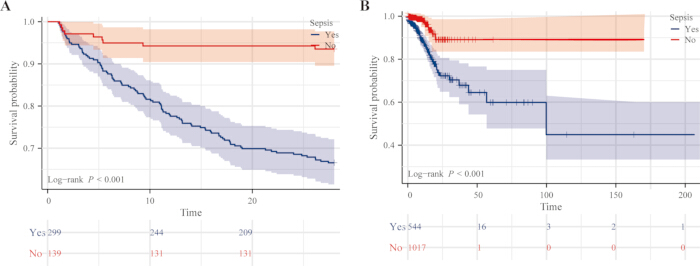
Figure 4: Kaplan–Meier survival curves for patients with acute cholangitis stratified by sepsis status. (A) Comparison of 28-day survival between patients with and without sepsis in the ICU cohort; (B) comparison of in-hospital survival between patients with and without sepsis in the general-ward cohort. Please click here to view a larger version of this figure.
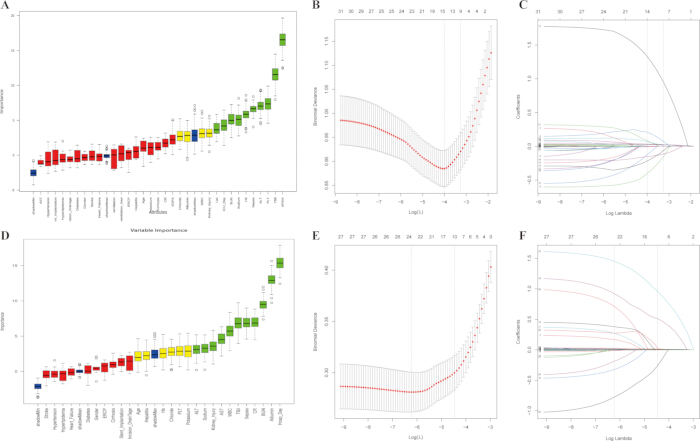
Figure 5: Feature selection for the ICU 28-day mortality and general-ward in-hospital mortality models. (A) Boruta feature-selection analysis for ICU 28-day mortality; (B,C) LASSO coefficient-path and 10-fold cross-validation analyses for ICU 28-day mortality; (D) Boruta feature-selection analysis for general-ward in-hospital mortality; (E,F) LASSO coefficient-path and 10-fold cross-validation analyses for general-ward in-hospital mortality. Please click here to view a larger version of this figure.
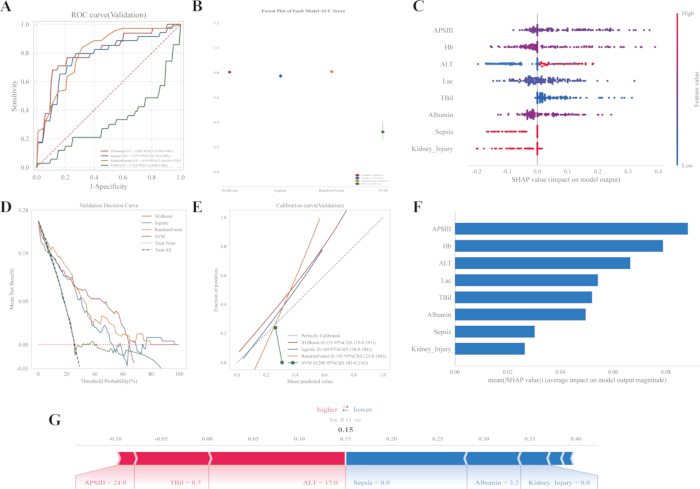
Figure 6: Comparison and interpretation of machine-learning models for ICU 28-day mortality in patients with acute cholangitis. (A,B) ROC curves for the candidate machine-learning models in the training and internal-validation cohorts; (C,F) global SHAP analyses of predictor contributions; (D) decision-curve analysis; (E) calibration curves; (G) individual SHAP explanation for a representative patient. Please click here to view a larger version of this figure.
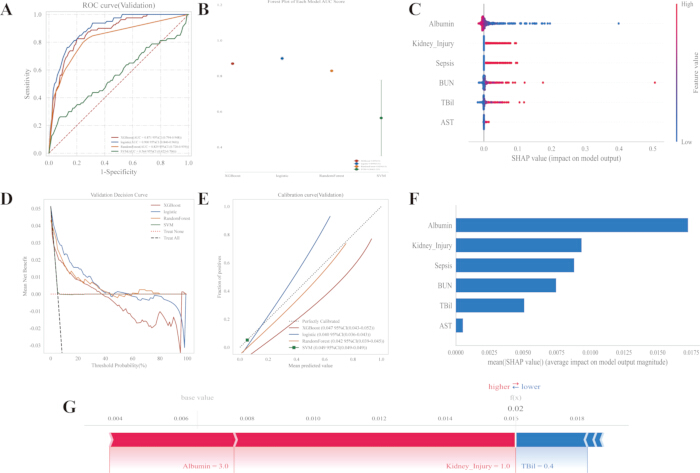
Figure 7: Comparison and interpretation of machine-learning models for general ward in-hospital mortality in patients with acute cholangitis. (A,B) ROC curves for the candidate machine-learning models in the training and internal-validation cohorts; (C,F) global SHAP analyses of predictor contributions; (D) decision-curve analysis; (E) calibration curves; (G) individual SHAP explanation for a representative patient. Please click here to view a larger version of this figure.
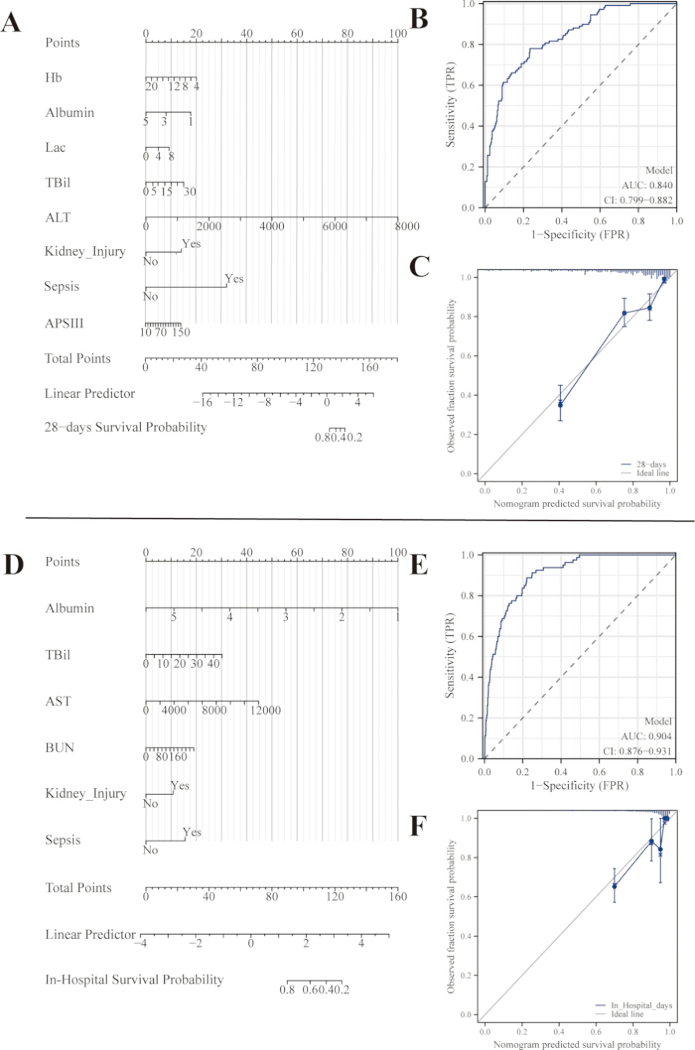
Figure 8: Construction and evaluation of the ICU 28-day mortality and general-ward in-hospital mortality nomograms. (A–C) Nomogram, ROC curve, and calibration curve for ICU 28-day mortality; (D–F) nomogram, ROC curve, and calibration curve for general-ward in-hospital mortality. Please click here to view a larger version of this figure.
Table 1: Baseline characteristics of the included patients. Clinical and laboratory characteristics are presented separately for the general-ward and ICU cohorts and compared between patients with and without sepsis. Please click here to download this file.
Table 2: Multifactorial analysis of sepsis in patients with cholangitis. Abbreviations: WBC: white blood cell; PLT: platelet. Numbers indicating p-values less than 0.05 are bolded. Please click here to download this file.
Table 3: The relationship between sepsis and the prognosis of patients with cholangitis. Model 1 was unadjusted. Model 2 was adjusted for age and sex. Model 3 was further adjusted for hypertension, diabetes, heart failure, stroke, and kidney injury. For the general-ward cohort. Model 4 was additionally adjusted for WBC, Hb, PLT, albumin, CR, BUN, AST, ALT, sodium, potassium, chloride, and Lac. For the ICU cohort, Model 4 was additionally adjusted for APS III, SOFA, WBC, Hb, PLT, albumin, CR, BUN, AST, ALT, sodium, potassium, chloride, and Lac. HR, hazard ratio; CI, confidence interval; APS III, Acute Physiology and Chronic Health Evaluation III; SOFA, Sequential Organ Failure Assessment; WBC, white blood cell count; Hb, hemoglobin; PLT, platelet count; CR, creatinine; BUN, blood urea nitrogen; AST, aspartate aminotransferase; ALT, alanine aminotransferase; Lac, lactate. Bold values indicate statistical significance at P < 0.05. Please click here to download this file.
Supplementary Figure 1: Overall study and machine-learning workflow. Patients with acute cholangitis were separated into general-ward and ICU cohorts, and three prediction tasks were defined: general-ward sepsis, general-ward in-hospital mortality, and ICU 28-day mortality. For each task, the data were divided into training and internal-validation cohorts at a 7:3 ratio before feature selection. LASSO and Boruta were performed exclusively in the training cohort, after which LR, RF, SVM, and XGBoost were developed and compared. The best-performing model was selected based on internal validation performance and interpreted using SHAP. The general-ward sepsis nomogram used variables retained in multivariable logistic regression, whereas the mortality nomograms used predictors prioritized by global SHAP feature importance.Please click here to download this file.
Supplementary Table 1: Detailed computational implementation, preprocessing procedures, feature-selection settings, and machine-learning model parameters. Abbreviations: AUC, area under the receiver operating characteristic curve; FN, false negative; FP, false positive; ICU, intensive care unit; LASSO, least absolute shrinkage and selection operator; LR, logistic regression; RF, random forest; SHAP, Shapley Additive Explanations; SMOTE, synthetic minority oversampling technique; SVM, support vector machine; TN, true negative; TP, true positive; XGBoost, Extreme Gradient Boosting. Note: The machine-learning analyses were originally performed through a cloud-based platform. Because the platform was subsequently upgraded, exact historical backend package build numbers were no longer accessible; therefore, current Python package versions could not be retroactively reported as the versions used in the original analyses. The algorithm values shown above represent the documented preset parameter settings, not outcome-specific hyperparameter optimization.Please click here to download this file.
Supplementary Table 2: Variable-level data completeness in the finalized general-ward and ICU analytical datasets. The finalized datasets contained no missing values for the variables included in the corresponding analyses, and no statistical imputation was performed. Records missing required data were excluded during retrospective database assembly; the exact number of pre-entry exclusions and the original patterns of missingness were not retained.Please click here to download this file.
Supplementary Table 3: Performance of the candidate machine-learning models for general-ward sepsis prediction in patients with acute cholangitis. Evaluation of the effectiveness of machine learning models in predicting sepsis in patients with acute cholangitis.Please click here to download this file.
Supplementary Table 4: Performance of the candidate machine-learning models for general-ward in-hospital mortality and ICU 28-day mortality in patients with acute cholangitis. Performance of LR, RF, SVM, and XGBoost is summarized for the training and internal-validation cohorts using AUC, sensitivity, specificity, recall, F1 score, and accuracy.Please click here to download this file.
Supplementary Table 5: Anonymized patient-level data for the general-ward cohort. The dataset contains the clinical and laboratory variables used in the analyses of sepsis and in-hospital mortality.Please click here to download this file.
Supplementary Table 6: Anonymized patient-level data for the ICU cohort. The dataset contains the clinical and laboratory variables used to analyze 28-day mortality.Please click here to download this file.
Discussion
Acute cholangitis is a potentially life-threatening biliary tract infection. Although mild disease often responds well to treatment, reported mortality can reach 50% in severe cases1,5. Mortality may approach 40% when septic shock develops14. Sepsis indicates that infection is no longer confined to the biliary tract and may progress rapidly to systemic inflammation and multiorgan dysfunction. Identifying factors associated with sepsis and adverse outcomes is therefore important, particularly among patients requiring ICU care.
Among the 1,999 patients included in this study, 843 (42.17%) had or developed sepsis. The proportion was 34.85% in the general-ward cohort and 68.3% in the ICU cohort; the higher proportion in the ICU likely reflects greater baseline disease severity. Patients with sepsis tended to be older, consistent with previous findings and potentially related to age-associated physiologic decline, impaired immune function, and a greater burden of comorbidities.15 Liu et al.16 developed a logistic regression nomogram for sepsis in acute cholangitis using age, duration of ventilator support, diabetes, coagulopathy, and systolic blood pressure; the reported AUCs were 0.700 in the training cohort and 0.647 in the validation cohort. In this study, LR achieved AUCs of 0.893 in the training cohort and 0.826 in the internal-validation cohort. A more parsimonious general-ward sepsis nomogram was subsequently constructed using kidney injury, heart failure, WBC, PLT, albumin, and hospital length of stay, and yielded an AUC of 0.791. Although the internal-validation AUC of our best-performing machine-learning model was numerically higher than that of the previously published nomogram, the comparison is indirect because the populations, predictors, data sources, and validation procedures differed. Independent external validation is required before comparative performance, and generalizability can be established.
Sepsis remained associated with mortality after sequential adjustment, supporting its prognostic relevance in acute cholangitis. Sepsis is defined as life-threatening organ dysfunction caused by a dysregulated host response to infection17. Endothelial, inflammatory, oxidative, and coagulation abnormalities may contribute to organ dysfunction and adverse outcomes18,19. The ICU 28-day mortality nomogram incorporated APS III, Hb, ALT, Lac, TBil, albumin, sepsis status, and kidney injury, yielding an AUC of 0.840. The general-ward in-hospital mortality nomogram incorporated albumin, kidney injury, sepsis status, BUN, TBil, and AST, yielding an AUC of 0.904. Schneider et al. reported a mean cross-validated AUC of 0.915 for the Mortality Risk for Acute Cholangitis model. This value is numerically similar to that of the general-ward nomogram, but direct comparison is inappropriate because the models were developed and evaluated in different cohorts.
APS III is the acute physiology component of APACHE III and summarizes the severity of physiologic derangement in critically ill patients10. APS III and SOFA have been evaluated for prognostic assessment in critical illness and sepsis20,21,22. TG18 supports the diagnosis and early assessment of severity in acute cholangitis using clinical and laboratory findings, including fever, WBC count, bilirubin, and albumin. However, systemic inflammatory response syndrome criteria may provide additional information when screening patients with acute cholangitis for sepsis14. Lower Hb has also been associated with mortality in older patients with acute cholangitis23. Lactate is a clinically important marker of tissue hypoperfusion and organ dysfunction; during sepsis, elevated concentrations may reflect impaired oxygen delivery, altered metabolism, and reduced clearance24,25.
Elevated bilirubin and aminotransferase concentrations have previously been associated with early mortality in acute cholangitis26. Biliary obstruction causes cholestasis and increased intraductal pressure. Reflux of bilirubin into the circulation reflects impaired biliary excretion, whereas elevated aminotransferases may indicate hepatocellular injury caused by bile-acid toxicity, inflammation, or secondary hepatic ischemia.
Previous risk models for sepsis or mortality in acute cholangitis have sometimes relied on limited sets of predictors or variables that may not be readily available, such as microbiologic culture results16,27. The outcome-specific models primarily used routinely recorded clinical and laboratory variables; however, the timing and availability of these variables differed by setting. APS III was available only in the ICU, and hospital length of stay was not available at the time of admission. Consequently, the practical value of these models must be evaluated prospectively at clearly defined prediction time points. Kidney injury remains clinically relevant because it is independently associated with all-cause mortality in acute cholangitis28.
We used a staged modeling framework rather than relying on a single algorithm. LASSO and Boruta served as complementary feature-selection methods: LASSO reduces dimensionality and collinearity through coefficient shrinkage, whereas Boruta is designed to identify all relevant predictors, including variables involved in nonlinear relationships or interactions. LR, RF, SVM, and XGBoost were then developed using the same candidate predictors and the same training/internal-validation split. Model selection emphasized internal-validation performance rather than training performance alone, which may reduce but cannot eliminate overfitting. Calibration and decision-curve analyses were also used to assess agreement between predicted and observed risks and to evaluate potential net benefit across threshold probabilities.
For general-ward sepsis prediction, LR achieved the highest internal-validation AUC, suggesting that more complex nonlinear algorithms did not provide additional predictive value in this dataset. This finding does not rule out nonlinear associations, as algorithm performance depends on sample size, predictor distributions, hyperparameter settings, and cohort characteristics. SHAP was applied to the best-performing model for each task to quantify global feature importance and explain patient-level estimates. The framework comprised three outcome- and setting-specific models: a general-ward sepsis prediction model, a general-ward in-hospital mortality model, and an ICU 28-day mortality model. The sepsis nomogram retained variables significant in multivariable logistic regression, whereas the mortality nomograms used predictors prioritized by global SHAP feature importance without additional P-value-based elimination. This approach allowed the predictor sets to reflect the information available in each setting and avoided applying ICU-specific measures such as APS III to general-ward patients. Nevertheless, these internally validated models are research tools for risk stratification and should not be interpreted as causal models or substitutes for clinical judgment.
The three models address distinct settings, outcomes, and assessment points. The general-ward sepsis prediction model incorporates kidney injury, heart failure, WBC, PLT, albumin, and hospital length of stay. Because the length of stay is unavailable at admission and the exact onset time of sepsis was not recorded, this model should be interpreted as a retrospective in-hospital risk-stratification model rather than an admission-time prediction tool. The general-ward in-hospital mortality model incorporates albumin, kidney injury, sepsis status, BUN, TBil, and AST, and can be calculated only after these variables are available during hospitalization. The ICU 28-day mortality model incorporates APS III, Hb, ALT, Lac, TBil, albumin, sepsis status, and kidney injury and can be assessed after ICU admission once the required information is available. Nomograms convert predictor values into estimated outcome probabilities, whereas SHAP explains the contribution of individual variables. At present, these internally validated models should be regarded as research tools that provide continuous risk estimates rather than fixed treatment recommendations. They are intended to complement the Sepsis-3 criteria, the TG18-based assessment, and clinical judgment, and require prospective, multicenter external validation before routine implementation.
This study has several limitations. First, its retrospective design may introduce selection bias, missing-data bias, measurement variability, and residual confounding. Sepsis classification relied on existing medical records, and uncertainty about the onset time may have led to misclassification. Records with incomplete required data were excluded prior to the construction of the analytical database, but a detailed pre-entry screening log was not retained. We therefore could not quantify these exclusions or compare the original missingness patterns between the general-ward and ICU cohorts. Although the finalized datasets contained no missing values, complete-case selection may have introduced bias if data completeness was associated with disease severity or outcomes. Laboratory measurements were not necessarily obtained at a uniform time relative to admission, sepsis onset, or treatment, and interventions such as antimicrobial therapy, biliary drainage, and organ support may have affected both laboratory values and mortality. In-hospital mortality may also have been influenced by discharge or referral practices, whereas ascertainment of 28-day mortality depended on the completeness of follow-up. Adjustment for measured covariates could not eliminate unmeasured or time-varying confounding; consequently, the reported associations should not be interpreted as causal.
Second, although patients were recruited from two institutions, model performance was evaluated only using a random internal validation split. The reported performance may therefore be optimistic, and generalizability to other institutions and populations remains uncertain. Prospective multicenter validation using temporally and geographically independent cohorts is required. In addition, the exact onset time of sepsis was unavailable, preventing the separation of sepsis present at admission from sepsis that developed during hospitalization and precluding calculation of pre- and post-sepsis lengths of stay. Because hospital length of stay was included as a predictor, the general-ward sepsis prediction model should be interpreted as a retrospective in-hospital risk-stratification model rather than an admission-time or prospective time-to-event model.
Third, LR, RF, SVM, and XGBoost are established algorithms, and this study did not introduce a novel architecture or optimization framework. They were intentionally selected to represent complementary linear, margin-based, bagging, and boosting strategies suitable for structured clinical data. Restricting the analysis to these algorithms may nevertheless have limited the detection of other nonlinear patterns or interactions. Future studies could evaluate interpretable boosting methods, stacking ensembles, or other algorithms, with improvements judged by external discrimination, calibration, and net benefit rather than AUC alone.
Fourth, the candidate algorithms used prespecified default hyperparameters, and no systematic hyperparameter optimization was performed. The observed differences, therefore, reflect comparisons among these preset implementations and may not represent the best achievable performance of each algorithm. Future studies should combine nested cross-validation with grid, random, or Bayesian hyperparameter optimization and confirm any improvement through external validation.
Fifth, although feature selection and internal validation were used to reduce model complexity, the general-ward and ICU mortality models included only 9.3 and 9.5 training events per predictor, respectively. These ratios are close to the commonly cited lower boundary for regression modeling; therefore, overfitting, unstable estimates, and imprecise validation performance cannot be excluded. Larger independent cohorts with more mortality events are required.
Finally, SHAP improves the interpretability of fitted model predictions but cannot establish causal relationships between predictors and outcomes. The proposed models should therefore be regarded as internally validated risk-stratification tools rather than clinical decision systems. Their clinical utility and generalizability require evaluation in prospective independent cohorts.
In summary, sepsis was associated with poorer in-hospital survival in the general-ward cohort and poorer 28-day survival in the ICU cohort among patients with acute cholangitis. Three outcome- and setting-specific models were developed: a general-ward sepsis prediction model, a general-ward in-hospital mortality model, and an ICU 28-day mortality model. These models demonstrated discriminatory performance during internal validation, and SHAP helped characterize the contributions of individual predictors to the model's estimates. However, given the limited number of mortality events, retrospective design, and absence of external validation, the findings remain preliminary and potentially susceptible to overfitting. Prospective multicenter external validation is required before routine clinical implementation.
Disclosures
The authors declare that they have no competing financial or nonfinancial interests. ChatGPT (OpenAI) was used during manuscript revision to assist with language editing, grammar, clarity, and organization. It was not used to generate or analyze study data or to draw scientific conclusions independently. All AI-assisted content was critically reviewed and verified by the authors, who take full responsibility for the accuracy, integrity, and originality of the manuscript. Consent to Participate: Written informed consent was obtained from all participants or their legally authorized representatives.
Acknowledgements
Thanks to all collaborators on this paper for their data analysis and writing. Funding: This work was supported by Jiangsu Medical College's 2024 Collaborative Innovation Research Project between the School and the Local Government (202491011,202491007). Changzhou Science and Technology Bureau (CJ20239026, CJ20244028).
Materials
| Name | Company | Catalog Number | Comments |
|---|---|---|---|
| Boruta (R package) | [version/CRAN] | Feature-selection algorithm run within the training cohort | |
| glmnet / LASSO (R package) | [version/CRAN] | LASSO regression with 10-fold cross-validation for feature selection | |
| R | R Foundation for Statistical Computing | version 4.3.2 | Open-source statistical computing environment |
| SHAP implementation | [version] | Shapley Additive Explanations for model interpretation | |
| Stata | StataCorp | version 17.0 | Statistical software for conventional analyses |
| XGBoost implementation | [version] | Extreme Gradient Boosting model | |
| Xsmart Analysis platform | [version] | Machine-learning analysis platform |
References
- An Z, Braseth AL, Sahar N. Acute cholangitis: causes, diagnosis, and management. Gastroenterol Clin North Am. 2021;50:403–14.
- Gravito-Soares E, et al. Clinical applicability of Tokyo Guidelines 2018/2013 in diagnosis and severity evaluation of acute cholangitis and determination of a new severity model. Scand J Gastroenterol. 2018;53:329–34.
- Cianci P, Restini E. Management of cholelithiasis with choledocholithiasis: endoscopic and surgical approaches. World J Gastroenterol. 2021;27:4536–54.
- Lan Cheong Wah D, Christophi C, Muralidharan V. Acute cholangitis: current concepts. ANZ J Surg. 2017;87:554–59.
- Cecconi M, Evans L, Levy M, Rhodes A. Sepsis and septic shock. Lancet. 2018;392:75–87.
- Rudd KE, et al. Global, regional, and national sepsis incidence and mortality, 1990–2017: analysis for the Global Burden of Disease Study. Lancet. 2020;395:200–11.
- Xie J, et al. The epidemiology of sepsis in Chinese ICUs: a national cross-sectional survey. Crit Care Med. 2020;48:e209–e218.
- Wilkins T, Agabin E, Varghese J, Talukder A. Gallbladder dysfunction: cholecystitis, choledocholithiasis, cholangitis, and biliary dyskinesia. Prim Care. 2017;44:575–97.
- Qiu X, Lei YP, Zhou RX. SIRS, SOFA, qSOFA, and NEWS in the diagnosis of sepsis and prediction of adverse outcomes: a systematic review and meta-analysis. Expert Rev Anti Infect Ther. 2023;21:891–900.
- Knaus WA, et al. The APACHE III prognostic system: risk prediction of hospital mortality for critically ill hospitalized adults. Chest. 1991;100:1619–36.
- Pötter-Lang S, et al. Modern imaging of cholangitis. Br J Radiol. 2021;94:20210417. doi:10.1259/bjr.20210417.
- Banerjee S. Generating complex explanations for artificial intelligence models: an application to clinical data on severe mental illness. Life (Basel). 2024;14:807. doi:10.3390/life14070807.
- Karako K, Tang W. Applications of and issues with machine learning in medicine: bridging the gap with explainable AI. Biosci Trends. 2024;18:497–504.
- Beliaev AM, Zyul'korneeva S, Rowbotham D, Bergin CJ. Screening acute cholangitis patients for sepsis. ANZ J Surg. 2019;89:1457–61.
- Fathi M, Markazi-Moghaddam N, Ramezankhani A. A systematic review on risk factors associated with sepsis in patients admitted to intensive care units. Aust Crit Care. 2019;32:155–64.
- Liu Q, et al. A nomogram for predicting the risk of sepsis in patients with acute cholangitis. J Int Med Res. 2020;48:300060519866100. doi:10.1177/0300060519866100.
- Singer M, et al. The third international consensus definitions for sepsis and septic shock (Sepsis-3). JAMA. 2016;315:801–10.
- Joffre J, Hellman J, Ince C, Ait-Oufella H. Endothelial responses in sepsis. Am J Respir Crit Care Med. 2020;202:361–70.
- Mitchell E, Pearce MS, Roberts A. Gram-negative bloodstream infections and sepsis: risk factors, screening tools and surveillance. Br Med Bull. 2019;132:5–15.
- Fan S, Ma J. The value of five scoring systems in predicting the prognosis of patients with sepsis-associated acute respiratory failure. Sci Rep. 2024;14:4760. doi:10.1038/s41598-024-55257-5.
- Pérez-Fernández X, et al. Clinical variables associated with poor outcome from sepsis-associated acute kidney injury and the relationship with timing of initiation of renal replacement therapy. J Crit Care. 2017;40:154–60.
- Lambden S, Laterre PF, Levy MM, François B. The SOFA score—development, utility and challenges of accurate assessment in clinical trials. Crit Care. 2019;23:374. doi:10.1186/s13054-019-2663-7.
- Inan O, Sahiner ES, Ates I. Factors associated with clinical outcome in geriatric acute cholangitis patients. Eur Rev Med Pharmacol Sci. 2023;27:3313–21.
- Bakker J, Postelnicu R, Mukherjee V. Lactate: where are we now? Crit Care Clin. 2020;36:115–24.
- Brooks GA. The science and translation of lactate shuttle theory. Cell Metab. 2018;27:757–85.
- Salek J, Livote E, Sideridis K, Bank S. Analysis of risk factors predictive of early mortality and urgent ERCP in acute cholangitis. J Clin Gastroenterol. 2009;43:171–75.
- Schneider J, et al. Mortality risk for acute cholangitis (MAC): a risk prediction model for in-hospital mortality in patients with acute cholangitis. BMC Gastroenterol. 2016;16:15. doi:10.1186/s12876-016-0428-1.
- Lee TW, et al. Incidence, risk factors, and prognosis of acute kidney injury in hospitalized patients with acute cholangitis. PLoS One. 2022;17:e0267023. doi:10.1371/journal.pone.0267023.