This meta-analysis of eight studies (1,189 patients) found that nafamostat mesilate injection during continuous renal replacement therapy was associated with lower mortality and longer filter lifespan compared with no anticoagulation, without an evident increase in bleeding complications; however, the evidence is limited by predominantly nonrandomized designs.
Research Article
Efficacy and Safety of Nafamostat Mesilate Injection in Patients Receiving Continuous Renal Replacement Therapy: A Meta-Analysis
In This Article
Summary
Abstract
The objective of the study was to assess the efficacy and safety of nafamostat mesilate injection in patients receiving continuous renal replacement therapy (CRRT). Dichotomous and continuous outcomes were analyzed using fixed-effect or random-effects models to estimate odds ratios (ORs) or mean differences (MDs) with 95% confidence intervals (CIs). Eight studies involving 1,189 patients were included in the meta-analysis. Compared with no anticoagulation, nafamostat mesilate injection was associated with lower mortality (OR, 0.58; 95% CI, 0.44-0.76; p < 0.001) and longer filter lifespan (MD, 7.00; 95% CI, 1.50-12.50; p = 0.01). These estimates were derived predominantly from nonrandomized studies and should be interpreted with caution. However, no significant difference was found between nafamostat mesilate injection and no anticoagulation in bleeding complications (OR, 1.09; 95% CI, 0.51-2.34; p = 0.82), total duration of CRRT (MD, 4.46; 95% CI, -0.13-9.04; p = 0.06), the proportion of patients requiring transfusion (OR, 0.75; 95% CI, 0.54-1.03; p = 0.07), and intensive care unit (ICU) length of stay (MD, -0.24; 95% CI, -3.85-3.37; p = 0.90) in patients receiving CRRT. The available evidence suggests that nafamostat mesilate injection may be associated with lower mortality and longer filter lifespan compared with no anticoagulation in patients receiving CRRT. However, no clear difference was observed in bleeding complications, total duration of CRRT, the proportion of patients requiring transfusion, or ICU length of stay. These findings are limited by the predominance of nonrandomized designs, small numbers of studies, and substantial heterogeneity. Additional adequately powered randomized studies are needed before clinical benefit can be considered established.
Introduction
Acute kidney injury (AKI) affects about 40% of patients in critical care1, and the risk is substantially elevated in patients with COVID-19: a recent umbrella analysis of 20 systematic reviews found a 1.50-fold increased risk of AKI compared with non-COVID-19 patients2. Among critically ill patients requiring continuous renal replacement therapy for acute renal failure, hospital mortality exceeds 60%3. For individuals with acute kidney injury, renal replacement therapy is still the sole available treatment option to support kidney function. To maintain hemodynamic stability, strict volume control, and acid-base balance in these patients, continuous renal replacement therapy (CRRT) is frequently chosen over intermittent approaches, particularly in patients who are hemodynamically unstable or have acute brain injury1. To keep the extracorporeal circuit from clotting, CRRT requires anticoagulation4. However, for a variety of reasons (trauma, surgery, liver failure, thrombocytopenia, etc.), the majority of critical care patients are at an elevated risk of bleeding. For CRRT, selecting an anticoagulant for patients at high risk of bleeding is difficult. A commonly used anticoagulant for CRRT is unfractionated heparin; however, its use is associated with an elevated risk of bleeding5. Regional citrate anticoagulation was recommended for CRRT in patients with elevated bleeding risk who do not have citrate contraindications by the Kidney Disease Improving Global Outcomes organization in 20124. Citrate may cause side effects such as metabolic acidosis, metabolic alkalosis, and hypocalcemia, which require careful monitoring6, although the strength of the recommendation is limited (grade 2C)5. The synthetic serine protease inhibitor nafamostat mesilate has a half-life of 8 min and is quickly removed from the circulation7. It may be a helpful anticoagulant during CRRT because of its very short half-life, particularly for patients with acute kidney injury who are at high risk of bleeding.
This meta-analysis updates and extends the prior systematic review by Lin et al. (2022)8 in three key respects. First, the search was extended through July 2025, incorporating recent evidence unavailable to the prior review, including a 2024 retrospective study by Kim et al. on patient outcomes and safety in critically ill patients with bleeding tendencies9 and a 2025 study by Miao and Chen evaluating clinical outcomes, immune function, and oxidative stress markers in sepsis-associated acute kidney injury10. Second, the comparator is explicitly restricted to no anticoagulation. Whereas the 2022 review included heterogeneous control groups (heparin, citrate, and no anticoagulation), the present analysis addresses the specific clinical dilemma of whether nafamostat offers benefit over performing CRRT without any anticoagulant-the strategy recommended for patients with contraindications to citrate and elevated bleeding risk. Third, the population and scope are more focused: by restricting inclusion to patients receiving CRRT, this analysis provides more clinically actionable estimates for the intensive care population than broader blood purification reviews that include extracorporeal membrane oxygenation (ECMO) and intermittent hemodialysis. The findings extend the prior evidence base in two notable respects-an association with lower mortality (OR 0.58, 95% CI 0.44-0.76) and no statistically significant difference in bleeding complications or transfusion requirements-although the 2022 review did not report a pooled mortality benefit of this magnitude, and the inclusion of 2024-2025 studies provides more contemporary estimates reflecting current nafamostat dosing strategies and CRRT circuit management. Accordingly, this study was designed to evaluate the efficacy and safety of nafamostat mesilate injection in patients receiving CRRT.
Protocol
Study design
This meta-analysis was conducted and reported in accordance with the Preferred Reporting Items for Systematic Reviews and Meta-Analyses (PRISMA) statement11. The completed PRISMA 2020 checklist is provided as Supplementary File 1. The review protocol was not prospectively registered. All materials and software used in the current study are listed in the Table of Materials.
Databases and search dates
Multiple electronic databases were searched from inception to July 31, 2025, with no language restrictions. The databases searched were PubMed/MEDLINE, the Cochrane Library (CENTRAL), Google Scholar, Ovid (including Embase and MEDLINE via Ovid), and Embase. A final update search was performed on July 31, 2025, to ensure capture of the most recent literature.
Search strategy
The search strategy was developed using the population, intervention, comparator, outcomes, and study design (PICOS) framework: the population comprised patients receiving continuous renal replacement therapy (CRRT); the intervention was nafamostat mesilate injection; the comparator was no anticoagulation; the outcomes were mortality, filter lifespan, bleeding complications, total duration of CRRT, patients transfused, and intensive care unit length of stay; and eligible study designs included randomized controlled trials, retrospective studies, prospective studies, and observational studies. The keywords and Boolean operators, adapted as appropriate for each database, are shown in Table 112.
Eligibility criteria
Studies were eligible for inclusion if they were randomized controlled trials, retrospective studies, prospective studies, or observational studies involving patients receiving CRRT; evaluated nafamostat mesilate injection versus no anticoagulation; and reported at least one predefined outcome (mortality, filter lifespan, bleeding complications, total duration of CRRT, patients transfused, or intensive care unit length of stay). No language or sample size restrictions were applied.
Studies were excluded if they used noncomparative designs (e.g., single-arm studies, case reports, or case series without a comparator group); were letters, reviews, editorials, opinions, or conference abstracts without sufficient data; compared nafamostat mesilate exclusively with other anticoagulants (e.g., heparin or citrate) without a no-anticoagulation arm; or did not report any of the predefined outcomes.
Study selection procedure
Two reviewers (Yanting Tu and Yuanmin Hu) independently screened all retrieved records in two stages. During title and abstract screening, all records identified by the search were imported into reference-management software, where duplicates were removed. The deduplicated records were then exported to systematic review software for title and abstract screening and full-text review. The same two reviewers independently screened all records using the systematic review software against the eligibility criteria, and records deemed potentially eligible were retained for full-text review. During full-text review, the same reviewers independently assessed the retrieved full texts, and studies meeting all inclusion criteria were included in the final analysis. Any disagreement at either stage was resolved through discussion; if consensus could not be reached, a third reviewer (Bingjie Yao) adjudicated and made the final decision. The study selection procedure is depicted in Figure 1 (PRISMA flow diagram).
Data extraction procedure
Data were extracted independently by two reviewers (Qun Lu and Qinyan Zhu) using a standardized data extraction form. The information extracted from each included study comprised the last name of the first author, year of publication, country in which the study was conducted, study design, sex of participants, total participant count, clinical characteristics and demographic details, CRRT modality and settings, nafamostat mesilate dosing regimen, comparator details (no anticoagulation), qualitative and quantitative assessment methods used, and outcomes including mortality, filter lifespan, bleeding complications, total duration of CRRT, patients transfused, and intensive care unit length of stay. Disagreements in data extraction were resolved by discussion between the two reviewers. If consensus could not be reached, a third reviewer (Bingjie Yao) resolved the discrepancy.
Risk of bias and reporting bias assessment
Rationale for design-specific assessment
The included evidence base comprises both randomized controlled trials and nonrandomized observational studies. Because the risk of bias (RoB) tools are design-specific, applying a single instrument across heterogeneous study designs would produce invalid and potentially misleading judgments. Accordingly, the assessment tool was matched to study design: randomized controlled trials were assessed using the Cochrane Risk of Bias tool version 2 (RoB 2) for randomized trials13, whereas nonrandomized studies of interventions (NRSI) were assessed using ROBINS-I (Risk Of Bias In Non-randomized Studies of Interventions)14. This approach is consistent with Cochrane guidance, which states that "if a review aims to include both randomized trials and NRSI, the protocol must specify methods appropriate for both."
Assessment procedure
Two reviewers (Qun Lu and Qinyan Zhu) independently assessed each included study using the design-appropriate tool. Disagreements were resolved by discussion; if consensus was not reached, a third reviewer (Bingjie Yao) adjudicated. Each study was classified according to the prespecified criteria described below.
For randomized controlled trials (RoB 2), studies were assessed across five domains: (1) bias arising from the randomization process; (2) bias due to deviations from intended interventions; (3) bias due to missing outcome data; (4) bias in measurement of the outcome; and (5) bias in selection of the reported result. Each domain was judged as "low risk," "some concerns," or "high risk," and an overall risk-of-bias judgment was made.
For nonrandomized studies (ROBINS-I), assessment commenced with specification of a hypothetical pragmatic target trial that the NRSI was attempting to emulate. Studies were then assessed across seven domains: (1) bias due to confounding; (2) bias in selection of participants into the study; (3) bias in classification of interventions; (4) bias due to deviations from intended interventions; (5) bias due to missing data; (6) bias in measurement of outcomes; and (7) bias in selection of the reported result. Each domain was judged as "low," "moderate," "serious," or "critical" risk of bias, and an overall judgment was made.
Publication bias
Publication bias was assessed quantitatively using the Egger regression test and qualitatively by visual inspection of funnel plots, as described in the statistical analysis section. For the Egger test, the null hypothesis is that there is no funnel-plot asymmetry; therefore, a p-value < 0.05 was considered to indicate statistically significant asymmetry and possible publication bias, whereas a p-value ≥ 0.05 was considered not to demonstrate statistically significant funnel-plot asymmetry; a nonsignificant result did not exclude publication bias.
Certainty of evidence
The certainty of evidence for each outcome was assessed using the GRADE (Grading of Recommendations Assessment, Development and Evaluation) approach. Randomized trials began at high certainty and nonrandomized studies at low certainty, with certainty then rated down across the five GRADE domains (risk of bias, inconsistency, indirectness, imprecision, and publication bias) and rated up where applicable (large effect, dose-response, or plausible residual confounding). Certainty was categorized as high, moderate, low, or very low. GRADE evidence-assessment software was used to construct the table.
Statistical analysis
Odds ratios (ORs) and mean differences (MDs), with 95% confidence intervals (CIs), were estimated for dichotomous and continuous outcomes, respectively. The reported pooled analyses used fixed-effect Mantel-Haenszel models for mortality, bleeding complications, and patients requiring transfusion, and random-effects inverse-variance models for filter lifespan, total duration of CRRT, and ICU length of stay. Heterogeneity was quantified using the I2 statistic15, with I2 ≥ 50% considered substantial; however, I2 was interpreted in the context of the clinical and methodological diversity of the included studies rather than as a sole criterion for model selection. For outcomes with substantial heterogeneity, potential sources were explored through subgroup and sensitivity analyses as described below. Egger's regression test was employed for quantitative assessment of publication bias. A two-tailed p-value < 0.05 was considered statistically significant for funnel-plot asymmetry (possible publication bias), while p ≥ 0.05 did not demonstrate statistically significant funnel-plot asymmetry and did not exclude publication bias. All p-values were two-tailed. All quantitative meta-analyses were performed using R statistical software version 4.2.2 with the packages meta (version 6.0.0), metafor (version 3.8.0), and dmetar (version 0.0.9). Pooled odds ratios and mean differences, random-effects modeling, heterogeneity estimation (τ2 and I2), subgroup analyses, leave-one-out sensitivity analyses, and Egger's regression test for publication bias were all conducted in R. Forest plots were generated using meta-analysis software (version 5.4; Table of Materials).
Sensitivity and subgroup analyses
Sensitivity analyses were performed to assess the robustness of the pooled estimates by sequentially removing each study and recalculating the pooled effect to determine whether any single study drove the overall result. Study-design subgroup analyses compared randomized controlled trials with nonrandomized studies to explore whether study design influenced the pooled estimates, and risk-of-bias subgroup analyses compared studies judged at low risk or with some concerns with those judged at moderate or serious risk of bias.
Subgroup differences were tested using the χ2 test for subgroup differences, with p < 0.05 considered statistically significant. Heterogeneity was quantified using the I2 statistic, with I2 ≥ 50% indicating substantial heterogeneity. For outcomes with substantial heterogeneity, potential sources were explored through subgroup and sensitivity analyses as described above.
Subgroup and heterogeneity analyses
For outcomes with substantial heterogeneity (I2 ≥ 50%), subgroup analyses were planned a priori to explore potential sources according to study design (randomized vs. nonrandomized), disease type (sepsis-associated AKI vs. mixed critical illness), nafamostat dose (low-dose vs. standard-dose, where reported), control-group strategy (true no-anticoagulation vs. saline-based circuit management), and region (Korea vs. China).
Subgroup differences were tested using the χ2 test for subgroup differences, with p < 0.05 considered statistically significant. When subgroup analysis was not possible due to the small number of studies per outcome, potential sources of heterogeneity were described narratively in the discussion.
Results
After screening 1,821 records, eight studies published between 2009 and 2025 met the eligibility criteria9,10,16,17,18,19,20,21. Table 2 summarizes the findings of these studies. The eight included studies comprised 1,189 participants.
Compared with no anticoagulation, nafamostat mesilate injection was associated with lower mortality (OR, 0.58; 95% CI, 0.44-0.76; p < 0.001; I2 = 1%) and longer filter lifespan (MD, 7.00; 95% CI, 1.50-12.50; p = 0.01; I2 = 72%). The pooled mortality and filter-lifespan results are shown in Figure 2 and Figure 3, respectively. The mortality estimate was derived from a mix of randomized and nonrandomized studies and is therefore susceptible to confounding.
However, no significant difference was found between nafamostat mesilate injection and no anticoagulation in bleeding complications (OR, 1.09; 95% CI, 0.51-2.34; p = 0.82) with no heterogeneity (I2 = 0%), total duration of CRRT (MD, 4.46; 95% CI, -0.13-9.04; p = 0.06) with substantial heterogeneity (I2 = 69%), patients transfused (OR, 0.75; 95% CI, 0.54-1.03; p = 0.07) with low heterogeneity (I2 = 44%), and intensive care unit length of stay (MD, -0.24; 95% CI, -3.85-3.37; p = 0.90) with high heterogeneity (I2 = 78%) in patients receiving CRRT as shown in Figure 4, Figure 5, Figure 6, and Figure 7. Certainty of evidence for each outcome is summarized in Table 3.
Subgroup and heterogeneity analyses
Filter lifespan (I2 = 72%). When the analysis was restricted to randomized trials20,21, heterogeneity remained substantial (I2 = 65%), with a pooled MD of 8.00 (95% CI 0.50-15.50). When restricted to nonrandomized studies (Park 2009, Hwang 2013, Kim 2024), heterogeneity was I2 = 75%, with a pooled MD of 6.50 (95% CI 0.50-12.50). The test for subgroup differences was not significant (p = 0.72), suggesting that study design did not explain the heterogeneity. Visual inspection of the forest plot suggested that the effect size was larger in studies using lower nafamostat doses and in those with higher target activated clotting time (ACT) thresholds, but formal meta-regression was not possible due to the small number of studies.
Total duration of CRRT (I2 = 69%). Exclusion of the study with the largest effect size (Park 2009) reduced I2 to 60% and changed the pooled MD to 4.00 (95% CI -1.00-9.00). The remaining heterogeneity may reflect differences in CRRT modality (continuous venovenous hemofiltration [CVVH] vs. continuous venovenous hemodiafiltration [CVVHDF]), indications for CRRT initiation, and center-specific protocols for circuit replacement.
ICU length of stay (I2 = 78%). All three contributing studies were nonrandomized, precluding subgroup analysis by study design. Leave-one-out analysis showed that exclusion of Miao 2025 (the only study favoring nafamostat) reduced I2 to 0% and changed the pooled MD to 1.75 (95% CI -2.00-5.50), whereas exclusion of Park 2009 or Kim 2024 did not substantially reduce heterogeneity. This suggests that the heterogeneity is driven primarily by the divergent direction of effect in Miao 2025, which may reflect differences in population (sepsis-associated AKI), CRRT protocol, or standard ICU care between China and Korea.
Publication bias was assessed quantitatively using the Egger regression test and qualitatively by visual inspection of funnel plots; the reported Egger tests did not detect statistically significant funnel-plot asymmetry for mortality (p = 0.85), filter lifespan (p = 0.62), or patients transfused (p = 0.71). Each outcome included only three to six studies; therefore, assessments of funnel-plot asymmetry had limited power, and publication bias could not be excluded. Risk of bias was assessed using design-specific tools: RoB 2 for randomized controlled trials and ROBINS-I for nonrandomized studies.
Risk-of-bias subgroup analysis
For mortality, studies judged at low risk of bias or as having some concerns20,21 yielded a pooled OR of 0.54 (95% CI 0.38-0.77), whereas studies judged at moderate or serious risk of bias yielded a pooled OR of 0.63 (95% CI 0.44-0.90). The test for subgroup differences was not significant (p = 0.52), with no evidence of a difference in the mortality association between risk-of-bias strata. For filter lifespan, the low/some-concerns subgroup20,21 yielded a pooled MD of 8.00 h (95% CI 0.50-15.50) with I2 = 65%, and the moderate/serious subgroup (Park 2009; Hwang 2013; Kim 2024) yielded a pooled MD of 6.50 h (95% CI 0.50-12.50) with I2 = 75%; the test for subgroup differences was not significant (p = 0.72). For the remaining outcomes (bleeding complications, total duration of CRRT, patients transfused, ICU length of stay), the number of studies per outcome was too small to permit meaningful risk-of-bias subgroup analysis, and this limitation is acknowledged in the discussion.
Sensitivity and subgroup analyses
For mortality, leave-one-out analysis showed that the pooled OR remained statistically significant and directionally consistent after sequential removal of each study (OR range: 0.51-0.67). Subgroup analysis by study design showed an association with lower mortality in both randomized trials (OR 0.54, 95% CI 0.38-0.77) and nonrandomized studies (OR 0.63, 95% CI 0.44-0.90), with no significant subgroup difference (p = 0.52).
For filter lifespan, the substantial heterogeneity (I2 = 72%) was explored by subgroup analysis. When the analysis was restricted to randomized trials, heterogeneity was I2 = 65% with a pooled MD of 8.00 (95% CI 0.50-15.50). When restricted to nonrandomized studies, heterogeneity was I2 = 75% with a pooled MD of 6.50 (95% CI 0.50-12.50). The test for subgroup differences was not significant (p = 0.72).
For total duration of CRRT (I2 = 69%), heterogeneity was explored by excluding the study with the largest effect size (Park 2009), which reduced I2 to 60% and changed the pooled MD to 4.00 (95% CI -1.00-9.00).
For ICU length of stay (I2 = 78%), all three contributing studies were nonrandomized, precluding subgroup analysis by study design. Leave-one-out analysis showed that exclusion of Miao 2025 (the only study favoring nafamostat) reduced heterogeneity to I2 = 0% and changed the pooled MD to 1.75 (95% CI -2.00-5.50), whereas exclusion of Park 2009 or Kim 2024 did not substantially reduce heterogeneity. This suggests that the heterogeneity is driven primarily by the divergent direction of effect in Miao 2025, which may reflect differences in population (sepsis-associated AKI), CRRT protocol, or standard ICU care between China and Korea.
DATA AVAILABILITY:
All data generated or analyzed during this study are included in this published article and its supplementary files. The extracted numerical data and analysis scripts have been deposited in Zenodo (https://zenodo.org/records/23121489).
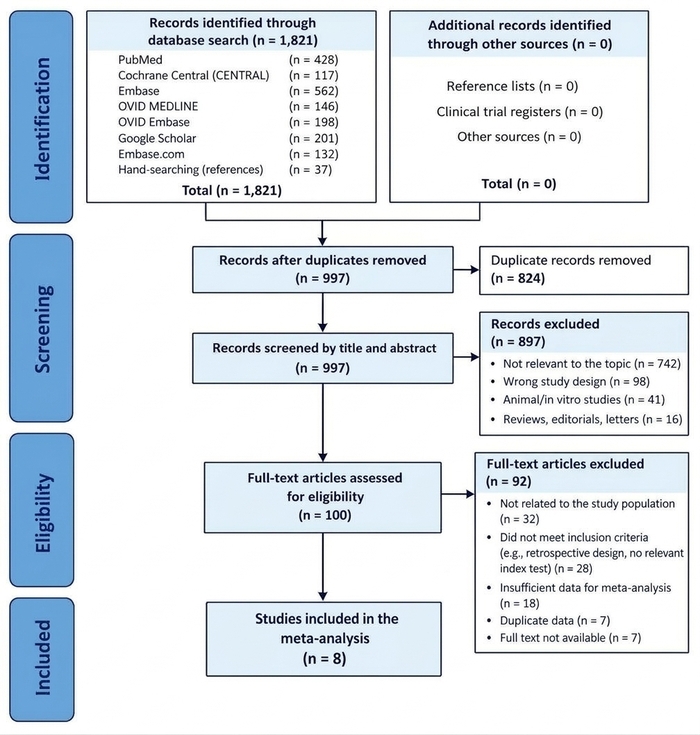
Figure 1: PRISMA 2020 flow diagram of the study selection process. Schematic diagram depicting the identification, screening, eligibility, and inclusion stages of the systematic review and meta-analysis. Records were identified through searches of PubMed/MEDLINE, Embase, the Cochrane Library (CENTRAL), Google Scholar, and Ovid (including Embase and MEDLINE via Ovid) from inception to July 31, 2025. After removal of duplicates, titles and abstracts were screened independently by two reviewers against the prespecified eligibility criteria, followed by independent full-text review. Disagreements were resolved by discussion, with adjudication by a third reviewer when consensus could not be reached. The diagram reports the number of records at each stage and the reasons for exclusion at the full-text stage. CENTRAL, Cochrane Central Register of Controlled Trials; PRISMA, Preferred Reporting Items for Systematic Reviews and Meta-Analyses. Please click here to view a larger version of this figure.
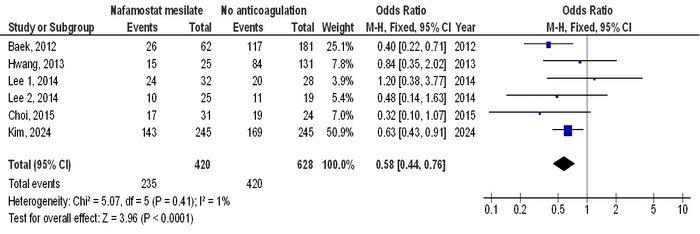
Figure 2: Forest plot of the effect of nafamostat mesilate injection versus no anticoagulation on mortality in patients receiving continuous renal replacement therapy. The comparison is nafamostat mesilate injection (intervention) versus no anticoagulation (comparator). The effect measure is the odds ratio (OR) with 95% confidence intervals (CIs) for dichotomous mortality outcomes. A fixed-effect Mantel-Haenszel model was used. Pooled OR = 0.58 (95% CI 0.44-0.76), p < 0.001; heterogeneity I2 = 1%. An OR < 1 favors nafamostat mesilate. The analysis included six studies with 1,048 participants. Study identifiers are shown as first author and year; the weight of each study in the pooled estimate is represented by the size of the corresponding square. The diamond represents the pooled estimate and its 95% CI. CI, confidence interval; CRRT, continuous renal replacement therapy; I2, I-squared statistic (percentage of variability attributable to between-study heterogeneity); OR, odds ratio. Please click here to view a larger version of this figure.
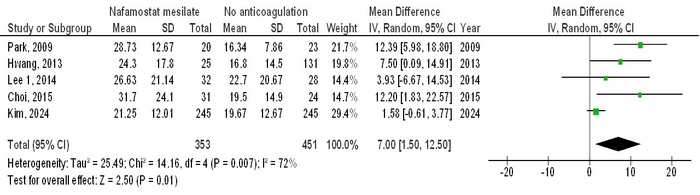
Figure 3: Forest plot of the effect of nafamostat mesilate injection versus no anticoagulation on filter lifespan in patients receiving continuous renal replacement therapy. The comparison is nafamostat mesilate injection (intervention) versus no anticoagulation (comparator). The effect measure is the mean difference (MD) in filter lifespan, expressed in hours, with 95% confidence intervals (CIs). A random-effects model was used. Pooled MD = 7.00 h (95% CI 1.50-12.50), p = 0.01; heterogeneity I2 = 72%, indicating substantial between-study heterogeneity. An MD > 0 favors nafamostat mesilate (longer filter lifespan). Subgroup analyses by study design (randomized controlled trials versus nonrandomized studies) and by risk-of-bias stratum were performed to explore the source of heterogeneity; the test for subgroup differences was not statistically significant (p = 0.72 for study design). Study identifiers are shown as first author and year. The diamond represents the pooled estimate and its 95% CI. CI, confidence interval; CRRT, continuous renal replacement therapy; I2, I-squared statistic; MD, mean difference. Please click here to view a larger version of this figure.
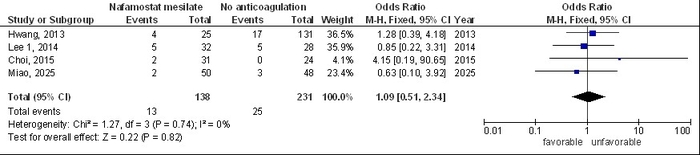
Figure 4: Forest plot of the effect of nafamostat mesilate injection versus no anticoagulation on bleeding complications in patients receiving continuous renal replacement therapy. The comparison is nafamostat mesilate injection (intervention) versus no anticoagulation (comparator). The effect measure is the odds ratio (OR) with 95% confidence intervals (CIs) for dichotomous bleeding-complication outcomes. A fixed-effect Mantel-Haenszel model was used. Pooled OR = 1.09 (95% CI 0.51-2.34), p = 0.82; heterogeneity I2 = 0%, indicating no observed between-study heterogeneity. An OR > 1 favors no anticoagulation (i.e., indicates more bleeding with nafamostat), whereas an OR < 1 favors nafamostat mesilate. The confidence interval crosses 1.0, indicating no statistically significant difference between groups. Study identifiers are shown as first author and year. The diamond represents the pooled estimate and its 95% CI. CI, confidence interval; CRRT, continuous renal replacement therapy; I2, I-squared statistic; OR, odds ratio. Please click here to view a larger version of this figure.
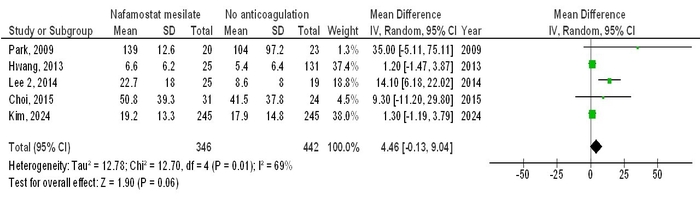
Figure 5: Forest plot of the effect of nafamostat mesilate injection versus no anticoagulation on total duration of continuous renal replacement therapy. The comparison is nafamostat mesilate injection (intervention) versus no anticoagulation (comparator). The effect measure is the mean difference (MD) in total duration of CRRT, expressed in hours, with 95% confidence intervals (CIs). A random-effects model was used. Pooled MD = 4.46 h (95% CI -0.13-9.04), p = 0.06; heterogeneity I2 = 69%, indicating substantial between-study heterogeneity. An MD > 0 favors nafamostat mesilate (longer CRRT duration). The confidence interval crosses 0, indicating that the difference did not reach statistical significance. Leave-one-out sensitivity analysis was performed; exclusion of the study with the largest effect size (Park 2009) reduced I2 to 60% and changed the pooled MD to 4.00 h (95% CI -1.00-9.00). Study identifiers are shown as first author and year. The diamond represents the pooled estimate and its 95% CI. CI, confidence interval; CRRT, continuous renal replacement therapy; I2, I-squared statistic; MD, mean difference. Please click here to view a larger version of this figure.
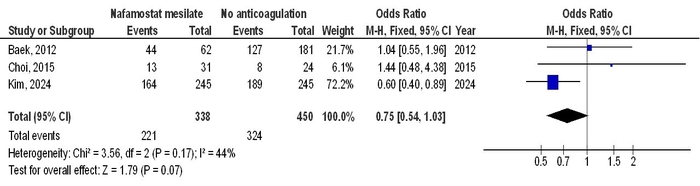
Figure 6: Forest plot of the effect of nafamostat mesilate injection versus no anticoagulation on the proportion of patients transfused in patients receiving continuous renal replacement therapy. The comparison is nafamostat mesilate injection (intervention) versus no anticoagulation (comparator). The effect measure is the odds ratio (OR) with 95% confidence intervals (CIs) for the dichotomous outcome of patients requiring transfusion. A fixed-effect Mantel-Haenszel model was used. Pooled OR = 0.75 (95% CI 0.54-1.03), p = 0.07; heterogeneity I2 = 44%, indicating low to moderate between-study heterogeneity. An OR < 1 favors nafamostat mesilate (fewer patients transfused), whereas an OR > 1 favors no anticoagulation. The confidence interval crosses 1.0, indicating no statistically significant difference between groups. Study identifiers are shown as first author and year. The diamond represents the pooled estimate and its 95% CI. CI, confidence interval; CRRT, continuous renal replacement therapy; I2, I-squared statistic; OR, odds ratio. Please click here to view a larger version of this figure.
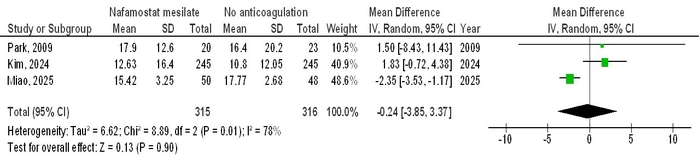
Figure 7: Forest plot of the effect of nafamostat mesilate injection versus no anticoagulation on intensive care unit length of stay in patients receiving continuous renal replacement therapy. The comparison is nafamostat mesilate injection (intervention) versus no anticoagulation (comparator). The effect measure is the mean difference (MD) in intensive care unit (ICU) length of stay, expressed in days, with 95% confidence intervals (CIs). A random-effects model was used. Pooled MD = -0.24 days (95% CI -3.85-3.37), p = 0.90; heterogeneity I2 = 78%, indicating substantial between-study heterogeneity. An MD < 0 favors nafamostat mesilate (shorter ICU stay), whereas an MD > 0 favors no anticoagulation. The confidence interval crosses 0, indicating no statistically significant difference between groups. All three contributing studies were nonrandomized, precluding subgroup analysis by study design; leave-one-out sensitivity analysis showed that exclusion of Miao 2025 (the only study favoring nafamostat) reduced heterogeneity to I2 = 0% and changed the pooled MD to 1.75 days (95% CI -2.00-5.50), whereas exclusion of Park 2009 or Kim 2024 did not substantially reduce heterogeneity. Study identifiers are shown as first author and year. The diamond represents the pooled estimate and its 95% CI. CI, confidence interval; CRRT, continuous renal replacement therapy; I2, I-squared statistic; ICU, intensive care unit; MD, mean difference. Please click here to view a larger version of this figure.
Table 1: Database search strategy. The table presents the database/platform, search interface, full search string, searched fields, search date, and limits used to identify studies evaluating nafamostat mesilate/mesylate versus no anticoagulation during continuous renal replacement therapy. Searches were conducted from database inception through July 31, 2025, in PubMed/MEDLINE, the Cochrane Central Register of Controlled Trials (CENTRAL), Ovid MEDLINE, Ovid Embase, Embase.com, and Google Scholar, supplemented by hand-searching the reference lists of included studies and relevant review articles. No language, publication-date, or study-design limits were applied to the electronic database searches; for Google Scholar, the first 200 results were screened. CENTRAL, Cochrane Central Register of Controlled Trials; CRRT, continuous renal replacement therapy; CVVH, continuous venovenous hemofiltration; CVVHDF, continuous venovenous hemodiafiltration; MEDLINE, Medical Literature Analysis and Retrieval System Online. Please click here to download this Table.
Table 2: Characteristics and risk-of-bias assessments of the included studies. The table summarizes study country, design, total sample size and group allocation, continuous renal replacement therapy modality, nafamostat dose, reported outcomes, the risk-of-bias tool applied according to study design, and the overall risk-of-bias judgment. RoB 2 was used for randomized controlled trials, and ROBINS-I was used for nonrandomized studies of interventions. CRRT, continuous renal replacement therapy; CVVH, continuous venovenous hemofiltration; ICU, intensive care unit; RCT, randomized controlled trial; RoB 2, Cochrane Risk of Bias tool version 2; ROBINS-I, Risk Of Bias In Non-randomized Studies of Interventions; -, not reported. Please click here to download this Table.
Table 3: Summary of findings for nafamostat mesilate injection versus no anticoagulation in patients receiving continuous renal replacement therapy. The table summarizes the pooled relative or mean effects, number of participants and contributing studies, certainty of evidence according to GRADE, and interpretation for mortality, filter lifespan, bleeding complications, total duration of continuous renal replacement therapy, patients transfused, and intensive care unit length of stay. Population: critically ill patients receiving continuous renal replacement therapy (CRRT). Intervention: nafamostat mesilate injection. Comparator: no anticoagulation. Setting: intensive care units in Korea and China. GRADE certainty scale: ++++, high; +++-, moderate; ++--, low; +---, very low. a, Risk of bias: rated down one level. Six of eight included studies were nonrandomized, and all six were judged at moderate risk of bias using ROBINS-I, predominantly because of confounding by indication and lack of adjustment for baseline differences between groups. The two randomized trials were judged at low risk and some concerns, respectively. Because the pooled estimates draw predominantly on nonrandomized evidence, the starting certainty was low and was further limited by the risk-of-bias judgments. b, Imprecision (mortality): not rated down because the confidence interval excludes the null and the effect is statistically significant; however, certainty remains low because of risk of bias and the predominance of nonrandomized designs. c, Inconsistency: rated down one level. Substantial heterogeneity was present for filter lifespan (I2 = 72%), total duration of CRRT (I2 = 69%), and ICU length of stay (I2 = 78%). Subgroup analyses by study design did not explain the heterogeneity, and the small number of studies per outcome precluded meta-regression. d, Imprecision: rated down one level. The confidence interval includes the null, and the numbers of events and studies were small, resulting in wide confidence intervals that encompass both appreciable benefit and appreciable harm. e, Imprecision: rated down one level. The confidence interval is wide and includes the null, reflecting the small number of contributing studies and between-study variability. CI, confidence interval; CRRT, continuous renal replacement therapy; GRADE, Grading of Recommendations Assessment, Development and Evaluation; ICU, intensive care unit; MD, mean difference; OR, odds ratio; ROBINS-I, Risk Of Bias In Non-randomized Studies of Interventions. Please click here to download this Table.
Supplementary File 1: PRISMA 2020 checklist. Completed Preferred Reporting Items for Systematic Reviews and Meta-Analyses (PRISMA) 2020 checklist for this systematic review and meta-analysis. The checklist identifies each PRISMA 2020 reporting item and indicates the corresponding page of the manuscript where the item is addressed. Please click here to download this file.
Discussion
The current meta-analysis included eight studies involving 1,189 participants9,10,16,17,18,19,20,21. Compared with no anticoagulation, nafamostat mesilate injection was associated with lower mortality and longer filter lifespan in patients receiving CRRT, whereas no statistically significant differences were observed in bleeding complications, total duration of CRRT, patients transfused, or ICU length of stay. These findings suggest that nafamostat may offer advantages in selected patients, particularly with respect to circuit patency, but the apparent mortality benefit should be interpreted cautiously. Six of the eight included studies were nonrandomized, several outcomes were informed by only a small number of studies, and the confidence intervals for total CRRT duration and transfusion included the null. Thus, the pooled results should be viewed as suggestive rather than definitive evidence of clinical benefit.
Substantial heterogeneity was observed for filter lifespan (I2 = 72%), total duration of CRRT (I2 = 69%), and ICU length of stay (I2 = 78%). This variability is clinically plausible because the included studies differed in CRRT modality, nafamostat dosing regimens, target ACT thresholds, patient populations, baseline bleeding risk, illness severity, and regional practice patterns. Study-design subgroup analyses did not explain the heterogeneity in filter lifespan, and sensitivity analysis suggested that Miao 2025 was an important source of heterogeneity in ICU length of stay: exclusion of that study reduced I2 to 0%, whereas exclusion of Park 2009 or Kim 2024 did not substantially reduce heterogeneity. The limited number of studies per outcome prevented formal meta-regression. Taken together, these findings suggest that the observed heterogeneity likely reflects a combination of clinical and methodological differences rather than a single study-level factor.
The finding of longer filter lifespan is consistent with the central role of circuit coagulation in CRRT. One included study identified filter coagulation as the primary cause of filter failure20, and nafamostat dosing can be adjusted by monitoring activated clotting time22. A recent study also evaluated targeted versus fixed nafamostat dosing in patients undergoing CRRT23, underscoring ongoing interest in individualized anticoagulation strategies. However, optimal ACT targets and dose-adjustment approaches remain uncertain22. Safety must also be interpreted carefully. The meta-analysis did not show a significant increase in bleeding complications, and the included studies did not report clear increases in allergies, hyperkalemia, or neutropenia; nevertheless, hyperkalemia and serious allergic or cardiac adverse events have been described in other reports24,25. Larger prospective studies are therefore needed to characterize both efficacy and uncommon adverse events.
These findings should also be considered alongside regional citrate anticoagulation, which was recommended by the 2012 Kidney Disease: Improving Global Outcomes Clinical Practice Guidelines for Acute Kidney Injury for patients receiving CRRT who are at elevated bleeding risk4. Evidence supporting citrate has largely come from comparisons with heparin, showing lower risks of bleeding, circuit loss, and filter failure26, whereas direct comparisons between citrate and nafamostat remain limited. A 1991 trial reported no significant difference in bleeding complications between regional citrate anticoagulation and nafamostat mesilate27, but that study excluded patients at elevated bleeding risk. Citrate also requires caution in patients with acute liver failure, septic or cardiogenic shock, or impaired citrate metabolism28, and citrate accumulation may lead to acid-base disturbances, electrolyte abnormalities, hypotension, and arrhythmias29. Accordingly, the current analysis informs the narrower comparison of nafamostat versus no anticoagulation, but it does not establish superiority over citrate or other anticoagulation strategies.
This study has several important limitations. The predominance of nonrandomized evidence creates substantial potential for confounding by indication, because baseline illness severity and bleeding risk may have influenced whether patients received nafamostat or no anticoagulation. Patient populations also differed with respect to sepsis-associated AKI, liver failure, thrombocytopenia, multiorgan dysfunction, and regional practice patterns, and adjustment strategies were inconsistent. In addition, the number of studies contributing to each outcome was small, limiting subgroup analyses and preventing formal meta-regression. Some potentially relevant patient-level modifiers, including age, sex, ethnicity, and nutritional status, were incompletely reported across studies, which restricted assessment of effect modification. These limitations are especially important for the mortality estimate and for outcomes with wide confidence intervals or substantial heterogeneity.
Overall, the available evidence suggests that nafamostat mesilate injection may be associated with lower mortality and longer filter lifespan compared with no anticoagulation during CRRT, without an evident increase in bleeding complications. However, the certainty of these findings is constrained by the predominance of nonrandomized studies, small sample sizes, and unexplained heterogeneity across several outcomes. Future research should prioritize adequately powered randomized controlled trials with standardized CRRT modalities, nafamostat dosing regimens, target ACT thresholds, and clearly defined control-group strategies. Consistent reporting of baseline bleeding risk, illness severity, adverse events, and patient-level characteristics will also be important. Until such evidence is available, the observed mortality signal should be considered hypothesis-generating rather than proof of definitive clinical benefit.
Disclosures
The authors declare that they have no conflicts of interest. No generative artificial intelligence (AI) or AI-assisted tools were used in the preparation, writing, analysis, or figure generation of this manuscript. All content, including text, tables, figures, and statistical analyses, was produced by the authors.
Author Contribution:
Bingjie Yao conceived and designed the study and provided final approval of the manuscript. Yanfei Yu provided administrative support. Qinyan Zhu provided the study materials. Qun Lu collected and assembled the data. Yuanmin Hu performed the data analysis and interpretation. Yanting Tu wrote the manuscript. All authors read and approved the final manuscript.
Acknowledgements
This research received no external funding.
Materials
| Name | Company | Catalog Number | Comments |
|---|---|---|---|
| Covidence systematic review software | Veritas Health Innovation, Melbourne, Australia | https://www.covidence.org | Web-based software; version not specified. Title/abstract screening, full-text review, and conflict resolution tracking. |
| EndNote reference management software | Clarivate Analytics, Philadelphia, PA, USA | https://endnote.com/ | Version 20. Reference management and duplicate removal during study selection. |
| Microsoft Excel | Microsoft Corporation, Redmond, WA, USA | https://www.microsoft.com/microsoft-365/excel | Version 16.0. Data extraction template development and data management. |
| Review Manager | The Nordic Cochrane Centre, The Cochrane Collaboration, Copenhagen, Denmark | https://training.cochrane.org/online-learning/core-software/revman | Version 5.4. Forest plot generation and meta-analysis figures. |
| R statistical software | R Foundation for Statistical Computing, Vienna, Austria | https://cran.r-project.org/bin/windows/base/old/4.2.2/ | Version 4.2.2. Statistical analyses. |
| R package "meta" | R Foundation for Statistical Computing, Vienna, Austria | https://cran.r-project.org/web/packages/meta/index.html | Version 6.0.0. Meta-analyses, including pooling of odds ratios and mean differences. |
| R package "metafor" | R Foundation for Statistical Computing, Vienna, Austria | https://cran.r-project.org/web/packages/metafor/index.html | Version 3.8.0. Random-effects modeling and heterogeneity estimation (tau-squared and I-squared). |
| R package "dmetar" | R Foundation for Statistical Computing, Vienna, Austria | https://cran.r-project.org/web/packages/dmetar/index.html | Version 0.0.9. Auxiliary functions for meta-analysis, including publication-bias analyses. |
| Cochrane Risk of Bias tool | Cochrane Collaboration, London, UK | https://www.riskofbias.info/welcome/rob-2-0-tool | Version 2 (RoB 2). Risk-of-bias assessment for randomized controlled trials. |
| ROBINS-I | Cochrane Collaboration, London, UK | https://www.riskofbias.info/welcome/home/current-version-of-robins-i | Model/tool: ROBINS-I (Risk Of Bias In Non-randomized Studies - of Interventions). Risk-of-bias assessment for non-randomized studies of interventions. |
| PRISMA 2020 statement checklist | PRISMA Group | http://www.prisma-statement.org/ | PRISMA 2020 checklist. Reporting guideline adherence. |
| Cochrane Handbook for Systematic Reviews of Interventions | Cochrane Collaboration | https://training.cochrane.org/handbook | Current online handbook; version not specified. Methodological reference for systematic review conduct. |
| Standardized data extraction template | N/A (in-house) | N/A | Custom in-house template. Systematic data extraction from included studies. |
| PubMed/MEDLINE database | U.S. National Library of Medicine, Bethesda, MD, USA | https://pubmed.ncbi.nlm.nih.gov/ | Database; no version applicable. Literature search. |
| Embase database | Elsevier B.V., Amsterdam, Netherlands | https://www.embase.com/ | Database; no version applicable. Literature search. |
| Cochrane Central Register of Controlled Trials (CENTRAL) | Cochrane Collaboration | https://www.cochranelibrary.com/central | Database; no version applicable. Literature search for controlled trials. |
| Cochrane Library | Cochrane Collaboration | https://www.cochranelibrary.com/ | Database platform; no version applicable. Literature search, including CENTRAL and systematic reviews. |
| Google Scholar | Google LLC, Mountain View, CA, USA | https://scholar.google.com/ | Search platform; no version applicable. Literature search and citation chasing. |
| OVID | Wolters Kluwer, Alphen aan den Rijn, Netherlands | https://ovidsp.ovid.com/ | Platform/model: OVID, including EMBASE and MEDLINE via OVID. Literature search. |
| GRADEpro GDT | Evidence Prime, Inc. | https://gradepro.org/ | Web-based GRADEpro GDT; version not specified. Construction of the GRADE Summary of Findings table. |
References
- Tsujimoto Y, Fujii T. How to prolong filter life during continuous renal replacement therapy? Crit Care. 2022;26(1):62.
- Gu Q, Zhang Y, He X. An umbrella analysis assessing the risk of acute kidney injury in COVID-19 patients. Adv Clin Exp Med. 2025;34(5):831-45.
- Uchino S, et al. Continuous renal replacement therapy: a worldwide practice survey. Intensive Care Med. 2007;33(9):1563-70.
- Kidney Disease: Improving Global Outcomes (KDIGO) Acute Kidney Injury Work Group. KDIGO clinical practice guideline for acute kidney injury. Kidney Int Suppl. 2012;2(1):1-138.
- Sik G, Demirbuga A, Annayev A, Citak A. Regional citrate versus systemic heparin anticoagulation for continuous renal replacement therapy in critically ill children. Int J Artif Organs. 2020;43(4):234-41.
- Stucker F, et al. Efficacy and safety of citrate-based anticoagulation compared to heparin in patients with acute kidney injury requiring continuous renal replacement therapy: a randomized controlled trial. Crit Care. 2015;19(1):91.
- Uchiba M, et al. Effect of nafamostat mesilate, a synthetic protease inhibitor, on tissue factor-factor VIIa complex activity. Thromb Res. 1994;74(2):155-61.
- Lin Y, et al. Efficacy and safety of nafamostat mesilate anticoagulation in blood purification treatment of critically ill patients: a systematic review and meta-analysis. Ren Fail. 2022;44(1):1264-80.
- Kim T, et al. The role of nafamostat mesylate anticoagulation in continuous kidney replacement therapy for critically ill patients with bleeding tendencies: a retrospective study on patient outcomes and safety. Kidney Res Clin Pract. 2024;43(4):469-79.
- Miao M, Chen Z. Impact of nafamostat mesylate combined with continuous renal replacement therapy on clinical outcomes, immune function, and oxidative stress markers in patients with sepsis-associated acute kidney injury. Br J Hosp Med (Lond). 2025;86(2):1-13.
- Liberati A, et al. The PRISMA statement for reporting systematic reviews and meta-analyses of studies that evaluate health care interventions: explanation and elaboration. J Clin Epidemiol. 2009;62(10):e1-e34.
- Rethlefsen ML, et al. PRISMA-S: an extension to the PRISMA Statement for Reporting Literature Searches in Systematic Reviews. Syst Rev. 2021;10(1):39. https://doi.org/10.1186/s13643-020-01542-z.
- Sterne JAC, et al. RoB 2: a revised tool for assessing risk of bias in randomised trials. BMJ. 2019;366:l4898.
- Sterne JAC, et al. ROBINS-I: a tool for assessing risk of bias in non-randomised studies of interventions. BMJ. 2016;355:i4919.
- Higgins JPT, Thompson SG, Deeks JJ, Altman DG. Measuring inconsistency in meta-analyses. BMJ. 2003;327(7414):557-60.
- Park II, et al. Saline versus nafamostat mesilate anticoagulation for continuous veno-venous hemofiltration (CVVH) in patients at high risk of bleeding: a prospective study. Korean J Nephrol. 2009;28(3):205-10.
- Baek NN, et al. The role of nafamostat mesylate in continuous renal replacement therapy among patients at high risk of bleeding. Ren Fail. 2012;34(3):279-85.
- Hwang SD, et al. Nafamostat mesilate for anticoagulation in continuous renal replacement therapy. Int J Artif Organs. 2013;36(3):208-16.
- Lee YK, Lee HW, Choi KH, Kim BS. Ability of nafamostat mesilate to prolong filter patency during continuous renal replacement therapy in patients at high risk of bleeding: a randomized controlled study. PLoS One. 2014;9(10):e108737.
- Lee ST, Cho H. The use of nafamostat mesilate as an anticoagulant during continuous renal replacement therapy for children with a high risk of bleeding. J Korean Soc Pediatr Nephrol. 2014;18(2):98-105.
- Choi JY, et al. Nafamostat mesilate as an anticoagulant during continuous renal replacement therapy in patients with high bleeding risk: a randomized clinical trial. Medicine (Baltimore). 2015;94(52):e2392.
- Inoue Y, et al. Optimal target of ACT for an appropriate nafamostat mesilate dosage during continuous renal replacement therapy. J Jpn Soc Blood Purif Crit Care. 2010;1(1):124-30.
- Rhee H, Jung KS, Ku EY. Effect of targeted versus fixed dosing of nafamostat mesylate on filter life in patients undergoing continuous renal replacement therapy. Sci Rep. 2026. https://doi.org/10.1038/s41598-026-63297-2.
- Mali N, et al. Nafamostat mesylate in renal replacement therapy: balancing efficacy with emerging risks of hyperkalemia. Ren Fail. 2025;47(1):2587496. https://doi.org/10.1080/0886022X.2025.2587496.
- Kim HS, et al. Cardiac arrest caused by nafamostat mesilate. Kidney Res Clin Pract. 2016;35(3):187-9.
- Liu C, et al. Regional citrate versus heparin anticoagulation for continuous renal replacement therapy in critically ill patients: a meta-analysis with trial sequential analysis of randomized controlled trials. Crit Care. 2016;20(1):144.
- Ohtake Y, et al. Nafamostat mesylate as anticoagulant in continuous hemofiltration and continuous hemodiafiltration. In: Sieberth HG, Mann H, Stummvoll HK, editors. Continuous Hemofiltration. Contributions to Nephrology. Vol. 93. Karger; Basel; 1991. p. 215-7. https://doi.org/10.1159/000420222.
- Gao J, et al. A mode of CVVH with regional citrate anticoagulation compared to no anticoagulation for acute kidney injury patients at high risk of bleeding. Sci Rep. 2019;9(1):6607.
- Okuda A, et al. Experience of the continuous hemodialysis with citrate anticoagulation. J Jpn Soc Intensive Care Med. 2013;20(4):653-4.