This study presents a two-center ambispective workflow for measuring serum carcinoembryonic antigen, squamous cell carcinoma antigen, and carbohydrate antigen 125 and validating their combined diagnostic and prognostic value in esophageal squamous cell carcinoma.
Research Article
A Combined Serum Biomarker Panel for Diagnostic and Prognostic Assessment in Esophageal Squamous Cell Carcinoma
* These authors contributed equally
In This Article
Summary
Abstract
Esophageal squamous cell carcinoma remains difficult to diagnose early and to stratify accurately before treatment. Conventional tumor-node-metastasis staging provides essential anatomical information but does not fully reflect circulating biological heterogeneity. This two-center ambispective observational study developed and externally validated a combined serum biomarker panel incorporating carcinoembryonic antigen, squamous cell carcinoma antigen, and carbohydrate antigen 125 for diagnostic discrimination and prognostic risk assessment in esophageal squamous cell carcinoma. A total of 277 participants were enrolled from a tertiary hospital and a community healthcare center, including 167 patients with esophageal squamous cell carcinoma, 55 patients with benign esophageal disease, and 55 healthy controls. The tertiary hospital cohort was used for model development and internal validation, and the community center cohort was used for external validation. Pretreatment serum biomarkers were measured before initial treatment, logarithmically transformed, standardized using training-cohort parameters, and entered into diagnostic logistic regression and prognostic Cox proportional hazards models. The combined panel showed higher diagnostic discrimination than any individual marker, with an area under the receiver operating characteristic curve of 0.869 in the training cohort and 0.842 in the external validation cohort. A higher combined biomarker burden was associated with tumor length of at least 5 cm, pT3–4 disease, lymph node metastasis, and tumor-node-metastasis stage III–IV disease. In survival analysis, high combined biomarker burden independently predicted poorer overall survival and progression-free survival after adjustment for major clinicopathological factors. The integrated prognostic model, combining biomarker burden with clinicopathological variables, outperformed the tumor-node-metastasis stage alone, with a training-cohort C-index of 0.792 and an external-validation C-index of 0.761. These findings support the use of the serum carcinoembryonic antigen, squamous cell carcinoma antigen, and carbohydrate antigen 125 panel as a practical, noninvasive adjunct for pretreatment assessment and individualized risk stratification in esophageal squamous cell carcinoma.
Introduction
Esophageal squamous cell carcinoma is a major histological subtype of esophageal cancer and remains a substantial clinical burden in East Asia, particularly in China1. Although endoscopic diagnosis, imaging assessment, surgery, chemoradiotherapy, and systemic treatment have improved clinical management, prognosis remains unsatisfactory for many patients2. One important reason is that the disease is frequently detected after local invasion or nodal spread has already occurred3. Another is that patients with the same tumor-node-metastasis stage may still differ in treatment response, recurrence risk, and survival outcome4. These differences indicate that anatomical staging alone cannot fully describe the biological variability of esophageal squamous cell carcinoma.
Current clinical evaluation relies mainly on endoscopy with biopsy, radiological staging, and postoperative pathological assessment. These methods are indispensable, but they have limitations when used for repeated monitoring, pretreatment risk estimation, or broad screening. Endoscopy is invasive and less suitable for frequent follow-up, whereas computed tomography and endoscopic ultrasonography may miss subtle invasion or small metastatic lesions5. Imaging-based and molecular prognostic models have improved risk prediction in esophageal squamous cell carcinoma, but many require specialized platforms, image post-processing, tissue sequencing, or computational workflows that are not routinely available in all clinical laboratories6,7. A low-cost and repeatable blood-based approach may therefore provide useful complementary information, especially when clinicians need pretreatment risk stratification before definitive therapy.
Serum tumor markers are attractive in this setting because they are routinely available, minimally invasive, and easy to repeat. Carcinoembryonic antigen reflects tumor burden and abnormal cellular differentiation, whereas squamous cell carcinoma antigen is more closely associated with malignant transformation of the squamous epithelium8. Carbohydrate antigen 125 has been linked to systemic inflammatory activity, serosal involvement, and disease progression in several malignancies9. These markers do not represent the same biological signal. Instead, they may capture overlapping but distinct dimensions of tumor burden, squamous phenotype, systemic response, and host-tumor interaction. For this reason, a combined panel may perform better than any single marker when the goal is to identify esophageal squamous cell carcinoma and estimate clinical risk10.
Previous studies have evaluated serum tumor markers, inflammatory indicators, imaging signatures, molecular profiles, and composite prognostic models in esophageal squamous cell carcinoma and related gastrointestinal cancers11,12. However, many published models focus on either diagnosis or prognosis, use single-center cohorts, lack independent external validation, or provide limited details about marker transformation, cutoff selection, calibration, and model reproducibility. The novelty of the present study is the development of a practical three-marker serum panel that uses routinely measured carcinoembryonic antigen, squamous cell carcinoma antigen, and carbohydrate antigen 125 to support both diagnostic discrimination and prognostic risk stratification within a single two-center workflow. The model was developed in a tertiary hospital cohort and then tested without re-optimization in an independent community center cohort, allowing evaluation of stability across different clinical settings.
This study developed and validated a combined serum biomarker panel based on carcinoembryonic antigen, squamous cell carcinoma antigen, and carbohydrate antigen 125. The analysis followed two linked objectives. The first was to evaluate whether the combined panel improved diagnostic discrimination between esophageal squamous cell carcinoma and non-malignant controls compared with individual serum markers. The second was to determine whether pretreatment combined biomarker burden added prognostic information beyond conventional clinicopathological variables and tumor-node-metastasis stage. This structure allowed the study to assess whether a routinely available serum biomarker panel could function as a noninvasive adjunct to pathological diagnosis, imaging assessment, and anatomical staging in pretreatment clinical evaluation.
Protocol
This study involving human participants, clinical records, and serum samples was conducted in accordance with the Declaration of Helsinki and institutional requirements for human-subject research13. The study protocol was reviewed and approved by Jiangsu Province Hospital of Chinese Medicine under approval number CJ28J12-45. For retrospectively collected anonymized clinical data and residual serum samples, the requirement for additional written informed consent was waived in accordance with institutional ethics regulations. For prospectively collected samples, written informed consent was obtained before enrollment. All participant information and serum samples were anonymized before analysis. Study identifiers were used for data linkage, and no personally identifiable information was included in the analytical dataset.
Study design and cohort allocation
This two-center ambispective observational study evaluated the diagnostic and prognostic value of a combined serum biomarker panel incorporating carcinoembryonic antigen (CEA), squamous cell carcinoma antigen (SCC-Ag), and carbohydrate antigen 125 (CA125) in esophageal squamous cell carcinoma (ESCC). Retrospective data were obtained from eligible clinical records and residual pretreatment serum samples, and prospective enrollment was used to collect additional pretreatment serum samples and to complete follow-up within the same study framework. Participants were recruited from one tertiary hospital and one community healthcare center between January 2021 and December 2024, with follow-up continuing until December 31, 2025. Center A was the tertiary hospital and served as the training cohort for model development, coefficient estimation, cutoff selection, and internal validation. Center B was the community healthcare center and served as the external validation cohort. The study was reported in accordance with the Transparent Reporting of a multivariable prediction model for Individual Prognosis or Diagnosis (TRIPOD) guidelines14.
A total of 277 participants were included, with 194 from Center A and 83 from Center B. The training cohort included 114 ESCC patients, 40 benign esophageal disease controls, and 40 healthy controls. The external validation cohort included 53 ESCC patients, 15 benign esophageal disease controls, and 15 healthy controls. Center-based allocation was used instead of random splitting to reduce information leakage and test model stability in an independent clinical setting. The diagnostic analysis compared serum CEA, SCC-Ag, and CA125 levels among ESCC patients, patients with benign esophageal disease, and healthy controls. The prognostic analysis was restricted to ESCC patients and assessed whether combined biomarker burden improved risk stratification for overall survival (OS) and progression-free survival (PFS). The study design, participant screening, cohort allocation, serum biomarker workflow, diagnostic model development, external validation, and prognostic model comparison are summarized in Figure 1.
The participant flow included screening, exclusions, diagnostic grouping, and center-based allocation. A total of 326 individuals were screened. Forty-nine individuals were excluded, including 12 with antitumor treatment before blood sampling, 8 with another primary malignancy, 9 with severe infection, autoimmune disease, or uncontrolled comorbidities likely to affect serum tumor markers, 11 with hemolysis, lipemia, jaundice interference, insufficient serum volume, or prolonged processing interval, and 9 with missing key clinical, pathological, or follow-up data. The final analytical population comprised 277 participants: 167 ESCC patients, 55 benign esophageal disease controls, and 55 healthy controls.
Sample size rationale
The sample size was determined by the consecutive availability of eligible participants, pretreatment serum samples, and follow-up information during the predefined study period. The diagnostic model used three continuous serum biomarkers as candidate predictors. In the training cohort, 114 ESCC cases and 80 non-ESCC controls were available, corresponding to 38.0 ESCC cases and 26.7 non-ESCC controls per candidate biomarker predictor. This supported low-dimensional logistic regression and reduced the risk of overfitting. The external validation cohort included 53 ESCC cases and 30 non-ESCC controls and was used only for validation without coefficient re-estimation. The sample-size rationale was aligned with current prediction-model principles, which emphasize outcome frequency, number of candidate predictor parameters, anticipated model performance, and independent validation rather than random data splitting15.
Participant recruitment, eligibility, and data collection
Participants were enrolled continuously during the study period. In Center A, ESCC patients were recruited from thoracic surgery, gastroenterology, and oncology departments. In Center B, ESCC patients were identified through community-based screening, follow-up records, or referral pathways and were included only when pathological confirmation and pretreatment serum samples were available. Benign esophageal disease controls were recruited from individuals who underwent gastroscopy for dysphagia, reflux symptoms, or suspected esophageal abnormalities and had non-malignant pathological findings. Healthy controls were selected from routine health examinations during the same period and had no history of malignancy, active infection, severe hepatic or renal dysfunction, or imaging/endoscopic evidence of esophageal space-occupying lesions.
ESCC patients were eligible if they had primary ESCC confirmed by gastroscopic biopsy or postoperative pathology, had no antitumor treatment before blood sampling, and had complete baseline clinical data, pathological records, and pretreatment serum samples. Participants were excluded if they had another primary malignancy, prior antitumor treatment before blood sampling, severe acute infection, active autoimmune disease, uncontrolled comorbidities likely to affect serum tumor marker levels, visible hemolysis, lipemia, jaundice interference, insufficient serum volume, missing key clinical variables, or unavailable follow-up data. Prognostic analysis was limited to ESCC patients with available tumor-node-metastasis (TNM) stage and measurable survival or progression outcomes. Patients with follow-up shorter than 6 months were retained if death or progression occurred within that period.
Baseline variables included age, sex, smoking history, alcohol consumption history, body mass index, participating center, diagnostic group, lesion type, and serum levels of CEA, SCC-Ag, and CA125. For ESCC patients, additional variables included tumor location, tumor length, histological differentiation, depth of invasion, lymph node status, TNM stage, lymphovascular invasion, initial treatment modality, recurrence, progression, survival status, and last follow-up date. Smoking history was defined as current smoking or previous regular smoking of at least 100 cigarettes during lifetime. Alcohol consumption history was defined as alcohol intake at least once per week for more than 6 months. TNM staging was determined according to the eighth edition of the American Joint Committee on Cancer/Union for International Cancer Control staging system for esophageal cancer16. Pathological slides from ESCC and benign lesion cases were independently reviewed by two senior pathologists, and any disagreements were resolved by a third pathologist.
Two trained researchers independently extracted clinical information from electronic medical records, pathology reports, laboratory information systems, treatment records, follow-up records, and death registration records using a predefined data dictionary. Discrepancies were resolved by checking the original records, with a third researcher making the final decision when needed. Tumor location was categorized as upper, middle, or lower thoracic esophagus. Histological differentiation was categorized as well, moderate, or poor differentiation. Continuous-variable units were standardized across both participating centers before analysis.
Blood sampling, serum processing, and biomarker measurement
All blood samples were collected before initial treatment, within 7 days after pathological confirmation, and at least 3 days before treatment initiation. Peripheral venous blood samples of 5–8 mL were collected between 7:00 AM and 9:00 AM after overnight fasting using serum-separation tubes. Sampling was deferred if the participant had received a blood transfusion, a large-volume albumin infusion, or an invasive procedure within 72 h before collection. Samples were allowed to clot at room temperature for 30 min, then centrifuged at 1,500 × g for 10 min. Serum was separated and aliquoted into 3–5 barcode-labeled tubes, with 300–500 µL per aliquot. Aliquots were stored at −80°C until testing, and no aliquot was subjected to more than one freeze-thaw cycle. Samples with visible hemolysis, lipemia, jaundice interference, insufficient volume, or a collection-to-freezing interval longer than 2 h were excluded.
Serum CEA, SCC-Ag, and CA125 were measured using automated chemiluminescent immunoassay systems according to the manufacturers’ instructions. Serum aliquots were thawed at 4°C before testing, gently mixed, and analyzed in a single run whenever possible. If batch testing was required, sample order was arranged to avoid systematic grouping by disease status, center, pathological stage, or follow-up outcome. Samples exceeding the analytical measurement range were diluted and retested according to the reagent instructions. Laboratory personnel were blinded to participant group, pathological stage, treatment status, and follow-up outcome.
The clinical thresholds were 5.0 ng/mL for CEA, 1.5 ng/mL for SCC-Ag, and 35 U/mL for CA125, based on local laboratory standards and manufacturers’ reference intervals. These thresholds were used to define marker elevation and high combined biomarker burden for clinicopathological association and survival-stratification analyses. For diagnostic classification, data-driven cutoffs were selected only in the training cohort using the Youden index and then applied unchanged to the external validation cohort. Instrument calibration and internal quality control were performed before testing. High- and low-level controls were included during each testing day, and testing proceeded only when quality-control results were within the accepted range.
Inter-assay and inter-center reproducibility were assessed before final model analysis using blinded bridging serum aliquots and routine quality-control materials. A bridging set of 30 blinded serum aliquots was tested across the two laboratory workflows. The inter-center coefficients of variation were 4.8% for CEA, 5.6% for SCC-Ag, and 5.1% for CA125. The corresponding intraclass correlation coefficients were 0.94 for CEA, 0.92 for SCC-Ag, and 0.93 for CA125. No center-specific assay recalibration was performed because no systematic deviation exceeded the predefined laboratory quality-control range. Final biomarker values were harmonized using unit standardization and training-cohort-based statistical standardization prior to model construction.
Combined biomarker definition and model construction
The combined serum biomarker panel consisted of CEA, SCC-Ag, and CA125. For clinicopathological association analysis and Kaplan-Meier survival stratification, each marker was classified as elevated or non-elevated according to the predefined clinical threshold. High combined biomarker burden was defined as the elevation of at least two of the three markers. For diagnostic and prognostic modeling, the three biomarkers were retained as continuous variables, transformed using the natural logarithm, and standardized using the mean and standard deviation from the training cohort. The same transformation parameters were applied to the external validation cohort.
The standardized log-transformed biomarkers were calculated using the following training-cohort parameters:
zlnCEA = (lnCEA - 1.42)/0.71
zlnSCC - Ag = (lnSCC - Ag - 0.28)/0.57
zlnCA125 = (lnCA125 - 3.05)/0.62
The combined diagnostic panel was constructed using multivariable logistic regression in the training cohort. The diagnostic linear predictor was calculated as follows:
LPdiagnostic = -0.46 + 0.59 × zlnCEA + 1.05 × zlnSCC - Ag+0.42 × zlnCA125
The individual predicted probability of ESCC was calculated as follows:
PESCC = 1/1+exp(-LPdiagnostic)
The optimal diagnostic cutoff for the combined panel was 0.57, selected in the training cohort using the Youden index and applied unchanged in external validation.
The prognostic biomarker score was constructed using Cox proportional hazards modeling. The TNM-stage-alone model was used as the comparator for anatomical staging. The biomarker model used combined biomarker burden. The clinicopathological model used age, tumor length, histological differentiation, pT stage, lymph node status, and initial treatment modality. The integrated model added a high combined biomarker burden to the clinicopathological model. For OS, the integrated prognostic linear predictor was calculated as follows:
LPOS = 0.33 × age ≥65 years +0.36 × tumorlength ≥5cm + 0.25 × poordifferentiation + 0.31 × pT3
- 4stage + 0.66 × lymphnodemetastasis
-0.58 × radicalsurgery - basedtreatment
+0.81 × highcombinedbiomarkerburden
For PFS, the integrated prognostic linear predictor was calculated as follows:
LPPFS = 0.27 × age ≥ 65years + 0.31 × tumorlength ≥ 5cm + 0.24 × poordifferentiation +0.25 × pT3
-4stage + 0.55 × lymphnodemetastasis
- 0.46 × radicalsurgery - basedtreatment
+0.71 × highcombinedbiomarkerburden
All binary variables in the prognostic equations were coded as 1 when present and 0 when absent. All coefficients, standardization parameters, and cutoffs were estimated in the training cohort and applied directly to the external validation cohort without re-optimization.
Diagnostic and prognostic endpoints
Pathological diagnosis was used as the diagnostic reference standard. The primary diagnostic endpoint was discrimination between ESCC and non-ESCC controls, including benign esophageal disease and healthy controls. Secondary diagnostic endpoints included discrimination between ESCC and benign esophageal disease, ESCC and healthy controls, and early-stage ESCC and non-malignant controls. Early-stage ESCC was defined as TNM stage I–II disease. Diagnostic performance was evaluated using receiver operating characteristic curves, area under the curve, sensitivity, specificity, positive predictive value, negative predictive value, accuracy, F1 score, precision-recall curves, calibration curves, Brier scores, calibration intercepts, calibration slopes, and decision curve analysis.
Prognostic analysis was conducted only in ESCC patients. The primary prognostic endpoint was OS, defined as the interval from the date of first definitive antitumor treatment to death from any cause. The secondary prognostic endpoint was PFS, defined as the interval from first treatment to documented disease progression, recurrence, or death. For patients who underwent radical surgery, local recurrence, distant metastasis, or tumor-related death was counted as a PFS event when no residual lesion was present after surgery. For patients receiving definitive chemoradiotherapy or palliative treatment, progression was determined according to imaging findings, endoscopic assessment, and clinical evaluation.
Follow-up data were obtained through outpatient visits, hospitalization records, community follow-up records, referral records, and telephone contact. Patients were followed every 3 months during the first 2 years after treatment, every 6 months from years 3 to 5, and annually thereafter. Patients without death, recurrence, or progression by the final follow-up date were censored at their last confirmed contact. Outcome events were independently reviewed by two investigators. When event dates differed between sources, imaging reports, discharge records, endoscopic reports, referral documents, and death registration records were checked to determine the final event date. The follow-up cutoff date was December 31, 2025, for both participating centers.
Statistical analysis
Statistical analysis was performed using R 4.3.2 and SPSS 27.0. Continuous variables were summarized as mean ± standard deviation or median (interquartile range), depending on the distribution. Categorical variables were summarized as counts and percentages. Between-group comparisons were performed using the independent-samples t-test, Mann–Whitney U test, one-way analysis of variance, Kruskal–Wallis test, chi-square test, or Fisher’s exact test, as appropriate. Missing data were assessed before model construction. Participants missing key diagnostic status, pretreatment biomarker values, TNM stage, or survival/progression outcome data were excluded according to the predefined eligibility criteria. Non-key covariates with missingness below 5.0% were handled using multiple imputation by chained equations with 20 imputed datasets and 20 iterations17. Imputation models included diagnostic group, center, age, sex, smoking history, alcohol use, biomarker values, TNM stage, treatment modality, OS status, PFS status, and follow-up time. Complete-case analyses were performed as sensitivity analyses.
The diagnostic model was developed in the training cohort. Receiver operating characteristic curves were used to calculate area under the curve, sensitivity, specificity, positive predictive value, negative predictive value, accuracy, and F1 score. Areas under the curve were compared using the DeLong test18. Precision-recall curves were used as a supplementary diagnostic evaluation. Calibration was assessed using calibration curves, Brier scores, calibration intercepts, and calibration slopes. Clinical utility was evaluated using decision curve analysis19. Internal validation was performed using 1,000 bootstrap resamples to estimate optimism-corrected discrimination and calibration. External validation was performed by applying the training-cohort equation, standardization parameters, and cutoff directly to Center B without refitting.
For prognostic analysis, Kaplan–Meier curves were generated to compare OS and PFS between biomarker-burden groups, and the log-rank test was used to assess differences in survival. Cox proportional hazards regression was used to estimate hazard ratios and 95% confidence intervals. Variables with clinical relevance and variables associated with outcomes in univariable analysis were considered for multivariable models. Model performance was evaluated using Harrell’s C-index, time-dependent receiver operating characteristic curves, calibration curves, Brier scores, and decision curve analysis20. Prognostic calibration was assessed at 1, 3, and 5 years. The proportional hazards assumption was assessed using Schoenfeld residuals and log-minus-log survival plots21. The global Schoenfeld test P values were 0.42 for the OS model and 0.37 for the PFS model. Multicollinearity was assessed using variance inflation factors before final model interpretation, and all candidate variables in the final diagnostic and prognostic models had variance inflation factors below 2.1. Incremental prognostic value beyond TNM stage and conventional clinicopathological models was assessed using net reclassification improvement and integrated discrimination improvement. Model parameters estimated in the training cohort were applied to the external validation cohort without refitting22. All tests were two-sided, and P < 0.05 was considered statistically significant.
Results
Participant flow and assay reproducibility
A total of 326 individuals were screened, and 49 were excluded: 12 had received antitumor treatment before blood sampling, 8 had another primary malignancy, 9 had severe infection, autoimmune disease, or uncontrolled comorbidities likely to affect serum tumor markers, 11 had hemolysis, lipemia, jaundice interference, insufficient serum volume, or prolonged processing interval, and 9 had missing key clinical, pathological, or follow-up data. The final analytical population comprised 277 participants: 167 patients with esophageal squamous cell carcinoma (ESCC), 55 patients with benign esophageal disease, and 55 healthy controls. Center A contributed 194 participants to the training cohort, and Center B contributed 83 participants to the external validation cohort. The participant flow, cohort allocation, biomarker testing workflow, diagnostic model development, external validation, and prognostic modeling framework is shown in Figure 1, and the screening and exclusion details are summarized in Supplementary Table 1.
Inter-assay and inter-center reproducibility were assessed using 30 blinded bridging serum aliquots. The inter-center coefficients of variation were 4.8% for carcinoembryonic antigen (CEA), 5.6% for squamous cell carcinoma antigen (SCC-Ag), and 5.1% for carbohydrate antigen 125 (CA125). The corresponding intraclass correlation coefficients were 0.94, 0.92, and 0.93, respectively. No center-specific recalibration was required before statistical standardization and model development. The assay reproducibility results are provided in Supplementary Table 2.
Baseline characteristics of the study population
The median age of the overall population was 59 years (IQR, 53–66 years), and 198 participants (71.5%) were male. Current or former smoking was reported in 141 participants (50.9%), and current or former alcohol use was reported in 127 participants (45.8%). The cohort included 167 ESCC patients (60.3%), 55 patients with benign esophageal disease (19.9%), and 55 healthy controls (19.9%). The median serum CEA, SCC-Ag, and CA125 levels were 3.9 ng/mL (IQR, 2.0–6.6 ng/mL), 1.4 ng/mL (IQR, 0.8–2.3 ng/mL), and 22.8 U/mL (IQR, 13.9–35.7 U/mL), respectively. Age, sex, smoking history, alcohol use, diagnostic group, and baseline serum biomarker levels were comparable between the training and external validation cohorts (Table 1).
Among the 167 ESCC patients, the median age was 61 years (IQR, 55–68 years), and 133 patients (79.6%) were male. Tumors were most frequently located in the middle thoracic esophagus (89/167, 53.3%), followed by the lower thoracic esophagus (56/167, 33.5%) and upper thoracic esophagus (22/167, 13.2%). Moderately differentiated and poorly differentiated tumors accounted for 81 cases (48.5%) and 66 cases (39.5%), respectively. Tumor length was at least 5 cm in 68 patients (40.7%), pT3–4 disease was present in 121 patients (72.5%), lymph node metastasis was present in 100 patients (59.9%), and tumor-node-metastasis (TNM) stage III–IV disease was observed in 111 patients (66.5%). Lymphovascular invasion was identified in 65 patients (38.9%). Primary treatment consisted of radical surgery with or without adjuvant therapy in 113 patients (67.7%), definitive chemoradiotherapy in 32 patients (19.2%), and palliative systemic or supportive treatment in 22 patients (13.2%). The main clinicopathological variables were comparable between the training and external validation ESCC cohorts (Table 2).
Multidimensional distribution of serum biomarkers across study groups
The distributions of serum CEA, SCC-Ag, and CA125 differed across ESCC patients, benign esophageal disease controls, and healthy controls (Figure 2). After logarithmic transformation, all three biomarkers showed higher levels in the ESCC group than in the two non-malignant groups. The median CEA level was 5.2 ng/mL in ESCC patients, compared with 2.4 ng/mL in benign esophageal disease controls and 1.9 ng/mL in healthy controls. The median SCC-Ag level was 1.9 ng/mL in ESCC patients, compared with 0.9 ng/mL and 0.7 ng/mL in the other groups. The median CA125 level was 28.9 U/mL in ESCC patients, compared with 18.7 U/mL and 16.1 U/mL in the other groups. Group-specific serum biomarker distributions are summarized in Supplementary Table 3.
CEA and SCC-Ag showed clearer separation between ESCC and non-malignant controls than CA125. In the two-dimensional distribution of log-transformed CEA and SCC-Ag, ESCC samples were concentrated more often in the higher-value region, whereas healthy controls clustered more often in the lower-value region. High combined biomarker burden, defined as elevation of at least two of the three markers, was observed in 61 of 167 ESCC patients (36.5%), 8 of 55 benign esophageal disease controls (14.5%), and 4 of 55 healthy controls (7.3%). The distribution of elevated biomarker burden differed significantly among the three groups (P < 0.001), as also reported in Supplementary Table 3.
Development of the combined diagnostic signature in the training cohort
The combined diagnostic signature was developed in the training cohort using log-transformed CEA, SCC-Ag, and CA125 values (Figure 3). Pairwise correlation analysis showed moderate positive correlations among the three markers. The strongest correlation was observed between CEA and SCC-Ag (r = 0.58), followed by SCC-Ag and CA125 (r = 0.47) and CEA and CA125 (r = 0.41), supporting joint modeling without treating the markers as interchangeable measurements.
In univariable logistic regression, CEA, SCC-Ag, and CA125 were each associated with ESCC status, with odds ratios of 2.81, 3.94, and 2.14, respectively. In the multivariable diagnostic model, SCC-Ag showed the largest adjusted effect size (OR, 2.87; 95% CI, 1.62–5.09; P < 0.001), followed by CEA (OR, 1.80; 95% CI, 1.19–2.72; P = 0.006) and CA125 (OR, 1.52; 95% CI, 1.03–2.25; P = 0.034). The diagnostic model coefficients are summarized in Supplementary Table 4. The final diagnostic linear predictor was:
LPdiagnostic = -0.46 + 0.59 × zlnCEA + 1.05 × zlnSCC - Ag +0.42 × zlnCA125
The individual predicted probability of ESCC was calculated as:
PESCC = 1/1 + exp( -LPdiagnostic )
The predicted probability distribution from the combined diagnostic model showed separation between ESCC and non-ESCC participants. The optimal cutoff was 0.57. At this cutoff, the combined model achieved an area under the receiver operating characteristic curve (AUC) of 0.869 (95% CI, 0.817–0.921), with a positive predictive value of 85.8% and a negative predictive value of 73.0% in the training cohort.
Diagnostic performance and external validation of the combined biomarker panel
In the training cohort, SCC-Ag showed the highest diagnostic performance among the three individual biomarkers, with an AUC of 0.802 (95% CI, 0.735–0.869). The AUCs for CEA and CA125 were 0.711 (95% CI, 0.635–0.786) and 0.668 (95% CI, 0.591–0.744), respectively. The combined panel achieved the highest overall discrimination, with an AUC of 0.869 (95% CI, 0.817–0.921), sensitivity of 79.8%, specificity of 81.2%, positive predictive value of 85.8%, negative predictive value of 73.0%, accuracy of 80.4%, and F1 score of 82.7% (Table 3).
The receiver operating characteristic curves confirmed the higher diagnostic discrimination of the combined panel compared with individual biomarkers (Figure 4A). At the optimal cutoff of 0.57, the combined panel showed a sensitivity of 79.8% and specificity of 81.2%. The AUC of the combined panel was significantly higher than that of SCC-Ag alone (P = 0.032). Bootstrap internal validation with 1,000 resamples showed an optimism-corrected AUC of 0.856, an optimism-corrected calibration slope of 0.97, and an optimism-corrected Brier score of 0.154. Internal-validation estimates are provided in Supplementary Table 4.
In the external validation cohort, precision-recall analysis showed the highest average precision for distinguishing ESCC from healthy controls (AP = 0.912; Figure 4B). The average precision was 0.863 for ESCC versus non-ESCC and 0.841 for ESCC versus benign esophageal disease. The average precision for early-stage ESCC versus non-malignant controls was 0.535. Calibration analysis showed agreement between predicted probabilities and observed outcomes in both cohorts (Figure 4C). The Brier score was 0.148, with a calibration slope of 1.02 and an intercept of 0.01 in the training cohort. In the external validation cohort, the Brier score was 0.164 with a calibration slope of 0.93 and a calibration intercept of −0.04. Decision curve analysis showed a higher net benefit for the combined panel than for the treat-all and treat-none strategies across most probability thresholds (Figure 4D).
External validation results are summarized in Table 4. The combined panel achieved an AUC of 0.842 (95% CI, 0.753–0.930) for ESCC versus non-ESCC, with a sensitivity of 75.5%, a specificity of 76.7%, an accuracy of 75.9%, a Brier score of 0.164, a calibration slope of 0.93, and a net benefit of 0.218 at a threshold probability of 0.30. The AUCs were 0.801 (95% CI, 0.686–0.916) for ESCC versus benign esophageal disease, 0.889 (95% CI, 0.800–0.979) for ESCC versus healthy controls, and 0.818 (95% CI, 0.704–0.932) for early-stage ESCC versus non-malignant controls. The highest specificity was observed for ESCC versus healthy controls (86.7%), whereas early-stage ESCC versus non-malignant controls showed a sensitivity of 70.6% and a specificity of 78.3%.
Clinicopathological association profile of the combined biomarker panel in ESCC
The association between serum biomarker elevation and clinicopathological features was evaluated in ESCC patients (Table 5). Age and sex showed limited association with individual biomarker elevation. Patients aged at least 65 years had a higher proportion with high combined biomarker burden than those aged under 65 years (47.6% vs. 29.8%; P = 0.028), whereas sex was not associated with individual biomarker elevation or combined biomarker burden.
Tumor-related variables showed stronger associations with biomarker elevation. High combined biomarker burden was present in 50.0% of patients with tumor length at least 5 cm, compared with 27.3% of patients with tumor length under 5 cm (P = 0.004). High combined biomarker burden was also more frequent in patients with poor differentiation than in those with well or moderate differentiation (50.0% vs. 28.2%; P = 0.006), in patients with pT3–4 disease than in those with pT1–2 disease (42.1% vs. 21.7%; P = 0.011), in patients with lymph node metastasis than in those without lymph node metastasis (43.0% vs. 26.9%; P = 0.038), and in patients with TNM stage III–IV disease than in those with TNM stage I–II disease (43.2% vs. 23.2%; P = 0.009).
Patient-level visualization showed that higher combined risk scores were accompanied by more advanced clinicopathological features (Figure 5A). Patients with higher scores were more frequently classified as pT3–4, lymph node-positive, poorly differentiated, or TNM stage III–IV. Boxplot analysis showed upward biomarker distributions in patients with larger tumor length, poor differentiation, pT3–4 disease, lymph node positivity, and TNM stage III–IV disease (Figure 5B). The Sankey plot showed that patients with two or three elevated biomarkers were more often classified as TNM stage III–IV, while patients with no elevated biomarkers were more often classified as TNM stage I–II (Figure 5C). The association between combined biomarker burden and TNM stage distribution was statistically significant (P < 0.001).
Prognostic stratification based on the combined serum biomarker panel
The median follow-up time for ESCC patients was 34 months. During follow-up, 78 deaths and 96 progression-free survival events were recorded. Follow-up and event details are summarized in Supplementary Table 5. High combined biomarker burden was associated with poorer survival outcomes. In univariable Cox regression, high combined biomarker burden was associated with increased risk of death (HR, 2.91; 95% CI, 1.89–4.46; P < 0.001) and progression or death (HR, 2.63; 95% CI, 1.80–3.84; P < 0.001). After adjustment for age, tumor length, differentiation, pT stage, lymph node metastasis, and treatment modality, high combined biomarker burden remained independently associated with overall survival (OS; HR, 2.24; 95% CI, 1.41–3.54; P = 0.001) and progression-free survival (PFS; HR, 2.03; 95% CI, 1.35–3.05; P = 0.001). By contrast, elevated CEA, SCC-Ag, and CA125 were no longer statistically significant when included individually in the multivariable models. The Cox regression results are summarized in Table 6.
Kaplan–Meier analysis showed clear separation between the high and low combined biomarker burden groups (Figure 6A,B). The median OS was 38 months in the low-burden group and 19 months in the high-burden group (log-rank P < 0.001). The median PFS was 28 months in the low-burden group and 13 months in the high-burden group (log-rank P < 0.001). The integrated prognostic model showed higher time-dependent discrimination than TNM stage alone (Figure 6C), with AUCs of 0.829, 0.806, and 0.781 at 1, 3, and 5 years, respectively, compared with 0.701, 0.676, and 0.648 for TNM stage alone. The C-index improvement over TNM stage alone was 0.130 in the training cohort and 0.120 in the external validation cohort. The follow-up landmark heatmap showed increasing cumulative mortality across risk strata (Figure 6D). In the low-risk tertile, cumulative mortality probabilities were 6%, 12%, 24%, 37%, and 52% at 6, 12, 24, 36, and 60 months, respectively. The corresponding probabilities were 14%, 26%, 44%, 59%, and 74% in the intermediate-risk tertile and 28%, 47%, 68%, 82%, and 91% in the high-risk tertile.
External validation and incremental prognostic utility of the integrated model
The integrated model showed the highest prognostic discrimination among the evaluated models in both cohorts. In the training cohort, the C-index was 0.792 for the integrated model, compared with 0.736 for the clinicopathological model, 0.703 for the biomarker panel alone, and 0.662 for TNM stage alone. In the external validation cohort, the C-index for the integrated model was 0.761, compared with 0.708, 0.681, and 0.641 for the other models. Time-dependent AUCs also favored the integrated model. In the training cohort, the integrated model achieved AUCs of 0.829, 0.806, and 0.781 at 1, 3, and 5 years, respectively. In the external validation cohort, the corresponding AUCs were 0.801, 0.774, and 0.748. Compared with TNM stage alone, the integrated model showed an NRI of +0.274 and an IDI of +0.102. Bootstrap internal validation showed an optimism-corrected C-index of 0.779 for the integrated model. Model performance metrics are presented in Table 7, and additional prognostic validation results are provided in Supplementary Table 5.
The model comparison plot showed the highest Harrell’s C-index for the integrated model in both cohorts (Figure 7A). The nomogram incorporated age, tumor length, histological differentiation, pT stage, lymph node status, initial treatment modality, and high combined biomarker burden to estimate 1-, 3-, and 5-year OS probabilities (Figure 7B). In the external validation cohort, calibration curves for 1-, 3-, and 5-year OS were close to the ideal reference line (Figure 7C). The Brier scores were 0.141, 0.164, and 0.178, respectively, with calibration slopes of 0.97, 0.93, and 0.91. Decision curve analysis showed that the integrated model had a higher net benefit than TNM stage alone, the clinicopathological model, and the treat-all or treat-none strategies across the main threshold probability range (Figure 7D). At a threshold probability of 0.30, the net benefit was 0.181 for the integrated model, compared with 0.139 for the clinicopathological model and 0.117 for TNM stage alone. These calibration and decision-curve results are summarized in Supplementary Table 5.
DATA AVAILABILITY:
The datasets generated and analyzed during the current study are publicly available in the Figshare repository: https://doi.org/10.6084/m9.figshare.33154580.v1.
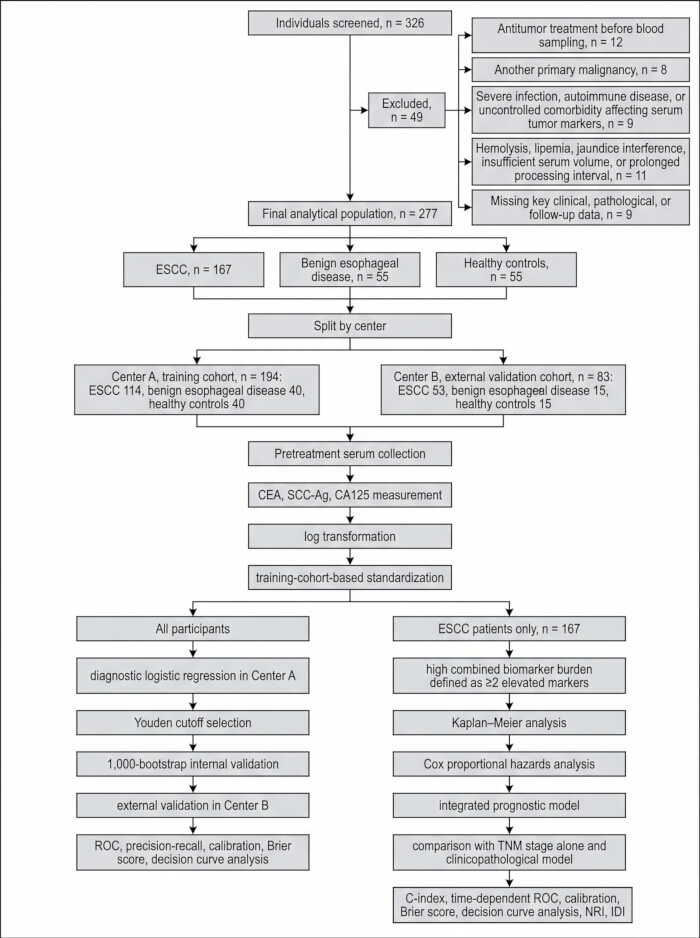
Figure 1: Study design and analytical workflow. Schematic overview of participant screening, cohort allocation, serum biomarker measurement, diagnostic model development, external validation, and prognostic model construction. Center A served as the training cohort, and Center B served as the external validation cohort. Please click here to view a larger version of this figure.
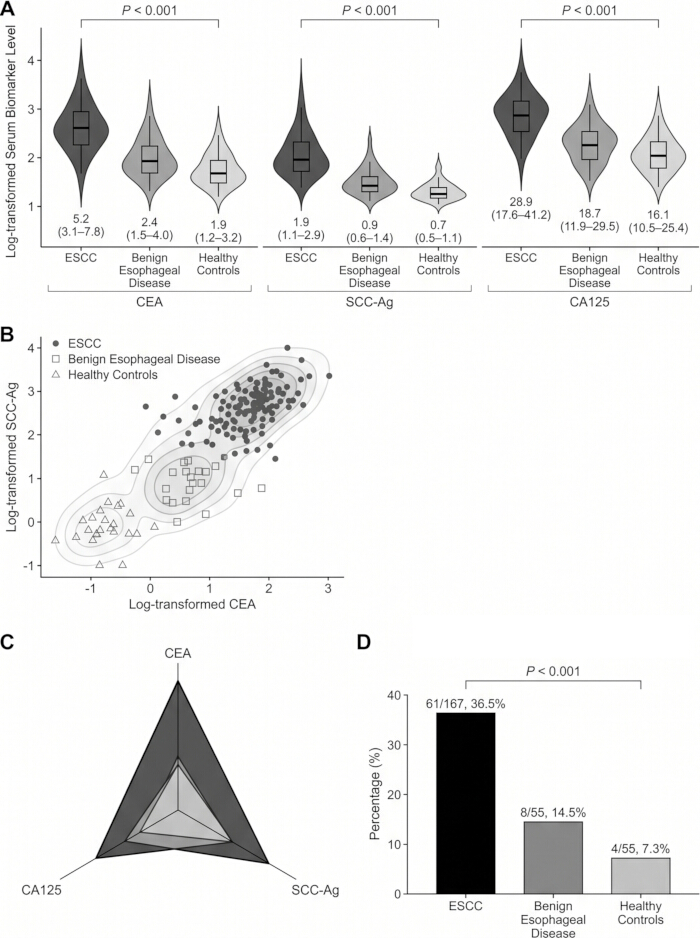
Figure 2: Distribution of serum CEA, SCC-Ag, and CA125 across study groups. (A) Violin and box plots showing log-transformed serum biomarker levels in ESCC patients, benign esophageal disease controls, and healthy controls. (B) Bivariate distribution of log-transformed CEA and SCC-Ag. (C) Radar plot summarizing the combined biomarker profile across diagnostic groups. (D) Distribution of elevated biomarker burden across diagnostic groups. CEA = carcinoembryonic antigen; SCC-Ag = squamous cell carcinoma antigen; CA125 = carbohydrate antigen 125; ESCC = esophageal squamous cell carcinoma. Please click here to view a larger version of this figure.
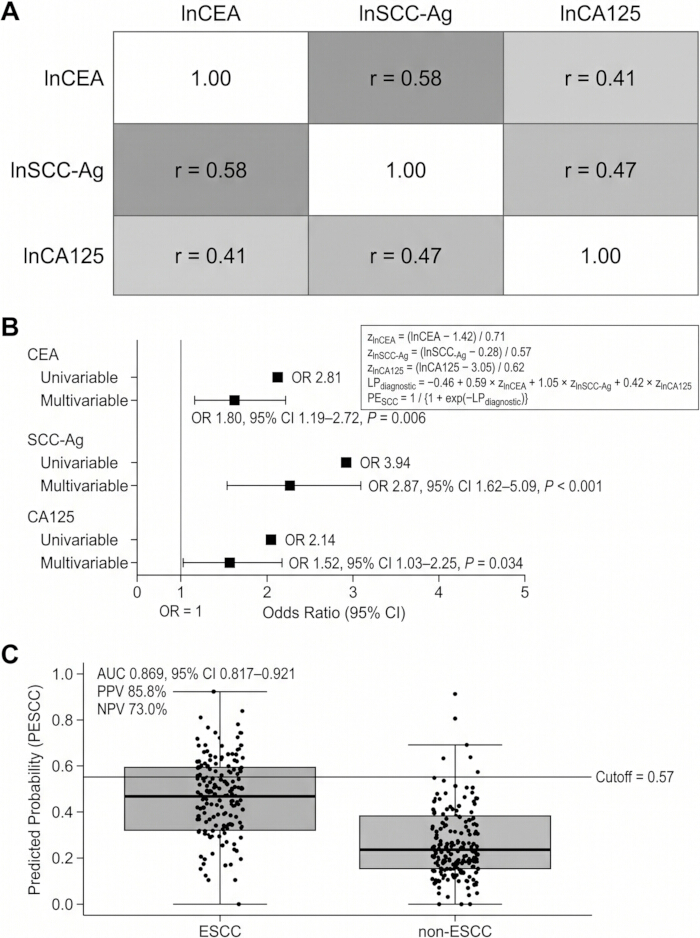
Figure 3: Development of the combined diagnostic signature in the training cohort. (A) Correlation heatmap of log-transformed CEA, SCC-Ag, and CA125. (B) Univariable and multivariable logistic regression results for individual biomarkers and the combined diagnostic model. (C) Predicted probability distribution for ESCC and non-ESCC participants based on the combined diagnostic model. Please click here to view a larger version of this figure.
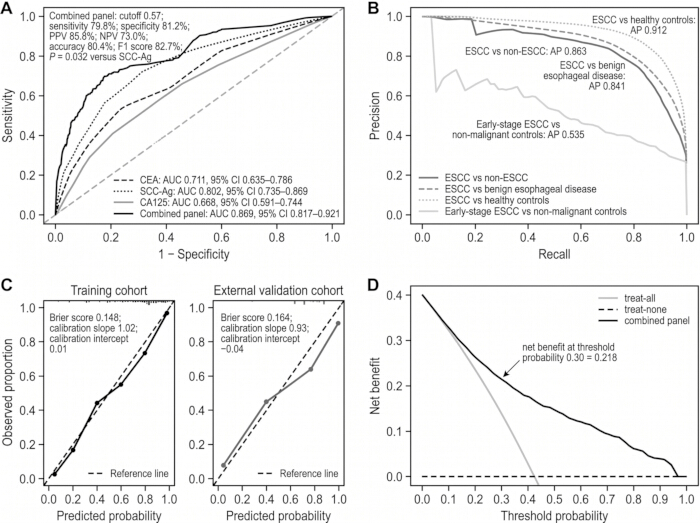
Figure 4: Diagnostic performance and external validation of the combined biomarker panel. (A) Receiver operating characteristic curves comparing individual biomarkers and the combined panel in the training cohort. (B) Precision-recall curves across external validation scenarios. (C) Calibration plots for the training and external validation cohorts. (D) Decision curve analysis showing net benefit across threshold probabilities. ROC = receiver operating characteristic. Please click here to view a larger version of this figure.
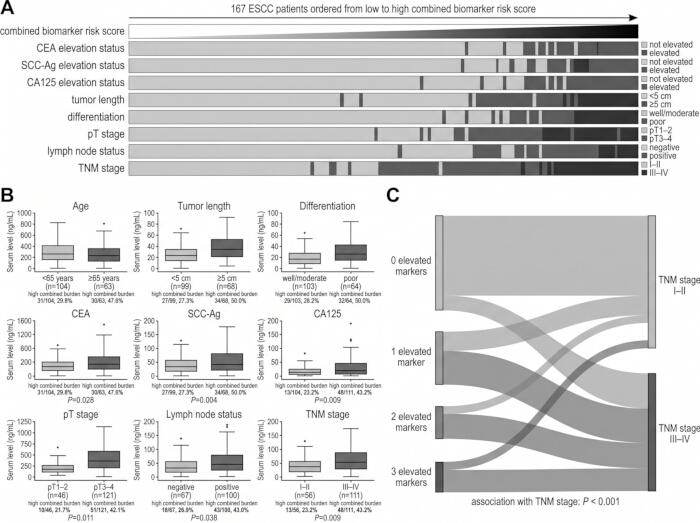
Figure 5: Clinicopathological association profile of the combined biomarker panel in ESCC. (A) Patient-level landscape of combined risk scores, serum biomarker levels, and clinicopathological features. (B) Boxplots showing biomarker distributions across major clinicopathological subgroups. (C) Sankey plot showing the relationship between elevated biomarker burden and TNM stage. TNM = tumor-node-metastasis. Please click here to view a larger version of this figure.
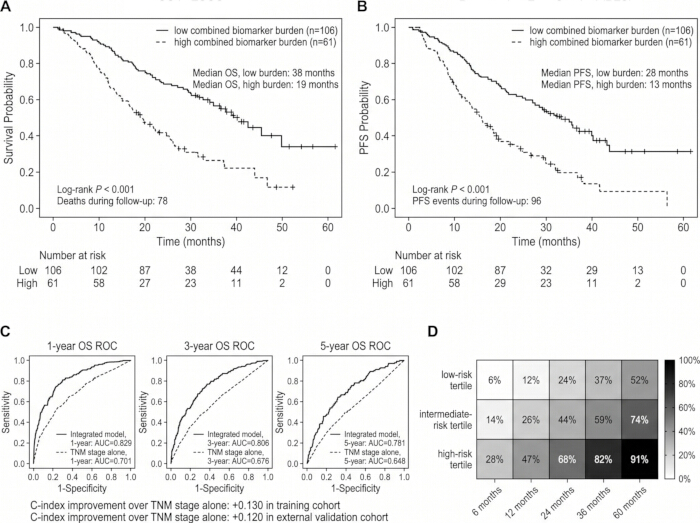
Figure 6: Prognostic stratification based on combined biomarker burden. (A) Kaplan–Meier curves for overall survival according to combined biomarker burden. (B) Kaplan–Meier curves for progression-free survival according to combined biomarker burden. (C) Time-dependent receiver operating characteristic curves comparing the integrated model with TNM stage alone. (D) Heatmap showing cumulative mortality probabilities across risk tertiles and follow-up landmarks. OS = overall survival; PFS = progression-free survival. Please click here to view a larger version of this figure.
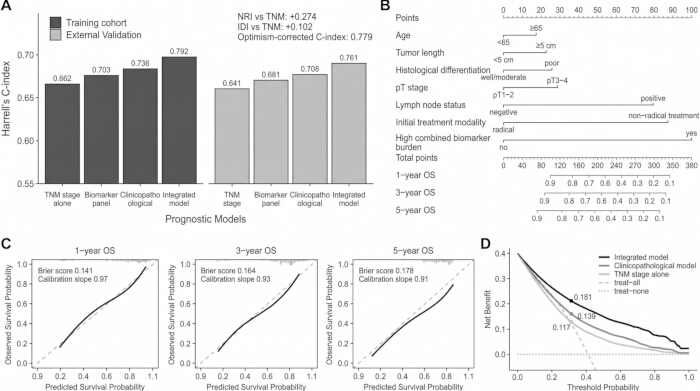
Figure 7: External validation and clinical translation of the integrated prognostic model. (A) Comparison of Harrell’s C-index across prognostic models in the training and external validation cohorts. (B) Nomogram incorporating age, tumor length, histological differentiation, pT stage, lymph node status, initial treatment modality, and high combined biomarker burden to estimate 1-, 3-, and 5-year overall survival. (C) External validation calibration plots for 1-, 3-, and 5-year overall survival. (D) Decision curve analysis comparing the integrated model with TNM stage alone, the clinicopathological model, and treat-all or treat-none strategies. Please click here to view a larger version of this figure.
| Variable | Overall (n = 277) | Training cohort, Center A (n = 194) | External validation cohort, Center B (n = 83) | P value |
| Age, years, median (IQR) | 59 (53–66) | 59 (52–65) | 60 (54–67) | 0.284 |
| Male sex, n (%) | 198 (71.5) | 137 (70.6) | 61 (73.5) | 0.622 |
| Current/former smoker, n (%) | 141 (50.9) | 95 (49.0) | 46 (55.4) | 0.321 |
| Current/former alcohol use, n (%) | 127 (45.8) | 87 (44.8) | 40 (48.2) | 0.603 |
| Diagnostic group, n (%) | 0.701 | |||
| ESCC | 167 (60.3) | 114 (58.8) | 53 (63.9) | |
| Benign esophageal disease | 55 (19.9) | 40 (20.6) | 15 (18.1) | |
| Healthy controls | 55 (19.9) | 40 (20.6) | 15 (18.1) | |
| Serum CEA, ng/mL, median (IQR) | 3.9 (2.0–6.6) | 3.8 (1.9–6.4) | 4.1 (2.1–6.8) | 0.367 |
| Serum SCC-Ag, ng/mL, median (IQR) | 1.4 (0.8–2.3) | 1.4 (0.8–2.2) | 1.5 (0.9–2.4) | 0.418 |
| Serum CA125, U/mL, median (IQR) | 22.8 (13.9–35.7) | 22.4 (13.5–34.9) | 23.6 (14.6–36.8) | 0.447 |
Table 1: Baseline characteristics of participants in the training and external validation cohorts. Demographic characteristics, cohort composition, and baseline serum CEA, SCC-Ag, and CA125 levels are summarized for the overall population, training cohort, and external validation cohort.
| Variable | Overall ESCC (n = 167) | Training Cohort (n = 114) | External Validation Cohort (n = 53) | P Value |
| Age, years, median (IQR) | 61 (55–68) | 61 (55–67) | 62 (56–68) | 0.386 |
| Male sex, n (%) | 133 (79.6) | 91 (79.8) | 42 (79.2) | 0.931 |
| Current/former smoker, n (%) | 110 (65.9) | 74 (64.9) | 36 (67.9) | 0.701 |
| Current/former alcohol use, n (%) | 95 (56.9) | 66 (57.9) | 29 (54.7) | 0.688 |
| Tumor location, n (%) | 0.879 | |||
| Upper thoracic | 22 (13.2) | 15 (13.2) | 7 (13.2) | |
| Middle thoracic | 89 (53.3) | 60 (52.6) | 29 (54.7) | |
| Lower thoracic | 56 (33.5) | 39 (34.2) | 17 (32.1) | |
| Histological differentiation, n (%) | 0.944 | |||
| Well differentiated | 20 (12.0) | 14 (12.3) | 6 (11.3) | |
| Moderately differentiated | 81 (48.5) | 56 (49.1) | 25 (47.2) | |
| Poorly differentiated | 66 (39.5) | 44 (38.6) | 22 (41.5) | |
| Tumor length ≥5 cm, n (%) | 68 (40.7) | 45 (39.5) | 23 (43.4) | 0.621 |
| pT3–4 stage, n (%) | 121 (72.5) | 82 (71.9) | 39 (73.6) | 0.821 |
| Lymph node metastasis, n (%) | 100 (59.9) | 68 (59.6) | 32 (60.4) | 0.924 |
| TNM stage III–IV, n (%) | 111 (66.5) | 75 (65.8) | 36 (67.9) | 0.785 |
| Lymphovascular invasion, n (%) | 65 (38.9) | 42 (36.8) | 23 (43.4) | 0.404 |
| Primary treatment modality, n (%) | 0.753 | |||
| Radical surgery ± adjuvant therapy | 113 (67.7) | 79 (69.3) | 34 (64.2) | |
| Definitive chemoradiotherapy | 32 (19.2) | 21 (18.4) | 11 (20.8) | |
| Palliative systemic/supportive treatment | 22 (13.2) | 14 (12.3) | 8 (15.1) |
Table 2: Clinicopathological characteristics of ESCC patients in the training and external validation cohorts. Tumor location, histological differentiation, tumor length, pT stage, lymph node status, TNM stage, lymphovascular invasion, and primary treatment modality are compared between ESCC patients in the training and external validation cohorts.
| Model | Optimal cutoff | AUC (95% CI) | Sensitivity (%) | Specificity (%) | PPV (%) | NPV (%) | Accuracy (%) | F1 score (%) |
| CEA | 4.85 ng/mL | 0.711 (0.635–0.786) | 58.8 | 76.2 | 77.9 | 56.6 | 66.2 | 67.1 |
| SCC-Ag | 1.52 ng/mL | 0.802 (0.735–0.869) | 70.2 | 78.8 | 82.5 | 65.6 | 73.8 | 76.1 |
| CA125 | 31.8 U/mL | 0.668 (0.591–0.744) | 44.7 | 82.5 | 78.5 | 52.4 | 60.3 | 57 |
| Combined panel | 0.57 | 0.869 (0.817–0.921) | 79.8 | 81.2 | 85.8 | 73 | 80.4 | 82.7 |
Table 3: Diagnostic accuracy of individual biomarkers and the combined serum biomarker panel in the training cohort. Diagnostic performance is reported using optimal cutoff, area under the receiver operating characteristic curve, sensitivity, specificity, positive predictive value, negative predictive value, accuracy, and F1 score.
| Comparison | AUC (95% CI) | Sensitivity, % | Specificity, % | Accuracy, % | Brier score | Calibration slope | Net benefit at threshold probability 0.30 |
| ESCC vs non-ESCC | 0.842 (0.753–0.930) | 75.5 | 76.7 | 75.9 | 0.164 | 0.93 | 0.218 |
| ESCC vs benign esophageal disease | 0.801 (0.686–0.916) | 73.6 | 73.3 | 73.5 | 0.171 | 0.9 | 0.196 |
| ESCC vs healthy controls | 0.889 (0.800–0.979) | 77.4 | 86.7 | 79.5 | 0.122 | 0.97 | 0.252 |
| Early-stage ESCC vs non-malignant controls | 0.818 (0.704–0.932) | 70.6 | 78.3 | 76.3 | 0.153 | 0.89 | 0.173 |
Table 4: External validation of the diagnostic performance of the combined serum biomarker panel. Model performance is summarized across four diagnostic scenarios: ESCC versus non-ESCC, ESCC versus benign esophageal disease, ESCC versus healthy controls, and early-stage ESCC versus non-malignant controls.
| Characteristic | Category | Elevated CEA (n %) | Elevated SCC-Ag (n %) | Elevated CA125 (n %) | High combined burden (n %) | P for CEA | P for SCC-Ag | P for CA125 | P for combined burden |
| Age | <65 years (n = 104) | 40 (38.5) | 54 (51.9) | 29 (27.9) | 31 (29.8) | 0.129 | 0.108 | 0.151 | 0.028 |
| ≥65 years (n = 63) | 32 (50.8) | 41 (65.1) | 25 (39.7) | 30 (47.6) | |||||
| Sex | Female (n=34) | 13 (38.2) | 17 (50.0) | 13 (38.2) | 12 (35.3) | 0.513 | 0.367 | 0.402 | 0.871 |
| Male (n = 133) | 59 (44.4) | 78 (58.6) | 41 (30.8) | 49 (36.8) | |||||
| Tumor length | <5 cm (n = 99) | 35 (35.4) | 49 (49.5) | 24 (24.2) | 27 (27.3) | 0.015 | 0.021 | 0.009 | 0.004 |
| ≥5 cm (n = 68) | 37 (54.4) | 46 (67.6) | 30 (44.1) | 34 (50.0) | |||||
| Differentiation | Well/moderate (n = 103) | 38 (36.9) | 52 (50.5) | 27 (26.2) | 29 (28.2) | 0.018 | 0.032 | 0.027 | 0.006 |
| Poor (n=64) | 34 (53.1) | 43 (67.2) | 27 (42.2) | 32 (50.0) | |||||
| pT stage | pT1–2 (n = 46) | 13 (28.3) | 20 (43.5) | 9 (19.6) | 10 (21.7) | 0.016 | 0.028 | 0.036 | 0.011 |
| pT3–4(n = 121) | 59 (48.8) | 75 (62.0) | 45 (37.2) | 51 (42.1) | |||||
| Lymph node status | Negative (n = 67) | 21 (31.3) | 31 (46.3) | 15 (22.4) | 18 (26.9) | 0.012 | 0.025 | 0.021 | 0.038 |
| Positive (n = 100) | 51 (51.0) | 64 (64.0) | 39 (39.0) | 43 (43.0) | |||||
| TNM stage | I–II (n = 56) | 16 (28.6) | 25 (44.6) | 11 (19.6) | 13 (23.2) | 0.008 | 0.021 | 0.014 | 0.009 |
| III–IV (n= 111) | 56 (50.5) | 70 (63.1) | 43 (38.7) | 48 (43.2) |
Table 5: Associations between serum biomarker elevation and clinicopathological features in ESCC patients. The proportions of elevated CEA, elevated SCC-Ag, elevated CA125, and high combined biomarker burden are compared across demographic and tumor-related subgroups.
| Variable | Univariable HR for OS (95% CI) | P value | Multivariable HR for OS (95% CI) | P value | Univariable HR for PFS (95% CI) | P value | Multivariable HR for PFS (95% CI) | P value |
| Age ≥65 years | 1.52 (1.01–2.31) | 0.046 | 1.39 (0.90–2.14) | 0.138 | 1.41 (0.97–2.06) | 0.074 | 1.31 (0.88–1.95) | 0.186 |
| Male sex | 1.18 (0.67–2.08) | 0.566 | — | — | 1.13 (0.69–1.84) | 0.632 | — | — |
| Tumor length ≥5 cm | 1.89 (1.25–2.86) | 0.003 | 1.44 (0.93–2.23) | 0.103 | 1.76 (1.22–2.55) | 0.003 | 1.36 (0.92–2.01) | 0.122 |
| Poor differentiation | 1.63 (1.07–2.47) | 0.024 | 1.29 (0.84–1.99) | 0.245 | 1.58 (1.09–2.28) | 0.016 | 1.27 (0.86–1.87) | 0.228 |
| pT3–4 stage | 2.04 (1.19–3.49) | 0.009 | 1.36 (0.76–2.44) | 0.304 | 1.92 (1.18–3.11) | 0.009 | 1.29 (0.77–2.18) | 0.335 |
| Lymph node metastasis | 2.46 (1.50–4.03) | <0.001 | 1.94 (1.15–3.28) | 0.013 | 2.12 (1.37–3.28) | 0.001 | 1.73 (1.08–2.79) | 0.023 |
| Radical surgery-based treatment | 0.43 (0.28–0.65) | <0.001 | 0.56 (0.36–0.88) | 0.012 | 0.51 (0.35–0.74) | <0.001 | 0.63 (0.43–0.94) | 0.024 |
| Elevated CEA | 1.88 (1.24–2.85) | 0.003 | 1.34 (0.86–2.10) | 0.199 | 1.71 (1.18–2.49) | 0.005 | 1.26 (0.84–1.88) | 0.267 |
| Elevated SCC-Ag | 1.95 (1.25–3.03) | 0.003 | 1.29 (0.80–2.08) | 0.302 | 1.82 (1.22–2.72) | 0.004 | 1.25 (0.81–1.93) | 0.315 |
| Elevated CA125 | 1.79 (1.16–2.78) | 0.009 | 1.21 (0.76–1.93) | 0.421 | 1.68 (1.13–2.50) | 0.011 | 1.18 (0.77–1.82) | 0.446 |
| High combined biomarker burden | 2.91 (1.89–4.46) | <0.001 | 2.24 (1.41–3.54) | 0.001 | 2.63 (1.80–3.84) | <0.001 | 2.03 (1.35–3.05) | 0.001 |
Table 6: Univariable and multivariable Cox regression analyses for overall survival and progression-free survival. Hazard ratios and 95% confidence intervals are presented for clinicopathological variables, individual biomarker elevation, and high combined biomarker burden.
| Model | Training cohort C-index | Training 1-year AUC | Training 3-year AUC | Training 5-year AUC | External validation C-index | External 1-year AUC | External 3-year AUC | External 5-year AUC | NRI vs TNM | IDI vs TNM |
| TNM stage alone | 0.662 | 0.701 | 0.676 | 0.648 | 0.641 | 0.672 | 0.651 | 0.628 | — | — |
| Biomarker panel alone | 0.703 | 0.744 | 0.713 | 0.689 | 0.681 | 0.709 | 0.687 | 0.666 | 0.118 | 0.049 |
| Clinicopathological model | 0.736 | 0.772 | 0.748 | 0.721 | 0.708 | 0.741 | 0.719 | 0.694 | 0.153 | 0.061 |
| Integrated model | 0.792 | 0.829 | 0.806 | 0.781 | 0.761 | 0.801 | 0.774 | 0.748 | 0.274 | 0.102 |
Table 7: Predictive performance of different prognostic models in the training and external validation cohorts. Harrell’s C-index, time-dependent area under the curve, net reclassification improvement, and integrated discrimination improvement are compared among TNM stage alone, the biomarker panel alone, the clinicopathological model, and the integrated model.
Supplementary Table 1: Participant screening, exclusion, and final cohort allocation. Screening numbers, exclusion reasons, final analytical population, diagnostic group distribution, and center-based cohort allocation are summarized.Please click here to download this file.
Supplementary Table 2: Inter-assay and inter-center reproducibility of serum biomarker measurement. Blinded bridging serum aliquot testing results are summarized using inter-center coefficients of variation and intraclass correlation coefficients for CEA, SCC-Ag, and CA125.Please click here to download this file.
Supplementary Table 3: Serum biomarker distribution and combined biomarker burden across diagnostic groups. Group-specific distributions of serum CEA, SCC-Ag, and CA125, and the proportion with high combined biomarker burden, are summarized for ESCC patients, benign esophageal disease controls, and healthy controls.Please click here to download this file.
Supplementary Table 4: Diagnostic model coefficients and bootstrap internal validation. The diagnostic model intercept, biomarker coefficients, univariable and multivariable logistic regression estimates, training-cohort cutoff, number of bootstrap resamples, optimism-corrected area under the curve, calibration slope, and Brier score are summarized.Please click here to download this file.
Supplementary Table 5: Follow-up, landmark mortality, calibration, and decision-curve results for prognostic validation. Follow-up duration, survival events, median OS, and PFS by biomarker burden group; C-index improvement; optimism-corrected C-index; landmark cumulative mortality probabilities; external-validation Brier scores; calibration slopes; and decision-curve net benefit estimates are summarized.Please click here to download this file.
Discussion
This two-center study developed and externally validated a combined serum biomarker panel integrating CEA, SCC-Ag, and CA125 for diagnostic and prognostic assessment in ESCC. The combined panel outperformed each individual biomarker in distinguishing ESCC from non-malignant controls and retained acceptable discrimination in the external validation cohort. This finding is consistent with previous ESCC studies showing that serum tumor markers can provide clinically relevant diagnostic and prognostic information, although single-marker performance is often limited by biological overlap between malignant and non-malignant conditions23,24. The main contribution of this study is therefore the development of a reproducible three-marker workflow that integrates pretreatment diagnosis, clinicopathological correlation, and survival stratification into a single analytical framework.
The improved performance of the combined panel is biologically plausible because CEA, SCC-Ag, and CA125 reflect partially different tumor-related processes. SCC-Ag is closely associated with squamous epithelial malignancy and showed the strongest standalone diagnostic performance in this cohort. CEA may reflect tumor burden, invasive phenotype, and systemic malignant activity, whereas CA125 may capture broader inflammatory, serosal, or advanced-disease signals rather than ESCC-specific biology25,26. The moderate correlations among the three biomarkers suggest that the markers were related but not redundant, supporting joint modeling rather than reliance on a single circulating measurement.
High combined biomarker burden was associated with larger tumors, pT3–4 disease, lymph node metastasis, and TNM stage III–IV disease, indicating that the panel captured more than a binary diagnostic signal. This pattern is clinically relevant because the anatomical stage remains central to ESCC management, but patients within the same stage can still differ in tumor aggressiveness, systemic burden, and survival outcome27. A serum-based biomarker profile may therefore help refine pretreatment risk assessment, particularly when clinicians need additional information before surgery, definitive chemoradiotherapy, systemic treatment, or intensified follow-up. In survival analysis, high combined biomarker burden remained independently associated with poorer OS and PFS after adjustment for major clinicopathological variables, and the integrated model showed higher C-index and time-dependent AUCs than TNM stage alone28.
Compared with imaging-based, radiomics, gene-expression, or multi-omics models, the present panel has practical advantages but a narrower biological scope. Radiomics and transcriptomic models may capture spatial heterogeneity, tumor microenvironmental features, and molecular subtypes, and some have shown promising prognostic performance in ESCC29,30. However, these approaches often require standardized imaging protocols, advanced computational pipelines, high-quality tissue samples, sequencing platforms, or specialized bioinformatics support. By contrast, CEA, SCC-Ag, and CA125 are routinely measured in many clinical laboratories, are relatively inexpensive, and can be repeated during follow-up. The clinical value of the present panel, therefore, lies in its accessibility and workflow compatibility, not in its ability to replace imaging, pathology, molecular profiling, or TNM staging.
The calibration and decision-curve analyses support cautious clinical translation. The combined diagnostic model showed acceptable calibration in both the training and external validation cohorts, and decision-curve analysis suggested positive net benefit across clinically relevant threshold ranges. The integrated prognostic model also showed improved discrimination and acceptable calibration in external validation. These findings are important because models with high discrimination alone may still be poorly calibrated or clinically unhelpful31. By reporting AUC, C-index, calibration, Brier scores, and decision-curve results, this study provides a more complete evaluation of model performance than studies relying only on discrimination metrics or hazard ratios.
Several limitations should be acknowledged. Although the study included external validation, it was limited to two centers, and the validation cohort was smaller than the training cohort. Biomarker values were measured only at the pretreatment baseline, so longitudinal changes during neoadjuvant therapy, chemoradiotherapy, postoperative surveillance, or recurrence monitoring were not evaluated, although serial tumor-marker trends may provide additional prognostic information32. The serum panel was not directly compared with radiomics, gene expression, circulating tumor DNA, or other liquid biopsy models in the same patient population, and false-positive elevations may occur in inflammatory, benign, or comorbid conditions. In summary, the combined serum CEA, SCC-Ag, and CA125 panel provided better diagnostic discrimination than individual biomarkers, was associated with adverse clinicopathological features, and improved prognostic stratification when added to conventional clinical variables. Further multicenter validation, serial biomarker assessment, and direct comparison with imaging-based and molecular models are needed before routine clinical implementation.
Disclosures
The authors have nothing to disclose.
Acknowledgements
The authors thank the staff of the Department of Laboratory Medicine, Jiangsu Province Hospital of Chinese Medicine, Affiliated Hospital of Nanjing University of Chinese Medicine, and Nanhu Community Health Service Center, Nanjing, for their support in sample collection, laboratory testing, and data management.
Materials
| Name | Company | Catalog Number | Comments |
|---|---|---|---|
| Access CEA Calibrators | Beckman Coulter | 33205 | Calibration for serum CEA assay |
| Access CEA Quality Control | Beckman Coulter | 33029 | Daily internal quality control for serum CEA assay |
| Access CEA Reagent Pack | Beckman Coulter | 33200 | Serum CEA measurement on the UniCel DxI 800 Access Immunoassay System |
| Adjustable micropipette, 100–1000 µL | Eppendorf | 3123000063 | Serum aliquoting after centrifugation |
| ARCHITECT CA 125 II Calibrators | Abbott Diagnostics | 02K4502 | Calibration for serum CA125 assay |
| ARCHITECT CA 125 II Controls | Abbott Diagnostics | 02K4511 | Daily internal quality control for serum CA125 assay |
| ARCHITECT CA 125 II Reagent Kit | Abbott Diagnostics | 02K4529 | Serum CA125 measurement on the ARCHITECT i2000SR Immunoassay Analyzer |
| ARCHITECT i2000SR Immunoassay Analyzer | Abbott Diagnostics | i2000SR | Automated chemiluminescent microparticle immunoassay platform for SCC-Ag and CA125 testing |
| ARCHITECT SCC Calibrator | Abbott Diagnostics | 8D1801 | Calibration for serum SCC-Ag assay |
| ARCHITECT SCC Controls | Abbott Diagnostics | 8D1810 | Daily internal quality control for serum SCC-Ag assay |
| ARCHITECT SCC Reagent Kit | Abbott Diagnostics | 8D1828 | Serum SCC-Ag measurement on the ARCHITECT i2000SR Immunoassay Analyzer |
| Barcode label printer | Brady | BMP51 | Barcode labeling of serum aliquots and cryogenic vials |
| Blood collection needle | BD Biosciences | 367286 | Peripheral venous blood collection |
| Cryogenic storage box | Corning | 431131 | Organized storage of frozen serum aliquots |
| Cryogenic vial, 2.0 mL, external thread, self-standing | Corning | 430659 | Barcode-labeled serum aliquot storage at −80 °C |
| Data extraction form and predefined data dictionary | Study team | Not applicable | Standardized extraction of clinical, pathological, laboratory, and follow-up variables |
| dcurves package | R package | Version 0.4.0 | Decision curve analysis and clinical net-benefit estimation |
| Electronic medical record system | Participating hospitals | Not applicable | Extraction of demographic, clinical, treatment, and follow-up data |
| Filtered pipette tips, 100–1000 µL | Eppendorf | 30073594 | Contamination-controlled serum aliquoting |
| ggplot2 package | R package | Version 3.5.1 | Statistical visualization and figure preparation |
| IBM SPSS Statistics | IBM | Version 27.0 | Baseline comparisons and supplementary statistical checking |
| Laboratory information management system | Participating hospital laboratory | Not applicable | Retrieval and linkage of serum biomarker test records |
| mice package | R package | Version 3.16.0 | Multiple imputation by chained equations |
| nricens package | R package | Version 1.6 | Net reclassification improvement analysis |
| Pathology reporting system | Participating hospitals | Not applicable | Confirmation of ESCC diagnosis, benign pathology, tumor features, and staging-related variables |
| pROC package | R package | Version 1.18.5 | Receiver operating characteristic curve analysis and DeLong comparison |
| R statistical software | R Foundation for Statistical Computing | Version 4.3.2 | Statistical analysis, model construction, validation, and figure generation |
| Refrigerated centrifuge | Eppendorf | 5810 R | Serum separation by centrifugation at 1,500 x g for 10 min |
| rms package | R package | Version 6.8-1 | Calibration analysis, nomogram construction, and regression model support |
| Serum-separation blood collection tube, 5 mL | BD Biosciences | 367955 | Collection of fasting peripheral venous blood for serum biomarker testing |
| survival package | R package | Version 3.5-7 | Cox proportional hazards regression and survival analysis |
| survminer package | R package | Version 0.4.9 | Kaplan–Meier curve visualization |
| Telephone follow-up record form | Study team | Not applicable | Collection and verification of survival, recurrence, progression, and last-contact information |
| timeROC package | R package | Version 0.4 | Time-dependent receiver operating characteristic curve analysis |
| Ultra-low temperature freezer | Thermo Fisher Scientific | TSX60086A | Storage of serum aliquots at −80 °C |
| UniCel DxI 800 Access Immunoassay System | Beckman Coulter | DxI 800 | Automated chemiluminescent immunoassay platform for serum CEA testing |
References
- Bray F, et al. Global cancer statistics 2022: GLOBOCAN estimates of incidence and mortality worldwide for 36 cancers in 185 countries. CA Cancer J Clin. 2024;74(3):229-263.
- Huang Y, et al. Postoperative serum squamous cell carcinoma antigen and carcinoembryonic antigen predict overall survival in surgical patients with esophageal squamous cell carcinoma. Front Oncol. 2023;13:1263990.
- Pi Y, et al. Validation of serum cystatin SN detection for diagnosis and poor prognosis of esophageal squamous cell carcinoma. Front Oncol. 2024;14:1337707.
- Wang W, et al. A novel molecular and clinical staging model to predict survival for patients with esophageal squamous cell carcinoma. Oncotarget. 2016;7(39):63526-63536.
- Puli SR, et al. Staging accuracy of esophageal cancer by endoscopic ultrasound: A meta-analysis and systematic review. World J Gastroenterol. 2008;14(10):1479-1490.
- Li T, et al. ESCCPred: A machine learning model for diagnostic prediction of early esophageal squamous cell carcinoma using autoantibody profiles. Br J Cancer. 2024;131(5):883-894.
- Guo JC, et al. Protein-coding genes combined with long noncoding RNA as a novel transcriptome molecular staging model to predict the survival of patients with esophageal squamous cell carcinoma. Cancer Commun. 2018;38(1):4.
- Kosugi S, et al. Clinical significance of serum carcinoembryonic antigen, carbohydrate antigen 19-9, and squamous cell carcinoma antigen levels in esophageal cancer patients. World J Surg. 2004;28(7):680-685.
- Huang C, et al. Clinical significance of serum CA125, CA19-9, CA72-4, and fibrinogen-to-lymphocyte ratio in gastric cancer with peritoneal dissemination. Front Oncol. 2019;9:1159.
- Yang Y, et al. Clinical use of tumor biomarkers in prediction for prognosis and chemotherapeutic effect in esophageal squamous cell carcinoma. BMC Cancer. 2019;19(1):526.
- Wu LL, et al. Preoperative squamous cell carcinoma antigen and albumin serum levels predict the survival of patients with stage T1-3N0M0 esophageal squamous cell carcinoma: A retrospective observational study. J Cardiothorac Surg. 2020;15(1):115.
- Wu LL, et al. Prognostic modeling of patients undergoing surgery alone for esophageal squamous cell carcinoma: A histopathological and computed tomography based quantitative analysis. Front Oncol. 2021;11:565755.
- World Medical Association. World Medical Association Declaration of Helsinki: Ethical principles for medical research involving human participants. JAMA. 2025;333(1):71-74.
- Moons KGM, et al. Transparent Reporting of a Multivariable Prediction Model for Individual Prognosis or Diagnosis (TRIPOD): Explanation and elaboration. Ann Intern Med. 2015;162(1):W1-W73.
- Riley RD, et al. Calculating the sample size required for developing a clinical prediction model. BMJ. 2020;368:m441.
- Amin MB, et al., editors. AJCC Cancer Staging Manual. 8th ed. New York, NY: Springer; 2017.
- Rubin DB. Multiple Imputation for Nonresponse in Surveys. John Wiley & Sons; New York; 1987.
- DeLong ER, DeLong DM, Clarke-Pearson DL. Comparing the areas under two or more correlated receiver operating characteristic curves: A nonparametric approach. Biometrics. 1988;44(3):837-845.
- Vickers AJ, Elkin EB. Decision curve analysis: A novel method for evaluating prediction models. Med Decis Making. 2006;26(6):565-574.
- Harrell FE Jr, Lee KL, Mark DB. Multivariable prognostic models: Issues in developing models, evaluating assumptions and adequacy, and measuring and reducing errors. Stat Med. 1996;15(4):361-387.
- Schoenfeld D. Partial residuals for the proportional hazards regression model. Biometrika. 1982;69(1):239-241.
- Royston P, Altman DG. External validation of a Cox prognostic model: Principles and methods. BMC Med Res Methodol. 2013;13:33.
- Mao W, et al. Clinical significance of preoperative serum tumor markers in esophageal squamous cell carcinoma. J Cancer Res Ther. 2014;10(Suppl):C179-C185.
- Hu J, et al. Prognostic significance of serum carcinoembryonic antigen and squamous cell carcinoma antigen in patients with esophageal squamous cell carcinoma undergoing radical esophagectomy. Transl Cancer Res. 2020;9(4):2460-2471.
- Mei X, et al. Predictive significance of CYFRA21-1, squamous cell carcinoma antigen and carcinoembryonic antigen for lymph node metastasis in patients with esophageal squamous cancer. Int J Biol Markers. 2019;34(2):200-204.
- Shimada H, et al. Prediction of survival with squamous cell carcinoma antigen in patients with resectable esophageal squamous cell carcinoma. Surgery. 2003;133(5):486-494.
- Rice TW, Patil DT, Blackstone EH. 8th edition AJCC/UICC staging of cancers of the esophagus and esophagogastric junction: Application to clinical practice. Ann Cardiothorac Surg. 2017;6(2):119-130.
- Qiao Y, et al. Tumor marker index based on preoperative SCC and CYFRA 21-1 is a significant prognostic factor for patients with resectable esophageal squamous cell carcinoma. Cancer Biomark. 2019;25(3):243-250.
- Yang M, et al. Computed tomography-based radiomics in predicting T stage and length of esophageal squamous cell carcinoma. Front Oncol. 2021;11:722961.
- Ye J, et al. Development and validation of a ferroptosis-related gene signature and nomogram for predicting the prognosis of esophageal squamous cell carcinoma. Front Genet. 2021;12:697524.
- Van Calster B, Vickers AJ. Calibration of risk prediction models: Impact on decision-analytic performance. Med Decis Making. 2015;35(2):162-169.
- Hong Z, et al. Prognostic value of carcinoembryonic antigen changes before and after operation for esophageal squamous cell carcinoma. World J Surg. 2022;46(11):2725-2732.