This study integrates public pediatric pneumonia transcriptomics, mouse lung single-cell RNA sequencing, Paeonia-derived compound screening, molecular docking, and molecular dynamics simulations to identify neutrophil-associated inflammatory targets and predicted catechin interactions for future validation.
Research Article
Effects of Paeonia-derived Catechin on Neutrophil-associated Inflammation in Pneumonia
In This Article
Summary
Abstract
Pneumonia in children is frequently accompanied by excessive inflammatory responses and immune dysregulation, which may lead to severe clinical outcomes. Catechin has shown anti-inflammatory activity in multiple disease settings, but its role and molecular mechanisms in pneumonia remain unclear. Public bulk RNA-sequencing data from pediatric pneumonia (GSE261482) and public mouse lung single-cell RNA-sequencing data from an experimental pneumonia model (GSE295484) were analyzed using weighted gene co-expression network analysis, differential expression analysis, cell-type annotation, and gene set enrichment analysis. Interactions between catechin and selected proteins were assessed using molecular docking and molecular dynamics simulations. A key gene module associated with pneumonia-related traits was identified, and 18 candidate genes, primarily enriched in inflammatory and immune-related pathways, were screened. Single-cell analysis showed that these genes were predominantly enriched in neutrophils and alveolar macrophages, with increased neutrophil proportions under inflammatory conditions. MMP9, PYGL, and GADD45A were selected as candidate genes. Docking and dynamics simulations supported stable predicted interactions between catechin and these selected proteins. Catechin may be associated with pneumonia-related inflammatory pathways by modulating neutrophil-associated pathways and interacting with key immune-related proteins. This study provides a systems-level view of catechin action in pneumonia and highlights potential targets for further experimental validation.
Introduction
Pneumonia is a common and potentially severe respiratory disease in children, primarily caused by infectious agents such as Mycoplasma pneumoniae. It represents a major component of community-acquired pneumonia and is associated with significant morbidity due to excessive inflammatory responses and immune dysregulation1,2. Increasing evidence suggests that inflammatory cytokines, including tumor necrosis factor-α (TNF-α) and interleukin-6 (IL-6), play critical roles in disease progression by promoting immune cell recruitment, tissue injury, and pulmonary dysfunction3. Despite advances in antimicrobial therapy, the molecular mechanisms driving inflammation in pediatric pneumonia remain incompletely understood4.
Flavonoids have attracted considerable attention due to their anti-inflammatory and antioxidant properties5. Catechin, a naturally occurring polyphenol widely found in tea and plant-derived foods, has been reported to attenuate oxidative stress and inflammatory responses in various disease models6. Previous studies have demonstrated that catechin can suppress pro-inflammatory signaling cascades, including MAPK and NF-κB pathways, and regulate cytokine expression, thereby alleviating inflammation and metabolic dysfunction7. However, most existing studies focus on metabolic or cardiovascular diseases, whereas the role of catechin in respiratory inflammatory diseases, particularly pneumonia, remains underexplored. In addition, the molecular targets and mechanisms underlying catechin-mediated protection in pneumonia remain unclear.
This study aimed to investigate the potential molecular mechanisms of catechin in pneumonia. It was hypothesized that catechin could attenuate inflammatory responses by interacting with key proteins and signaling pathways involved in immune regulation. To test this hypothesis, network pharmacology, molecular docking, molecular dynamics simulation, and single-cell RNA sequencing analyses were integrated to systematically identify candidate genes and evaluate their interactions with catechin. Immune cell distribution and gene expression patterns were further analyzed to explore the role of neutrophils and macrophages in disease progression.
The results showed stable predicted binding between catechin and selected proteins, including PYGL, MMP9, and GADD45A, and maintained structural stability throughout molecular dynamics simulations. In addition, single-cell analysis revealed significant alterations in immune cell proportions, particularly neutrophils, under inflammatory conditions. These findings suggest that catechin may be associated with anti-inflammatory mechanisms involving immune cell function and key signaling pathways. This study provides a systems-level view of potential catechin-associated mechanisms in pneumonia and supports further validation of catechin as a candidate compound for inflammatory respiratory disease research.
Protocol
This study involved secondary analysis of publicly available, de-identified datasets from the Gene Expression Omnibus database. No new human participants, animal experiments, or clinical samples were recruited, collected, or generated for this study. Ethical approval and informed consent for the original datasets were the responsibility of the original data-generating studies. Therefore, additional ethics committee approval was not required for the present secondary analysis.
Data collection and preprocessing
Bulk RNA sequencing (RNA-seq) data were obtained from the Gene Expression Omnibus (GEO) dataset GSE2614828. The expression matrix used in this study contained 177 whole-blood samples, including 139 pediatric pneumonia samples and 38 healthy control samples. Available metadata included sex, etiological classification, collection tube, batch, and disease condition. Pneumonia samples were annotated as definitive bacterial (DB), definitive viral (DV), probable bacterial (PB), probable viral (PV), or unknown (U) according to the original dataset annotation.
Single-cell RNA sequencing (scRNA-seq) data were obtained from the GEO dataset GSE2954849, which was derived from lung tissues of C57BL/6 wild-type mice in an experimental pneumonia model. The dataset included neonatal mice (PND05) and juvenile mice (PND12) exposed to room air, PBS, or E. coli and collected at 48 h or 96 h post aspiration.
Weighted gene co-expression network analysis (WGCNA)
For co-expression network construction, the expression matrix was first filtered to remove genes with low expression. After low-expression genes were removed, variability was assessed using median absolute deviation (MAD). The 5,000 genes with the highest MAD values were carried forward for weighted gene co-expression network analysis (WGCNA) in R. A soft-thresholding power of 15 was applied because it met the scale-free topology criterion of R2> 0.8. This threshold was used to construct the weighted adjacency matrix, which was subsequently transformed into a topological overlap matrix (TOM). Gene modules were then detected from the TOM-based hierarchical clustering tree. To identify modules related to pneumonia-associated traits, module eigengenes were calculated and tested for correlation with disease status and etiology.
Differential expression analysis
The pneumonia and healthy control groups were compared using the limma R package to identify differentially expressed genes. Multiple testing correction was performed using the Benjamini-Hochberg method. Genes were retained as differentially expressed genes only when both thresholds were met: |log2 fold change| > 1 and adjusted p-value < 0.05.
Identification of Paeonia-derived active compounds and target prediction
To systematically identify bioactive compounds in Paeonia and their potential biological targets, a multi-database integration strategy was employed to ensure reliability and comprehensiveness, following established network pharmacology frameworks. First, active compounds of Paeonia were retrieved from the Traditional Chinese Medicine Systems Pharmacology Database (TCMSP, https://tcmsp-e.com) and other public databases, including ETCM and literature sources. Compounds were screened based on pharmacokinetic parameters, including oral bioavailability (OB ≥ 30%) and drug-likeness (DL ≥ 0.18), to identify candidate bioactive ingredients.
Potential protein targets were predicted using complementary ligand-based approaches. SwissTargetPrediction (http://www.swisstargetprediction.ch) was used to identify likely human targets by comparing compound structures with ligands of known activity, and only predictions with a probability ≥ 0.1 were retained. To broaden target coverage, the Similarity Ensemble Approach (SEA, http://sea.bkslab.org) was also used to screen for possible off-target associations across protein families, including interactions not captured by canonical target predictions. To further complement ligand-based prediction, the PharmMapper Server (http://lilab.ecust.edu.cn/pharmmapper/) was utilized for reverse pharmacophore mapping against a comprehensive human protein database, and targets with normalized fit scores ≥ 0.7 were selected. Additionally, experimentally validated compound–target interactions were collected from public databases, including DrugBank and BindingDB, to improve the reliability of target identification. All predicted targets were subsequently standardized to official gene symbols using the UniProt database (https://www.uniprot.org), with the organism restricted to “Homo sapiens.” Duplicate entries were removed to ensure data accuracy. The integrated target set was defined as the union of all predicted and validated targets for Paeonia, representing the potential molecular basis of its pharmacological effects. Because catechin was identified as one of the Paeonia-derived active compounds and has well-documented anti-inflammatory activity, it was selected as the representative compound for subsequent molecular docking and molecular dynamics simulations.
Functional enrichment analysis
Functional enrichment was assessed for Gene Ontology (GO) biological processes and Kyoto Encyclopedia of Genes and Genomes (KEGG) pathways using the clusterProfiler R package. Enriched terms were retained when the false discovery rate (FDR) was < 0.05.
Single-cell RNA sequencing analysis and downstream analysis
Single-cell RNA sequencing data were processed in Seurat. The processed GSE295484 matrix was used for downstream analysis, and no additional cell-level filtering was applied after its import. The processed matrix contained 90,883 cells and 26,511 genes. Quality control plots used reference thresholds of 200 and 8,000 detected genes per cell and 1.4% mitochondrial reads. The data were normalized, scaled, and subjected to principal component analysis (PCA). Cell clustering was then performed, and uniform manifold approximation and projection (UMAP) was used to visualize the cell populations in reduced-dimensional space. Cell identities were assigned according to canonical marker genes. Marker genes were identified using FindAllMarkers with only.pos = TRUE, min.pct = 0.25, and logfc.threshold = 0.25.
To evaluate the activity of candidate gene sets at the single-cell level, AUCell analysis was performed using the AUCell R package. Cells were scored according to the expression of predefined gene signatures, and the enrichment patterns were visualized on UMAP plots. For GSE295484, the proportions of immune cell populations, including alveolar macrophages and neutrophils, were calculated across room air, PBS, and E. coli groups at 48 h and 96 h post-aspiration. Differences between groups were assessed using non-parametric statistical tests. Neutrophil marker genes were identified from the single-cell dataset and intersected with previously identified candidate genes to obtain key neutrophil-associated genes for further analysis.
Molecular docking
Molecular docking was performed using AutoDock Vina, with receptor and ligand preparation conducted using AutoDock Tools. The crystal structures of target proteins were obtained from the Protein Data Bank (PDB), including GADD45A (PDB ID: 2KG4), MMP9 (PDB ID: 6ESM), and PYGL (PDB ID: 3DDS). Protein structures were processed before docking by deleting water molecules and co-crystallized ligands. Polar hydrogen atoms were then added, and Gasteiger charges were assigned.
The three-dimensional catechin structure was obtained from PubChem and prepared in AutoDock Tools. AutoDock Vina was then used to dock catechin with each target protein and assess the predicted binding affinity and interaction pattern. The docking grid box parameters were as follows: GADD45A-catechin, center_x = 0.131, center_y = -0.002, center_z = -0.018, size_x = 47.25, size_y = 47.25, size_z = 47.25; MMP9-catechin, center_x = -0.434, center_y = 43.036, center_z = 14.868, size_x = 47.25, size_y = 47.25, size_z = 47.25; PYGL-catechin, center_x = 88.408, center_y = -80.795, center_z = 105.959, size_x = 100.45, size_y = 100.45, size_z = 100.45.
Molecular dynamics simulation
The AMBER14SB force field was used for the protein components. Ligand parameters were generated with the GAFF2 force field through sobtop_1.0 (dev3.1), and RESP charges were assigned. TIP3P water was used to solvate each protein–ligand complex in a cubic simulation box. The addition of Na⁺ and Cl⁻ ions helped neutralize the system and achieve an ionic concentration of 0.15 M. The particle mesh Ewald (PME) method was used for long-range electrostatic interactions with a 1 nm cutoff. Bond constraints were applied using the LINCS algorithm. To eliminate steric clashes, energy minimization was performed using steepest-descent and conjugate-gradient methods.
After equilibration, production MD simulations were performed under NPT conditions at 310 K and 1 bar, controlled by the Nosé–Hoover thermostat and Parrinello–Rahman barostat. Each simulation was run for 100 ns with a 2 fs time step.
Statistical analysis
All statistical analyses were performed using R software. Correlation analyses were conducted using Pearson or Spearman methods as appropriate. Group comparisons were performed using non-parametric tests, including the Kruskal–Wallis test. A p-value < 0.05 was considered statistically significant.
Results
Identification of a key gene module associated with pediatric pneumonia by WGCNA
To identify gene modules associated with pediatric pneumonia, WGCNA was performed on whole-blood transcriptomic data from patients with pneumonia and healthy controls. Sample clustering analysis revealed no obvious outliers, indicating good data quality for subsequent analysis (Figure 1A). PCA further demonstrated a clear separation trend between pneumonia and healthy groups, suggesting distinct transcriptomic profiles between conditions (Figure 1B). To construct a scale-free network, genes were ranked by median absolute deviation, the top 5,000 genes were selected for network construction, and the soft-thresholding power was set to 15 based on the criterion of scale-free topology fit index (R2 > 0.8) while maintaining relatively low mean connectivity (Figure 1C). Using this threshold, hierarchical clustering identified multiple gene modules with distinct expression patterns (Figure 1D). Module–trait relationship analysis revealed that several modules were significantly correlated with clinical phenotypes. Notably, the blue module showed a strong correlation with both disease status (pneumonia vs. healthy) and etiological classification, suggesting its potential role in disease progression and host response (Figure 1E).
Furthermore, scatter plot analysis of module membership versus gene significance within the blue module demonstrated a strong positive correlation (cor = 0.6, p = 2.1e−35), indicating that genes highly connected within the module were also strongly associated with the clinical trait (Figure 1F).
Association of the blue module with bacterial pneumonia etiology
To further investigate gene expression differences across pneumonia etiologies, WGCNA was performed using multiple clinical classifications, including controls (C), definitive bacterial (DB), definitive viral (DV), probable bacterial (PB), probable viral (PV), and unknown (U) groups. Module–trait relationship analysis revealed that several modules exhibited significant correlations with specific etiological subtypes. Notably, the blue module showed the strongest positive correlation with the DB group, suggesting its potential involvement in host responses specific to bacterial infection (Figure 2A).
The gene clustering dendrogram and corresponding module assignment further confirmed the robustness of module construction and the clear separation of gene clusters (Figure 2B). Within the blue module, analysis of module membership versus gene significance demonstrated a significant positive correlation (cor = 0.41, p = 7.8e−14), suggesting that highly connected genes within this module were also strongly associated with the etiological trait (Figure 2C).
Additionally, comparison of module eigengene expression across different etiological groups revealed significant differences in the blue module (Kruskal–Wallis test, p = 1.5e−13). Specifically, the blue module exhibited elevated expression in the bacterial pneumonia groups, particularly in the DB subgroup, compared to other etiological categories (Figure 2D).
Eighteen Paeonia-derived compound-related candidate genes associated with pediatric pneumonia identified by integration analysis
To identify candidate genes associated with pediatric pneumonia and potential Paeonia-associated targets, differential expression analysis was first performed between pneumonia patients and healthy controls. Using these criteria, 1,110 differentially expressed genes (DEGs) were identified between pneumonia and healthy control samples, including 524 upregulated and 586 downregulated genes. The 524 upregulated DEGs are provided in Supplementary Table S1 (also see Figure 3A). To further refine key genes, pneumonia-related DEGs were intersected with genes associated with the DB phenotype and predicted targets of Paeonia. This integrative analysis yielded 18 overlapping genes, suggesting their potential roles in disease progression and Paeonia-associated responses (Figure 3B).
A compound–target interaction network was constructed to visualize the relationships between active components of Paeonia and the identified candidate genes, revealing extensive connectivity between compounds and targets (Supplementary Table S2 and Figure 3C). To explore the biological functions of these 18 genes, functional enrichment analyses were performed. GO biological process enrichment linked the candidate genes mainly to immune and inflammatory functions, including inflammatory-response regulation, peptide hormone response, positive regulation of reactive oxygen species metabolism, and regulation of type II interferon–mediated signaling (Figure 3D). KEGG analysis further showed that the genes were enriched in inflammation- and immune-related pathways, such as the IL-17 and NF-κB signaling pathways, as well as metabolic and endocrine-related pathways, including glucagon signaling and steroid hormone biosynthesis (Figure 3D).
Enrichment of candidate genes in neutrophils and alveolar macrophages in single-cell transcriptomic analysis
To investigate the cellular distribution of candidate genes in an experimental pneumonia context, the mouse lung scRNA-seq dataset GSE295484 was analyzed. Quality control analysis was performed to evaluate data reliability. The distributions of detected gene numbers, UMI counts, and the percentages of mitochondrial and ribosomal genes indicated overall high-quality single-cell data in the processed matrix (Figure 4A). Scatter plots showed the reference thresholds for gene detection and mitochondrial content used in quality-control visualization (Figure 4B).
After normalization and dimensionality reduction, cells were clustered and visualized using UMAP. Distinct cell populations were identified, including neutrophils, alveolar macrophages, monocytes, epithelial cells, and other immune and stromal cell types, demonstrating the cellular heterogeneity of the lung microenvironment during pneumonia (Figure 4C). To assess the activity of the 18 candidate genes at the single-cell level, AUCell analysis was performed. The results showed that the gene signature was predominantly enriched in neutrophils and alveolar macrophages, as indicated by higher AUC scores in these cell populations (Figure 4D).
Inflammatory genes associated with Paeonia-derived compound targets in a mouse bacterial pneumonia model
To further investigate immune-cell dynamics in the mouse experimental pneumonia model, the proportions of alveolar macrophages and neutrophils were analyzed across room air, PBS, and E. coli groups at 48 h and 96 h post-aspiration. At 48 h, alveolar macrophages showed a marked decrease under E. coli infection compared to air and PBS conditions, whereas neutrophils exhibited a substantial increase in cell proportion (Figure 5A). A similar trend was observed at 96 h, with neutrophil proportions remaining elevated in response to E. coli stimulation, whereas alveolar macrophages showed comparatively lower levels. These results indicate a prominent expansion of neutrophils during bacterial infection. To explore the functional characteristics of neutrophils, neutrophil marker genes were identified, and functional enrichment analysis was performed. KEGG enrichment associated the neutrophil marker genes with inflammatory signaling, including the TNF, MAPK, and C-type lectin receptor pathways (Figure 5B). GO biological process terms were also concentrated in immune-response functions, such as leukocyte migration, leukocyte cell–cell adhesion, positive regulation of defense response, and response to molecules of bacterial origin (Figure 5B). To identify key genes linking neutrophil activity, pneumonia, and Paeonia targets, neutrophil marker genes were intersected with the previously identified 18 candidate genes. This analysis yielded three overlapping genes: MMP9, PYGL, and GADD45A (Supplementary Table S3 and Figure 5C). Finally, single-cell gene expression visualization showed that these three genes were predominantly expressed in neutrophil populations (Figure 5D), further supporting their potential roles in neutrophil-mediated inflammatory responses.
Predicted binding affinity of catechin to selected proteins in molecular docking
To further evaluate potential catechin-protein interactions, molecular docking analysis was performed between the selected proteins (MMP9, PYGL, and GADD45A) and catechin, a Paeonia-derived active compound. The crystal structures of GADD45A, MMP9, and PYGL were obtained from the Protein Data Bank, and the 3D structure of catechin was retrieved from the PubChem database. Docking results suggested that catechin could bind to sites of all three selected proteins, with binding energies of −6.3 kcal/mol for GADD45A, −7.6 kcal/mol for MMP9, and −8.0 kcal/mol for PYGL (Figure 6). Among these selected proteins, catechin exhibited the strongest predicted binding affinity with PYGL, followed by MMP9 and GADD45A, suggesting a potential preferential interaction with a metabolism-related protein.
At the molecular level, catechin formed multiple hydrogen bonds and hydrophobic interactions with key amino acid residues in each protein. In GADD45A, catechin interacted with residues such as GLN33 and TRP135. In MMP9, stable hydrogen bonding was observed with residues including GLN227, TYR248, and HIS236. Similarly, in PYGL, catechin formed multiple hydrogen bonds with residues such as LYS554 and ASN631, contributing to binding stability. In addition to hydrogen bonding, interaction analysis revealed van der Waals forces and π-related interactions, indicating a multi-mode binding pattern that enhances the stability of the predicted ligand–protein complexes. Collectively, these results suggest that catechin can form stable predicted complexes with MMP9, PYGL, and GADD45A. However, the therapeutic relevance of these interactions requires further experimental validation.
Predicted stable interactions between catechin and selected proteins
Based on the docking poses obtained in molecular docking, 100 ns molecular dynamics simulations were performed to further evaluate the stability of the catechin-protein complexes. RMSD analysis showed that all three protein–ligand complexes reached equilibrium during the simulation period. Among them, the PYGL–catechin and MMP9–catechin complexes exhibited relatively stable RMSD fluctuations, while the GADD45A–catechin complex showed slightly higher fluctuations but remained within an acceptable range (Figure 7A). The Rg analysis indicated that all complexes maintained stable structural compactness throughout the simulation, with minimal variation over time (Figure 7B). Similarly, SASA analysis demonstrated stable exposure levels for all complexes, further supporting their structural stability (Figure 7C). Hydrogen bond analysis revealed persistent interactions between catechin and the selected proteins. The PYGL–catechin complex maintained a higher number of hydrogen bonds over time compared to MMP9 and GADD45A, suggesting stronger and more stable binding interactions (Figure 7D).
Residue-level flexibility was evaluated using RMSF. The results showed that most residues exhibited low fluctuation, with only a few regions displaying higher flexibility, indicating that ligand binding did not induce major structural instability in the proteins (Figure 7E). Collectively, these findings suggest that catechin forms stable predicted complexes with MMP9, PYGL, and GADD45A, with the strongest stability observed in the PYGL–catechin interaction. These results support stable predicted interactions between catechin and the selected proteins, providing computational evidence for further experimental validation.
Data Availability:
Publicly available datasets were analyzed in this study. The bulk RNA-seq dataset is available from the Gene Expression Omnibus (GEO) under accession number GSE261482 (https://www.ncbi.nlm.nih.gov/geo/query/acc.cgi?acc=GSE261482), and the mouse lung scRNA-seq dataset is available under accession number GSE295484 (https://www.ncbi.nlm.nih.gov/geo/query/acc.cgi?acc=GSE295484). Processed outputs used in the article are provided as Supplementary Table S1, Supplementary Table S2, and Supplementary Table S3.
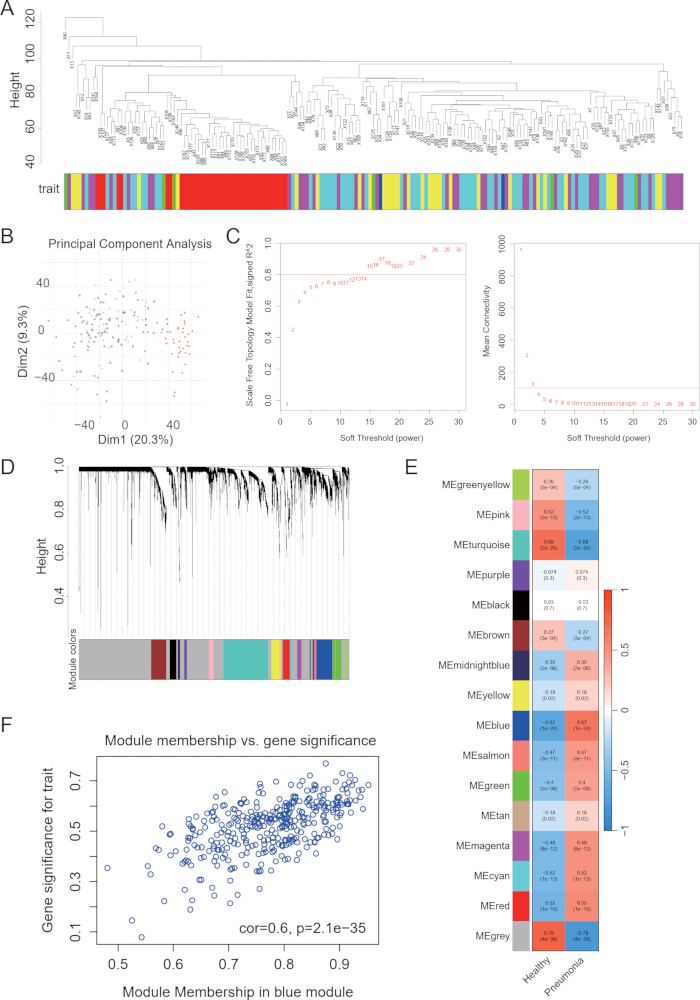
Figure 1. WGCNA construction and identification of disease-associated modules (A) Sample clustering was performed from the gene expression profiles, and the corresponding trait annotations are displayed beneath the dendrogram. (B) Principal component analysis shows the distribution of samples along the first two principal components. (C) The soft-thresholding power was evaluated using the scale-free topology fit index and mean connectivity. (D) Genes were clustered according to topological overlap, and module assignments are indicated by color. (E) Module eigengene correlations with clinical traits are shown as a heatmap. (F) The relationship between module membership and gene significance is shown for genes in the blue module. Please click here to view a larger version of this figure.
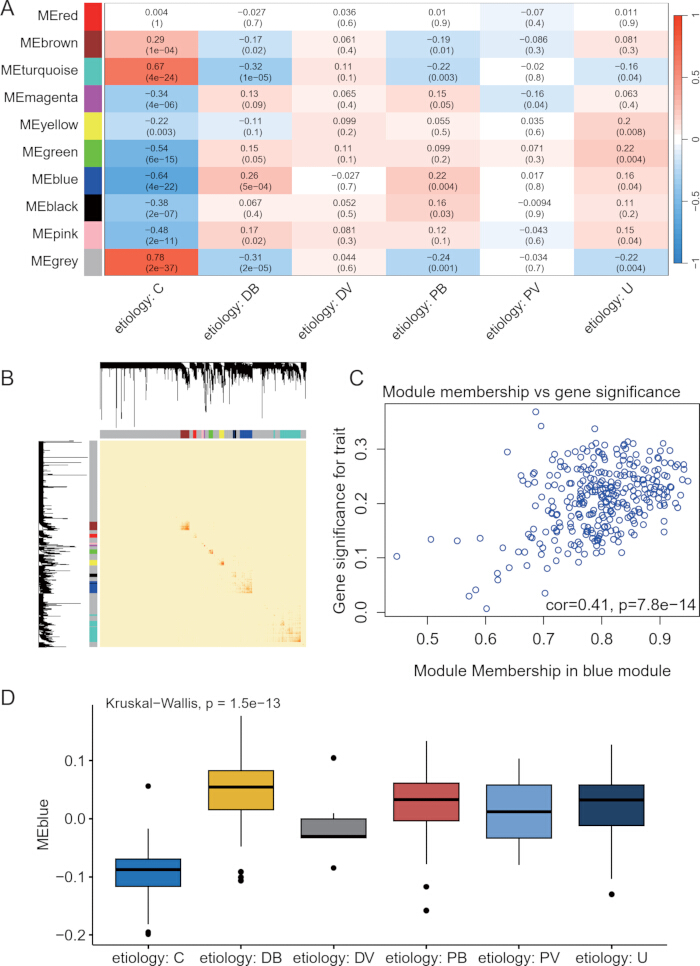
Figure 2. WGCNA analysis based on pneumonia etiology. (A) Module eigengene correlations are shown for etiology groups, including control, definitive bacterial, definitive viral, probable bacterial, probable viral, and unknown. (B) Gene modules were assigned from the topological-overlap-based clustering dendrogram. (C) Module membership and gene significance are plotted for the blue module. (D) Blue module eigengene expression is compared across etiology groups. Abbreviations: WGCNA = weighted gene co-expression network analysis; C = control; DB = definitive bacterial; DV = definitive viral; PB = probable bacterial; PV = probable viral; U = unknown. Please click here to view a larger version of this figure.
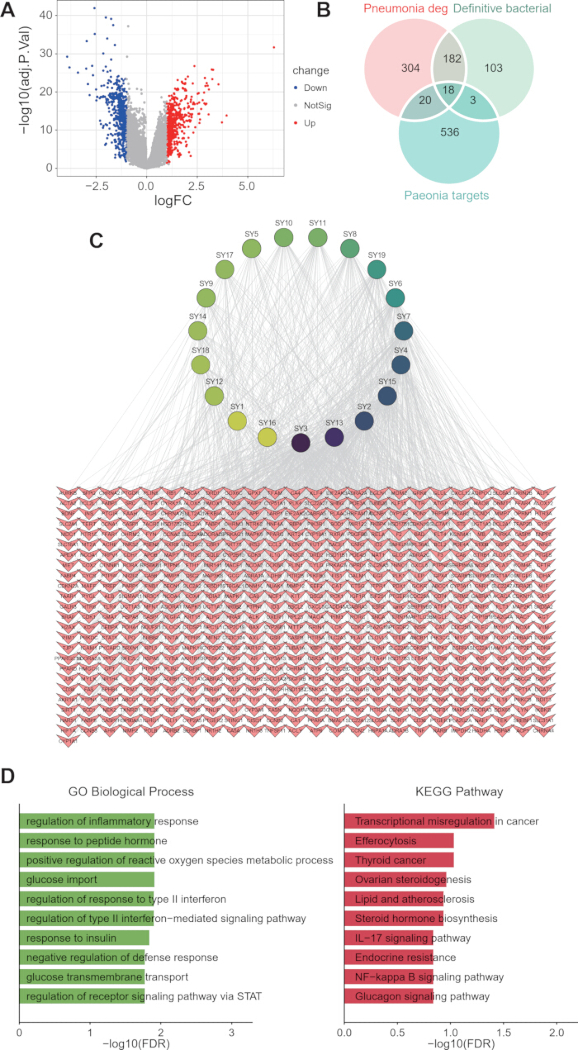
Figure 3. Identification and functional analysis of candidate genes. (A) Volcano plot showing differentially expressed genes between pneumonia and control samples. (B) Venn diagram showing the overlap among pneumonia DEGs, definitive bacterial-related genes, and Paeonia target genes. (C) Compound–target interaction network between active components of Paeonia and candidate genes. (D) Bar plots showing Gene Ontology biological process enrichment (left) and KEGG pathway enrichment (right) for the overlapping genes. Please click here to view a larger version of this figure.
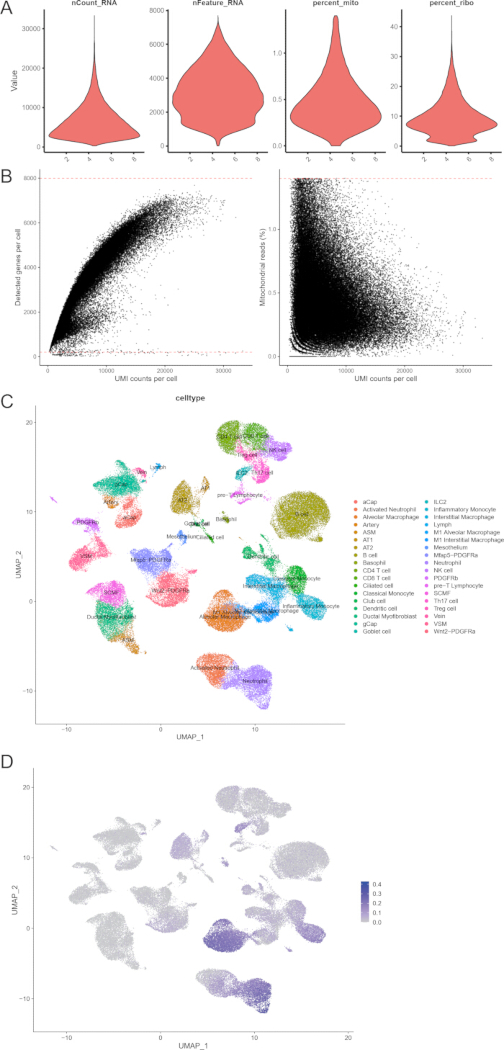
Figure 4. Single-cell transcriptomic analysis of pneumonia. (A) Violin plots summarize quality control metrics, including nCount_RNA, nFeature_RNA, mitochondrial gene percentage, and ribosomal gene percentage. (B) Scatter plots showing relationships between UMI counts, detected genes per cell, and mitochondrial gene percentage. (C) UMAP visualization of cell clusters annotated by cell types. (D) UMAP plot showing AUCell scores for the candidate gene signature across single cells. Please click here to view a larger version of this figure.
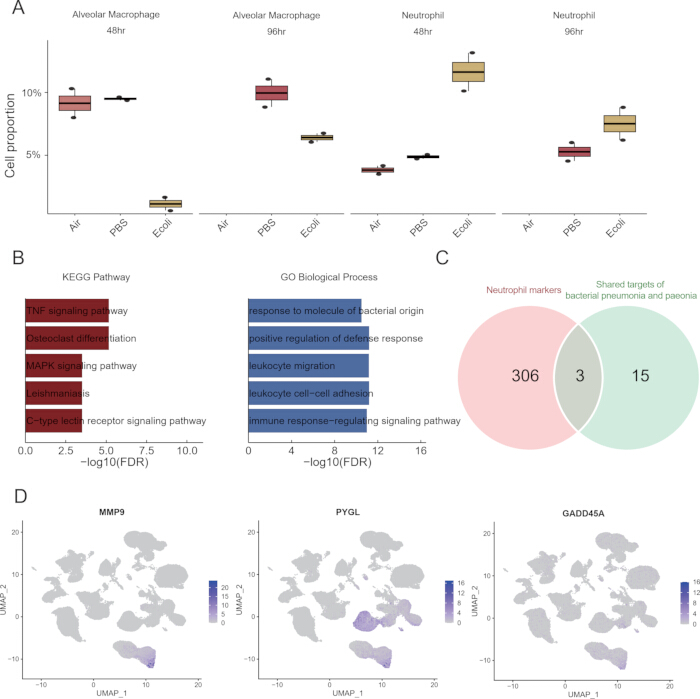
Figure 5. Neutrophil dynamics and identification of key genes. (A) Boxplots showing cell proportions of alveolar macrophages and neutrophils under different conditions (air, PBS, and E. coli) at 48 h and 96 h. (B) Bar plots showing KEGG pathway enrichment (left) and GO biological process enrichment (right) for neutrophil marker genes. (C) Venn diagram showing the overlap between neutrophil marker genes and shared targets of bacterial pneumonia and Paeonia. (D) UMAP plots showing the expression patterns of MMP9, PYGL, and GADD45A across cell populations. Please click here to view a larger version of this figure.
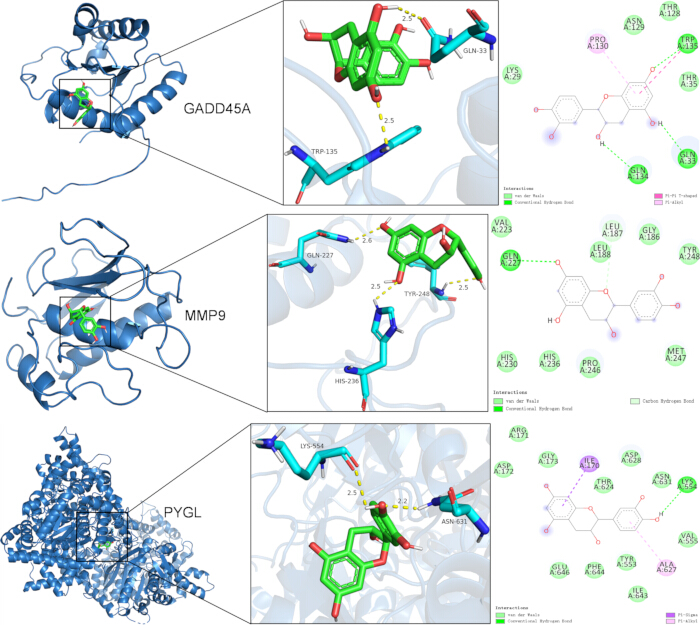
Figure 6. Molecular docking of catechin with selected proteins. Three-dimensional structures of protein–ligand complexes showing the binding of catechin to GADD45A (top), MMP9 (middle), and PYGL (bottom). Enlarged panels show the binding regions and contacts with key amino acid residues. The two-dimensional diagrams present hydrogen bonds and other interactions between catechin and the selected proteins. Please click here to view a larger version of this figure.
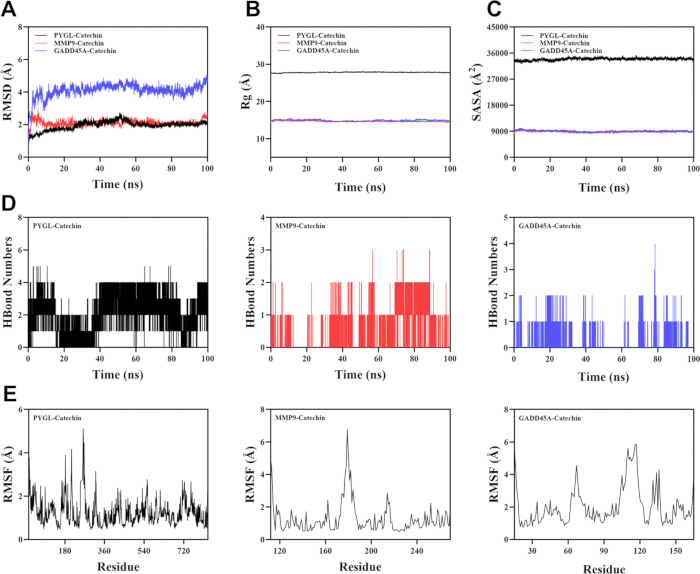
Figure 7. Molecular dynamics simulations of protein–ligand complexes. (A) Root mean square deviation of the complexes during the simulation. (B) Radius of gyration changes over time. (C) Solvent-accessible surface area during the simulation. (D) Hydrogen bond numbers between catechin and the target proteins over time. (E) Root mean square fluctuation of protein residues in each complex. Abbreviations: RMSD = root mean square deviation; Rg = radius of gyration; SASA = solvent-accessible surface area; RMSF = root mean square fluctuation. Please click here to view a larger version of this figure.
Supplementary Table S1. Upregulated differentially expressed genes in pediatric pneumonia versus healthy control samples, including gene symbols, log2 fold changes, P-values, adjusted P-values, and related limma statistics. Please click here to download this file.
Supplementary Table S2. Paeonia compound-target interaction table used for network analysis, including compound identifiers, compound names, and associated target genes. Please click here to download this file.
Supplementary Table S3. Single-cell marker gene table from GSE295484, including P-values, average log2 fold changes, expression percentages, adjusted P-values, cell cluster annotations, and gene symbols. Please click here to download this file.
Discussion
Pneumonia is a major global cause of illness and death in infants and young children, creating a substantial public health burden1. The pathogenesis of pediatric pneumonia is complex and involves multiple interconnected processes, including excessive inflammatory responses, oxidative stress, and dysregulation of immune and metabolic pathways2,10,11. Previous studies have suggested that uncontrolled activation of innate immune cells, particularly neutrophils and macrophages, contributes to lung tissue injury through the release of pro-inflammatory cytokines, proteolytic enzymes, and reactive oxygen species (ROS)12. Despite advances in antimicrobial and supportive therapies, effective strategies targeting these underlying molecular mechanisms remain limited. Therefore, identifying novel therapeutic agents that can modulate inflammation and restore immune homeostasis is of great importance.
Phytochemicals, especially catechins, have attracted increasing attention due to their well-documented anti-inflammatory, antioxidant, and immunomodulatory properties13,14,15. However, the precise molecular mechanisms by which catechin exerts its protective effects in pneumonia remain largely unclear. This study systematically explored potential catechin-associated mechanisms in pediatric pneumonia using an integrative approach combining transcriptomics, single-cell RNA sequencing, molecular docking, and molecular dynamics simulations.
Consistent with the initial hypothesis, the results demonstrated that the blue module identified by WGCNA was significantly associated with both disease status and etiology classification, suggesting that this module represents a core transcriptional program involved in pediatric pneumonia. Further integration of differential expression analysis and Paeonia target prediction revealed 18 overlapping genes, which were enriched in immune-related pathways, including inflammatory response, reactive oxygen species metabolism, and type II interferon signaling16,17. These findings further support the notion that dysregulated immune responses and oxidative stress are central drivers of disease progression.
Single-cell RNA sequencing analysis further revealed that the candidate gene set was predominantly enriched in neutrophils and alveolar macrophages, highlighting the central role of innate immune cells in the progression of pneumonia. Neutrophil proportions significantly increased under E. coli stimulation, particularly at 48 h and 96 h, indicating sustained activation during acute inflammation, which is consistent with their dual role in pathogen clearance and tissue damage via inflammatory mediators and ROS18. Further analysis identified three key genes—MMP9, PYGL, and GADD45A—as potential links between immune responses, metabolic regulation, and cellular stress. While MMP9 is involved in extracellular matrix remodeling and inflammatory infiltration19, and GADD45A regulates stress and immune responses, PYGL suggests a role for metabolic reprogramming in immune activation20,21. Molecular docking and dynamics simulations suggested stable predicted binding of catechin to these selected proteins, supported by favorable binding energies and stable RMSD, Rg, and SASA profiles, along with persistent hydrogen bonds and low RMSF values. These findings suggest that catechin may be associated with these inflammatory and metabolic targets, but direct regulatory effects require further experimental validation22.
In addition to its anti-inflammatory effects, catechin may also exert protective roles by modulating oxidative stress and metabolic balance. The enrichment of ROS-related pathways suggests that catechin may alleviate oxidative damage by enhancing antioxidant capacity, which is consistent with previous reports on the antioxidative properties of catechins. Furthermore, the involvement of metabolic enzymes such as PYGL highlights a potential role of catechin in regulating immunometabolism, an emerging concept in inflammatory diseases.
Several limitations of this study should be acknowledged. First, this study was primarily based on publicly available transcriptomic datasets and computational analyses, and the predicted mechanisms have not yet been experimentally validated. Although molecular docking and molecular dynamics simulations suggested stable interactions between catechin and the candidate target proteins, these findings do not prove functional inhibition, activation, or therapeutic efficacy. Further biochemical assays, cellular experiments, and in vivo studies are required to validate the regulatory effects of catechin on MMP9, PYGL, and GADD45A and to determine its therapeutic relevance in pneumonia. Second, the clinical information available for the pediatric pneumonia dataset was limited. The GSE261482 dataset provided whole-blood transcriptomic data from pediatric pneumonia patients and healthy controls, along with metadata including sex, etiological classification, collection tube, batch, and disease condition.
However, detailed clinical variables, including individual age, pneumonia severity, treatment status at sampling, and other disease-course information, were not fully available in the GEO metadata used in this study. Therefore, further stratified analyses according to clinical severity, treatment stage, or age subgroup could not be performed. Third, the bulk RNA-seq and single-cell RNA-seq datasets were derived from different biological contexts. GSE261482 was generated from whole-blood samples of pediatric patients, whereas GSE295484 was generated from lung tissues of C57BL/6 wild-type mice in an experimental pneumonia model. Therefore, the single-cell results should be interpreted as supportive cellular-context evidence for inflammatory cell populations and candidate gene distribution, rather than as direct validation in human pediatric pneumonia. In addition, the E. coli-induced mouse pneumonia model does not fully represent the heterogeneous etiologies of pediatric pneumonia, including bacterial, viral, probable bacterial, probable viral, and unknown causes.
Finally, the selection of MMP9, PYGL, and GADD45A was based on integrative bioinformatic screening and known biological relevance, but their precise roles in neutrophil-associated inflammation and catechin-mediated regulation remain to be confirmed. Future studies using pediatric clinical cohorts, human single-cell datasets, target-specific functional assays, and experimental pneumonia models are needed to validate these findings and clarify the translational potential of catechin.
In summary, this study suggests that catechin may be associated with neutrophil-related inflammatory responses and selected genes involved in immune regulation, oxidative stress, and metabolic pathways in pneumonia. Through an integrative analysis of bulk RNA sequencing, single-cell RNA sequencing, molecular docking, and molecular dynamics simulations, this study identified a disease-associated gene module and selected MMP9, PYGL, and GADD45A for catechin docking and simulation analyses. The enrichment of candidate genes in neutrophils and alveolar macrophages, together with the stable predicted interactions observed between catechin and the selected proteins, supports a potential mechanism for further experimental validation. Overall, these findings provide a systems-level perspective on potential catechin-associated mechanisms in pneumonia, but further experimental and clinical studies are needed to validate these observations and clarify their therapeutic relevance.
Disclosures
The authors have no conflicts of interest to declare.
Materials
| Name | Company | Catalog Number | Comments |
|---|---|---|---|
| AMBER14SB force field Type: Force field | Protein force field for molecular dynamics simulations | ||
| AUCell R package Type: R package | Single-cell gene-set activity scoring | ||
| AutoDock Tools Type: Software | Receptor and ligand preparation | ||
| AutoDock Vina Type: Software | Molecular docking | ||
| BindingDB Type: Database | BindingDB | Experimentally validated compound-target interactions; URL/version not provided in manuscript | |
| clusterProfiler R package Type: R package | GO and KEGG enrichment analysis | ||
| DrugBank Type: Database | DrugBank | Experimentally validated compound-target interactions; URL/version not provided in manuscript | |
| ETCM database Type: Database | ETCM | Paeonia active-compound screening; URL/version not provided in manuscript | |
| GAFF2 force field Type: Force field | Ligand force field for molecular dynamics simulations | ||
| GROMACS 2022 Type: Software | GROMACS | Molecular dynamics simulation | |
| GSE261482 Type: Public bulk RNA-seq dataset | Gene Expression Omnibus (GEO) | https://www.ncbi.nlm.nih.gov/geo/query/acc.cgi?acc=GSE261482 | Pediatric pneumonia and healthy control whole-blood expression data |
| GSE295484 Type: Public scRNA-seq dataset | Gene Expression Omnibus (GEO) | https://www.ncbi.nlm.nih.gov/geo/query/acc.cgi?acc=GSE295484 | Mouse lung single-cell RNA sequencing data from an experimental pneumonia model |
| limma R package Type: R package | Differential expression analysis | ||
| PharmMapper Server Type: Database/tool | PharmMapper | http://lilab.ecust.edu.cn/pharmmapper/ | Reverse pharmacophore mapping |
| Protein Data Bank (PDB) Type: Database | Protein Data Bank | Protein structures for GADD45A (2KG4), MMP9 (6ESM), and PYGL (3DDS) | |
| PubChem database Type: Database | PubChem | Three-dimensional catechin structure | |
| R software Type: Software | R Project | Statistical analyses | |
| Seurat R package Type: R package | Single-cell RNA sequencing quality control, normalization, clustering, UMAP visualization, and cell annotation | ||
| Similarity Ensemble Approach (SEA) Type: Database/tool | SEA | http://sea.bkslab.org | Potential off-target interaction prediction |
| sobtop_1.0 (dev3.1) Type: Software | Ligand parameter generation | ||
| SwissTargetPrediction Type: Database/tool | SwissTargetPrediction | http://www.swisstargetprediction.ch | Compound target prediction |
| TIP3P water model Type: Water model | Solvation of protein-ligand complexes | ||
| Traditional Chinese Medicine Systems Pharmacology Database (TCMSP) Type: Database | TCMSP | https://tcmsp-e.com | Paeonia active-compound screening |
| UniProt database Type: Database | UniProt | https://www.uniprot.org | Gene-symbol standardization |
| WGCNA R package Type: R package | Weighted gene co-expression network analysis |
References
- Chen L, Chen Y, Huang J, Zhang J. LncRNA LINC00707 serves as a sponge of miR-382-5p to alleviate lipopolysaccharide (LPS)-induced WI-38 cell injury through upregulating NKAP in infantile pneumonia. Autoimmunity. 2022;55(5):328-38.
- Li S et al. miRNA-302e attenuates inflammation in infantile pneumonia through the RelA/BRD4/NF-κB signaling pathway. Int J Mol Med. 2019;44(1):47-56.
- Kennedy II DE et al. Contribution of Puma to inflammatory resolution during early pneumococcal pneumonia. Front Cell Infect Microbiol. 2022;12:886901.
- Wang C et al. Suppressing neutrophil itaconate production attenuates Mycoplasma pneumoniae pneumonia. PLoS Pathog. 2024;20(11):e1012614.
- Shen N et al. Plant flavonoids: classification, distribution, biosynthesis, and antioxidant activity. Food Chem. 2022;383:132531.
- Peng X, McClements DJ, Liu X, Liu F. EGCG-based nanoparticles: synthesis, properties, and applications. Crit Rev Food Sci Nutr. 2025;65(12):2177-98.
- Li T et al. Synergistic anti-inflammatory effects of quercetin and catechin via inhibiting activation of TLR4-MyD88-mediated NF-κB and MAPK signaling pathways. Phytother Res. 2019;33(3):756-67.
- Viz-Lasheras S et al. A diagnostic host-specific transcriptome response for Mycoplasma pneumoniae pneumonia to guide pediatric patient treatment. Nat Commun. 2025;16(1):673.
- Michki SN et al. Age-dependent immune responses and resident cell dynamics in young mice following pneumonia. iScience. 2026;29(1):114219.
- Jin M et al. Catechin-functionalized cationic lipopolymer based multicomponent nanomicelles for lung-targeting delivery. Adv Mater. 2024;36(17):e2302985.
- Shin-Ya M et al. Effects of tea, catechins and catechin derivatives on Omicron subvariants of SARS-CoV-2. Sci Rep. 2023;13(1):16577.
- Zheng Q, Li J, Yang L. Systematic investigation of catechin/cyclodextrin encapsulated polymeric nanospheres for the treatment and nursing care of pediatric pneumonia-causing human pathogens. Microb Pathog. 2025;205:107524.
- Zhang Y et al. Anti-inflammatory effect of chlorogenic acid in Klebsiella pneumoniae-induced pneumonia by inactivating the p38MAPK pathway. Int J Med Microbiol. 2023;313(2):151576.
- Gleeson K, Reynolds HY. Life-threatening pneumonia. Clin Chest Med. 1994;15(3):581-602.
- Ross SM. Resveratrol: the anti-inflammatory effects of a phytochemical compound on pneumonia, respiratory syncytial virus, and severe acute respiratory syndrome (SARS-CoV-2). Holist Nurs Pract. 2023;37(2):110-2.
- Hu H et al. Hybrid biomimetic membrane coated particles-mediated bacterial ferroptosis for acute MRSA pneumonia. ACS Nano. 2023;17(12):11692-712.
- Dong L et al. A ROS-responsive nanoprodrug-engineered phage biotherapy for precision treatment of multidrug-resistant Gram-negative bacterial pneumonia. J Control Release. 2025;382:113708.
- Wiegman CH et al. Oxidative stress in ozone-induced chronic lung inflammation and emphysema: a facet of chronic obstructive pulmonary disease. Front Immunol. 2020;11:1957.
- Jiang T et al. Dual role of Baimao-Longdan-Congrong-Fang in inhibiting Staphylococcus aureus virulence factors and regulating TNF-α/TNFR1/NF-κB/MMP9 axis. Phytomedicine. 2025;139:156477.
- Zhang H et al. The attenuated Mycoplasma bovis strain promotes apoptosis of bovine macrophages by upregulation of CHOP expression. Front Microbiol. 2022;13:925209.
- Borella R et al. Metabolic reprograming shapes neutrophil functions in severe COVID-19. Eur J Immunol. 2022;52(3):484-502.
- Xu Y et al. Exosomal miR-155-5p drives widespread macrophage M1 polarization in hypervirulent Klebsiella pneumoniae-induced acute lung injury via the MSK1/p38-MAPK axis. Cell Mol Biol Lett. 2023;28(1):92.