This study evaluates the effects of Zuogui Pill on postmenopausal osteoporosis in ovariectomized rats using a three-by-three factorial design. The results support synergistic effects of Yin- and Yang-components on bone metabolism and associated EphB4/ephrinB2 pathway markers, although mechanistic evidence remains associative rather than causal.
Research Article
Zuogui Pill Modulates Osteoblast-Osteoclast Coupling in Ovariectomized Rats: A Three by Three Factorial Study
51 views
⸱
September 11th, 2026
* These authors contributed equally
In This Article
Summary
Abstract
Postmenopausal osteoporosis is driven by estrogen-deficiency-associated uncoupling of bone formation and resorption. This study quantified the independent and interactive effects of Zuogui Pill Yin-nourishing subformulations in an ovariectomized rat model and examined associations with the EphB4/ephrinB2/RhoA/alkaline phosphatase pathway. In accordance with ARRIVE 2.0, 130 specific pathogen-free female Sprague-Dawley rats were randomized to 13 groups (n=10/group), including nine groups in a three-by-three factorial design. Endpoints included P1NP, CTX-1, femoral bone mineral density measured by dual-energy X-ray absorptiometry (DXA), trabecular histology, and messenger ribonucleic acid and protein expression measured by reverse transcription quantitative polymerase chain reaction and Western blotting. The full formula (I2A2) was associated with higher P1NP, lower CTX-1, and higher BMD than the model group. Factorial analysis identified a Yin-Yang interaction between P1NP and BMD, supporting pharmacological synergy. Molecular changes were associated with increased EphB4/ephrinB2/ALP expression and reduced RhoA expression. These findings support an association between Zuogui Pill treatment, improved bone phenotypes, and modulation of pathway markers; causal pathway dependence requires inhibitor, knockdown, and co-culture validation.
Introduction
Postmenopausal osteoporosis (PMOP) affects a large population of women and is characterized by estrogen-deficiency-associated disruption of balanced bone formation and resorption1,2. The EphB4/ephrinB2 receptor-ligand system mediates osteoblast-osteoclast communication; EphB4 signaling supports osteoblast differentiation and alkaline phosphatase (ALP) activity, whereas ephrinB2 reverse signaling can restrain osteoclastogenesis through RhoA-related mechanisms3,4. Reduced coupling in estrogen-deficient bone provides a mechanistic rationale for evaluating interventions that affect both cellular arms of remodeling.
Current osteoporosis therapies, including antiresorptive and anabolic agents, reduce fracture risk but may be limited by adherence, cost, contraindications, rebound effects, or adverse events during long-term use5. Therefore, candidate treatments that improve bone formation while limiting excessive resorption remain scientifically relevant.
Zuogui Pill (ZGP; Zuo Gui Wan) is a classical multi-component prescription used in traditional Chinese medicine for kidney-essence deficiency, a theoretical pattern linked to bone weakness. The Yin-nourishing components include Rehmannia glutinosa (prepared root, Shu Di Huang, 24 g), Dioscorea opposita (rhizome, Huai Shan Yao, 12 g), Cornus officinalis (fruit, Shan Zhu Yu, 12 g), Lycium barbarum (fruit, Gou Qi Zi, 12 g), Chinemys reevesii plastron gelatin (plastron-derived gelatin, Gui Ban Jiao, 12 g), and Cyathula officinalis (root, Chuan Niu Xi, 9 g). The Yang-enhancing components include Cuscuta australis (seed, Tu Si Zi, 12 g) and Cervus elaphus antler gelatin (antler-derived gelatin, Lu Jiao Jiao, 12 g). In classical theory, the principle of seeking Yang within Yin predicts that Yang-enhancing herbs may potentiate a Yin-nourishing base rather than act as simple independent additives. Clinical evidence and preclinical studies have reported anti-osteoporotic activity of ZGP or ZGP-containing interventions, including effects on BMD, osteogenesis, and pharmacokinetic behavior6,7,8,9,10.
The novelty of this study lies in the formal three-by-three factorial separation of Yin-nourishing and Yang-enhancing components in Ovariectomized (OVX) rats, with simultaneous assessment of bone phenotypes and markers of the EphB4/ephrinB2/RhoA/ALP pathway. This design tests formula-compatibility theory more directly than studies that use only the complete prescription or a single comparator, while recognizing that pathway-marker changes remain associative unless mechanistically blocked or silenced11.
Protocol
All procedures in this study were approved by the Institutional Animal Care and Use Committee of Inner Mongolia Medical University (Approval No. YKD202404105) and were conducted in accordance with ARRIVE 2.012.
Study design
The study was performed at the animal experimental platform of Inner Mongolia Medical University. A three-by-three full factorial design was applied with two factors: Yin-nourishing base formulation (I; three dose levels: 0, 27, 54 g crude drug equivalent) and Yang-enhancing formulation (A; three dose levels: 0, 8, 16 g crude drug equivalent), yielding nine factorial cells plus four reference groups. The factorial design is shown in Table 1. I2A2 represents the complete ZGP formula at the clinical-equivalent dose. Dose conversion used the body surface area method (rat: human factor = 6.25)13.
Animals, randomization, and blinding
One hundred and thirty specific pathogen-free female Sprague-Dawley rats (6 months old, 220–250 g) were allocated by a computer-generated random number table. Allocation codes were placed in sequentially sealed envelopes by an investigator not involved in outcome assessment. Rats were housed 3–4 per ventilated cage under a 12 h light/dark cycle at 22 ± 2 oC and 50–60% humidity, with ad libitum water, standard rodent chow with documented calcium and phosphorus content, cage activity, and environmental enrichment. Molecular assays, histological scoring, image quantification, and densitometry were performed by investigators blinded to allocation. Sample size was determined by a priori power analysis, yielding n = 10 per group.
OVX model and drug treatment
Bilateral OVX was performed under inhaled isoflurane delivered by a precision vaporizer. Anesthesia was induced at 3–4% in oxygen and maintained at 1.5–2.5% through a nose cone. Adequate depth was confirmed by loss of pedal withdrawal and palpebral reflexes with stable respiration. OVX success was evaluated by the absence of vaginal estrous cycling at day 5 and BMD reduction at 12 weeks after surgery. After model validation, gavage treatment was administered for 8 weeks (1 mL/100 g/day). Decoctions were prepared by sequential water extraction at a rolling boil (100 °C, reflux), 10x volume for 2 h, followed by 8x volume for 1.5 h, filtered through four layers of medical gauze, and concentrated under reduced pressure to 0.968 g crude drug/mL. The concentrated extract was stored at 4 °C and used within 7 days of preparation. Positive controls were Gusukang granules (1.8 g/kg/day) and diethylstilbestrol (0.04 mg/kg/day). At termination, rats were deeply anesthetized with 5% isoflurane until loss of pedal and corneal reflexes, then exsanguinated and subjected to cervical dislocation. Death was confirmed by cessation of heartbeat and respiration. Carcasses and tissues were discarded as biological waste; chemical residues were disposed of as hazardous waste; and needles or blades were placed in approved sharps containers.
Outcome measures
Serum P1NP and CTX-1 were measured by sandwich ELISA (Jiyinmei)14. Femoral BMD was quantified by DXA. Trabecular histology was assessed by hematoxylin and eosin staining at 200x. Gene expression was assessed by RT-qPCR using the 2-ΔΔCt method, normalized to glyceraldehyde-3-phosphate dehydrogenase (GAPDH). Protein expression was assessed by Western blot and ImageJ quantification (see Table of Materials). Observed molecular weights and antibody catalog information are provided in Supplementary Table 1. Primer sequences were: EphB4 forward/reverse, 5'-CTAGACTCTTTCCTGCGGCT/GGGAACTTGTGTAGGTGGGA-3'; ephrinB2, 5'-CGGACAAGGCCTGGTACTAT/ACAGTTGAGCAGTGGGGTAT-3'; RhoA, 5'-GTTTATGTGCCCACGGTGTT/ACTATCAGGGCTGTCGATGG-3'; ALP, 5'-CGGACACAAGCATTCCCAGA/TGGTGGAGCTGAACAGGCTT-3'; GAPDH, 5'-ACAGCAACAGGGTGGTGGAC/TTTGAGGGTGCAGCGAACTT-3'.
Statistical analysis
Normality was assessed using the Shapiro-Wilk test, and variance homogeneity was assessed using the Levene test before parametric analysis. Data are expressed as mean ± SD, and all quantitative figure error bars denote SD. Two-way factorial ANOVA was applied to the nine factorial cells to estimate main effects and the I by A interaction, with partial eta-squared (ηp2) as the effect size. Pairwise comparisons across all 13 groups were performed using a one-way ANOVA with Bonferroni correction. Statistical analyses were performed in GraphPad Prism. Significance symbols are defined consistently as follows: *, **, ***, **** indicate p <0.05, p <0.01, p <0.001, p <0.0001 versus model; #, ##, ###, #### indicate the same thresholds versus full-formula ZGP.
Results
Model validation by vaginal cytology
OVX success was confirmed in all ovariectomized animals, as evidenced by loss of estrous cycling within 5 days after surgery (Figure 1A), whereas sham-operated animals retained a 4-day cycle (Figure 1B). At 12 weeks, DXA showed lower femoral BMD in the OVX model group than in sham controls (0.214 ± 0.020 vs. 0.281 ± 0.019 mg/cm3; Bonferroni-adjusted p < 0.001), supporting the establishment of the OVX-induced bone-loss model prior to treatment.
Bone mineral density
The full ZGP formula (I2A2) showed the highest BMD recovery among factorial subformulations and was statistically comparable to both positive controls (Table 2, Figure 2). All factorial subformulations increased BMD relative to the model group. High Yin-nourishing alone (I3A1: 0.253 mg/cm3) and High Yang-enhancing alone (I1A3: 0.243 mg/cm3) remained lower than full ZGP (I2A2: 0.307 mg/cm3), supporting an interaction rather than a simple dose effect.
Serum bone turnover markers
Compared with the model group, full-formula ZGP was associated with increased P1NP (+51%; 95% CI: 210.3–327.5 pg/mL; p <0.0001) and decreased CTX-1 (-16%; p <0.01), consistent with improved formation-resorption balance (Figure 3A,B). High-dose monotherapy arms produced higher absolute P1NP values in some comparisons, but the factorial pattern supported optimized combined activity rather than maximum single-arm dose response. Complete group-level data are in Table 3.
Factorial ANOVA and synergistic interaction
Two-way factorial ANOVA of the nine factorial cells identified significant main effects of Yin-nourishing and Yang-enhancing factors and significant I by A interaction terms across primary endpoints (Table 4). The interaction effect for P1NP (ηp2 = 0.74) suggests that Yang-enhancing components amplified the activity of Yin-nourishing components under these experimental conditions.
Bone density (model validation)
Femoral bone density was lower in the Model (OVX) group than in the Blank and Sham-operated groups, confirming successful induction of the OVX bone-loss phenotype prior to treatment, as shown in Figure 4.
EphB4/ephrinB2/RhoA/ALP expression
RT-qPCR analyses used biological samples from each group with technical triplicate reactions, and Western blot densitometry was performed on independent biological lysates (Figure 5 and Figure 6). Compared with the model group, full-formula ZGP was associated with higher EphB4 (0.498 ± 0.009 vs. 0.048 ± 0.002; p < 0.0001), ephrinB2 (0.411 ± 0.036 vs. 0.048 ± 0.003; p < 0.0001), and ALP (0.842 ± 0.019 vs. 0.090 ± 0.003; p < 0.0001), with lower RhoA (1.658 ± 0.028 vs. 7.332 ± 0.430; p < 0.0001). These molecular findings are interpreted as pathway-marker associations rather than proof of causal mediation.
Data Availability
The original data files used to generate the current study results are provided as a Supplementary Coding File accompanying this article
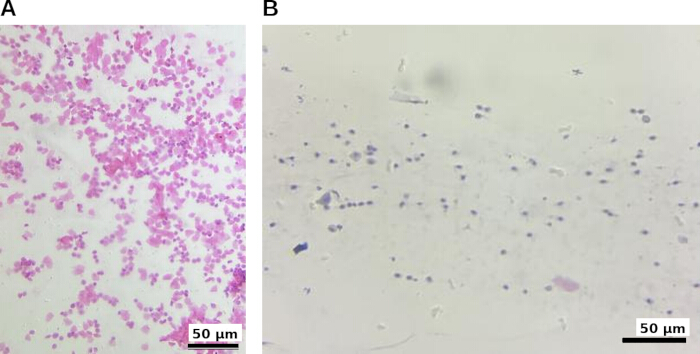
Figure 1. Representative vaginal cytology used to verify estrous cyclicity following ovariectomy (hematoxylin and eosin staining, 200x). (A) Representative vaginal smear from an ovariectomized rat showing persistent non-cycling cytology. (B) Representative vaginal smear from a sham-operated rat demonstrating normal estrous cyclicity. Please click here to view a larger version of this figure.
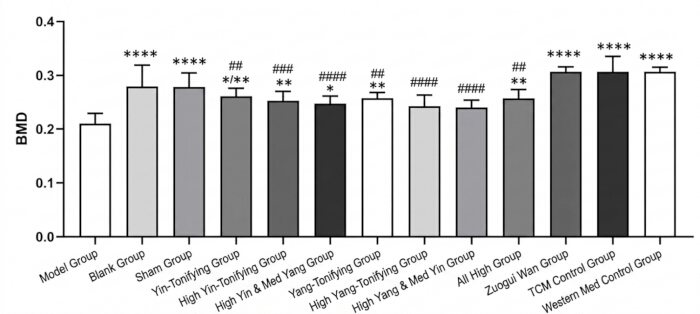
Figure 2. Femoral BMD across all groups. Error bars denote SD. Statistical symbols indicate Bonferroni-adjusted comparisons versus model or full-formula ZGP as defined in the Statistical analysis section. Please click here to view a larger version of this figure.
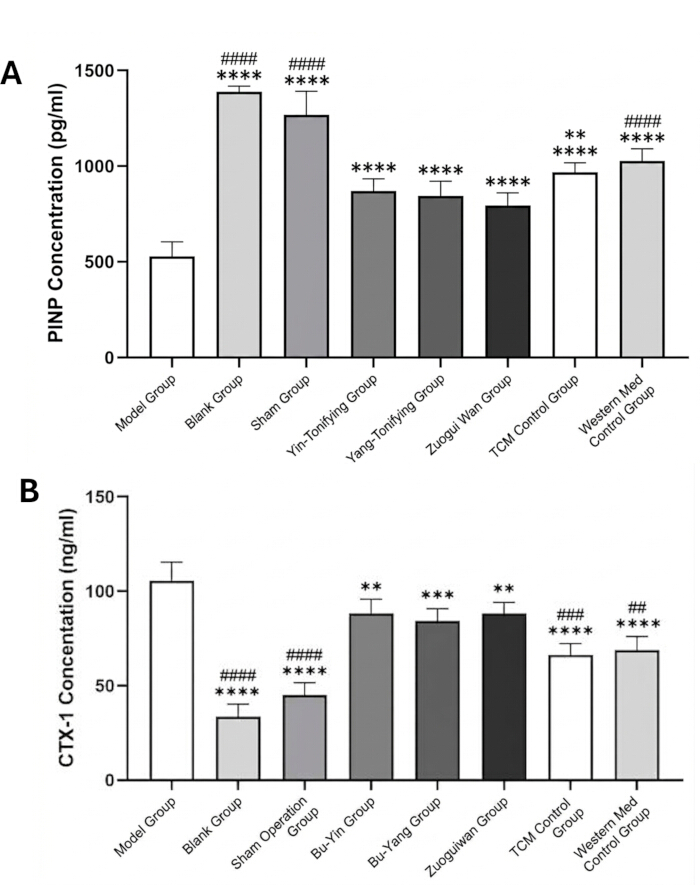
Figure 3. Serum bone turnover markers. (A) P1NP, a bone formation marker. (B) CTX-1, a bone resorption marker. Error bars denote SD. Statistical symbols indicate Bonferroni-adjusted comparisons relative to the model or the full-formula ZGP. Please click here to view a larger version of this figure.
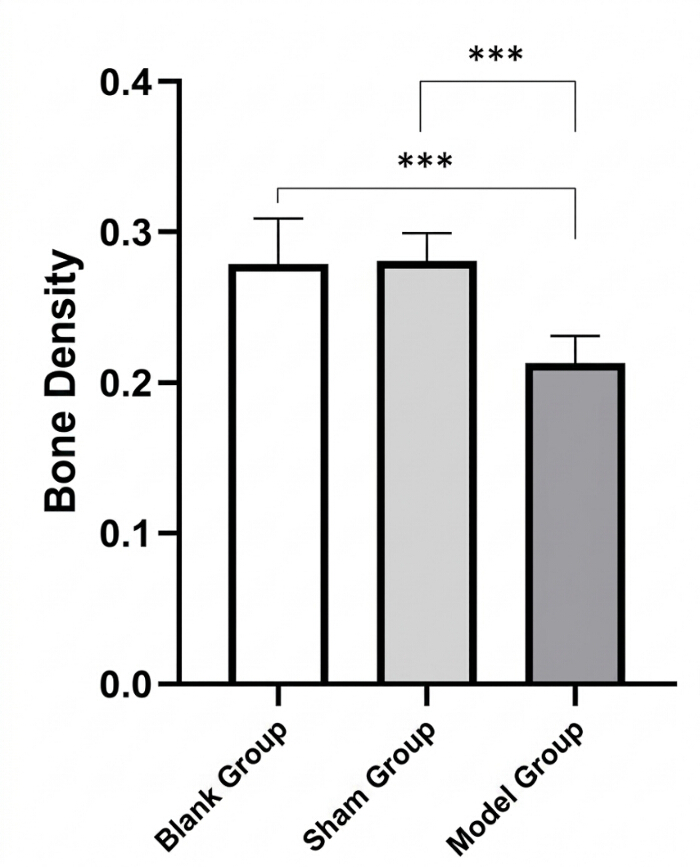
Figure 4. Femoral bone density confirming OVX-induced bone loss before treatment. Bar graph comparing femoral bone density (mg/cm3) among the Blank (non-ovariectomized, untreated), Sham-operated, and Model (OVX) groups at the pre-treatment model-validation time point. Bars represent mean ± SD (n = 10/group). *** = p < 0.001 vs. Blank and vs. Sham (one-way ANOVA with Bonferroni correction). Please click here to view a larger version of this figure.
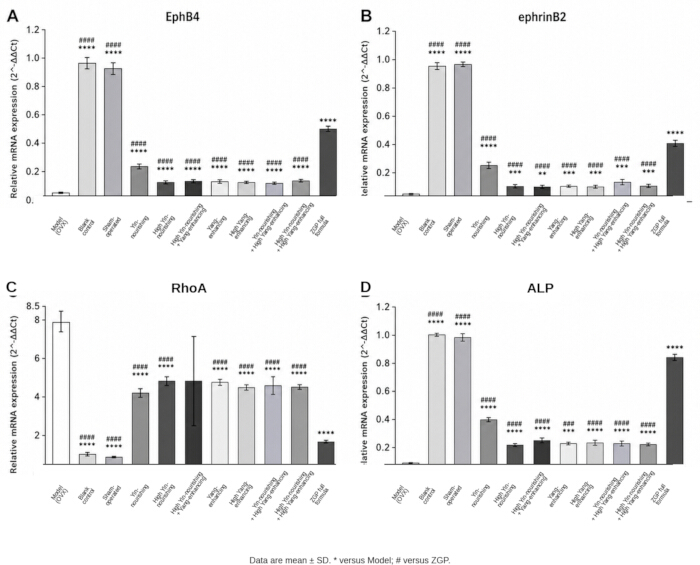
Figure 5. Relative mRNA gene expression. Expression levels of (A) EphB4 (B) ephrinB2 (C) RhoA (D) ALP using the 2^-ΔΔCt method normalized to GAPDH. qPCR used technical triplicate reactions for each biological sample. Error bars denote SD. Statistical symbols indicate Bonferroni-adjusted comparisons. Please click here to view a larger version of this figure.
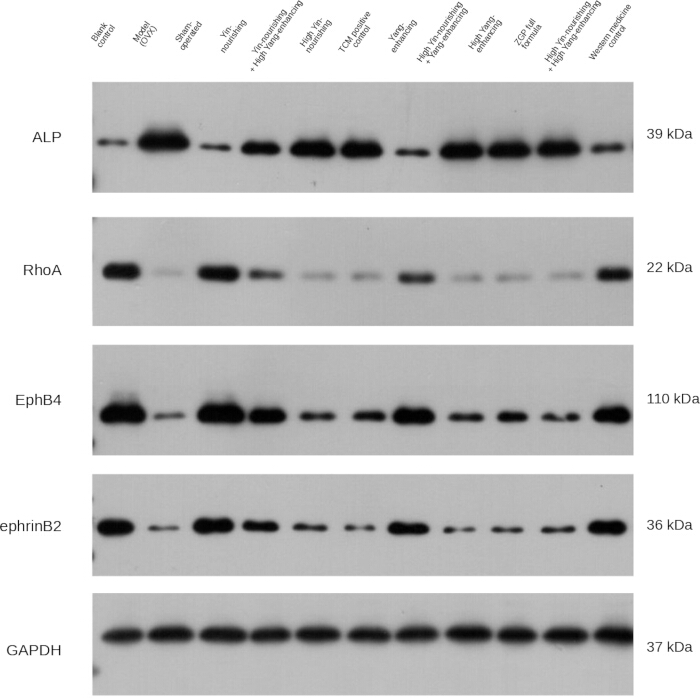
Figure 6. Western blot protein expression. Panels show representative immunoblots for EphB4, ephrinB2, RhoA, ALP, and GAPDH loading control, selected from independent biological samples. Densitometry was normalized to GAPDH using ImageJ. Observed molecular weights: EphB4, 110 kDa; ephrinB2, 36 kDa; RhoA, 22 kDa; ALP, 39 kDa; GAPDH, 37 kDa (see Supplementary Table 1). Please click here to view a larger version of this figure.
| Yin-nourishing factor (I) | ||||
| I₁ (0 g) | I₂ (27 g) | I₃ (54 g) | ||
| Yang-enhancing factor (A) | A₁ (0 g) | I₁A₁ (Model) | I₂A₁ (Yin) | I₃A₁ (Hi-Yin) |
| A₂ (8 g) | I₁A₂ (Yang) | I₂A₂ (ZGP†) | I₃A₂ (Hi-Yin+Yang) | |
| A₃ (16 g) | I₁A₃ (Hi-Yang) | I₂A₃ (Yin+Hi-Yang) | I₃A₃ (Full-Hi) | |
Table 1: Three by three factorial design and experimental groups. The table presents the 13 experimental groups arranged in a 3-by-3 factorial design of Yin-nourishing (I) and Yang-enhancing (A) dose levels, plus 4 reference groups. †I₂A₂ = full Zuogui Pill formula at clinical-equivalent dose. Dose conversion using the body surface area method (rat : human = 6.25).
| Group | Factorial Cell | BMD (mg/cm³, x̄ ± SD) | vs. Model |
| Blank control | — | 0.279 ± 0.030 | **** |
| Sham-operated | — | 0.281 ± 0.019 | **** |
| Model (OVX) | I₁A₁ | 0.214 ± 0.020 | — |
| Yang-enhancing | I₁A₂ | 0.258 ± 0.011 | ** |
| High Yang-enhancing | I₁A₃ | 0.243 ± 0.021 | * |
| Yin-nourishing | I₂A₁ | 0.262 ± 0.015 | *** |
| High Yin-nourishing | I₃A₁ | 0.253 ± 0.017 | ** |
| Yin + Hi-Yang | I₂A₃ | 0.240 ± 0.014 | * |
| Hi-Yin + Yang | I₃A₂ | 0.248 ± 0.014 | * |
| Full-High | I₃A₃ | 0.257 ± 0.017 | ** |
| ZGP full formula | I₂A₂ | 0.307 ± 0.010 | **** |
| TCM positive ctrl | — | 0.307 ± 0.029 | **** |
| Western medicine ctrl | — | 0.307 ± 0.009 | **** |
Table 2: Femoral BMD across all groups (n=10/group, mean ± SD). * = p <0.05, ** = p <0.01, *** = p<0.001, **** = p<0.0001 vs. model (Bonferroni-corrected).
| Group | Cell | P1NP (pg/mL, x̄ ± SD) | CTX-1 (ng/mL, x̄ ± SD) |
| Blank control | — | 1388.8 ± 29.7****#### | 33.4 ± 6.8****#### |
| Sham-operated | — | 1268.7 ± 124.1****#### | 45.0 ± 6.7****#### |
| Model (OVX) | I₁A₁ | 526.4 ± 78.7 | 105.5 ± 9.9 |
| Yang-enhancing | I₁A₂ | 845.1 ± 76.7**** | 84.2 ± 6.6**** |
| High Yang-enhancing | I₁A₃ | 1013.0 ± 73.7 ****## | 65.5 ± 6.6****#### |
| Yin-nourishing | I₂A₁ | 870.7 ± 63.6**** | 88.2 ± 7.6** |
| High Yin-nourishing | I₃A₁ | 1068.0 ± 48.7****#### | 64.5 ± 4.0****#### |
| Yin + Hi-Yang | I₂A₃ | 951.5 ± 146.5****# | 63.1 ± 6.0****#### |
| Hi-Yin + Yang | I₃A₂ | 990.2 ± 116.8****## | 62.6 ± 4.4****#### |
| Full-High | I₃A₃ | 739.5 ± 93.5** | 97.1 ± 8.9 |
| ZGP full formula | I₂A₂ | 794.8 ± 66.0**** | 88.2 ± 6.0**** |
| TCM positive ctrl | — | 967.7 ± 49.9****# | 66.3 ± 6.1****#### |
| Western medicine ctrl | — | 1026.6 ± 65.1****### | 68.8 ± 7.3****### |
Table 3: Serum P1NP and CTX-1 across all groups (n=10/group, mean ± SD). ** = p <0.01, **** = p <0.0001 vs. model; # = p <0.05, ## = p <0.01, ### = p <0.001, #### = p <0.0001 vs. ZGP (Bonferroni). 95% CI for ZGP P1NP vs. model: 210.3–327.5 pg/mL.
| Outcome | Factor | df | F | p-value | Partial η² |
| P1NP (pg/mL) | Yin (I) | 2, 81 | 17.84 | <0.001 | 0.31 |
| Yang (A) | 2, 81 | 6.22 | 0.003 | 0.13 | |
| I × A | 4, 81 | 57.21 | <0.001 | 0.74 | |
| BMD (mg/cm³) | Yin (I) | 2, 81 | 31.90 | <0.0001 | 0.44 |
| Yang (A) | 2, 81 | 28.70 | <0.0001 | 0.41 | |
| I × A | 4, 81 | 24.60 | <0.0001 | 0.55 | |
| CTX-1 (ng/mL) | Yin (I) | 2, 81 | 14.22 | <0.001 | 0.26 |
| Yang (A) | 2, 81 | 5.88 | 0.004 | 0.13 | |
| I × A | 4, 81 | 19.43 | <0.001 | 0.49 |
Table 4: Three by three factorial ANOVA main effects and interaction terms with Bonferroni-corrected post-hoc comparisons. Partial eta-squared is reported as the effect size. df indicates degrees of freedom.
Supplementary Table 1. Western blot antibody information. The table lists the target proteins, observed molecular weights, suppliers, catalog numbers, host species, and working dilutions of the primary and secondary antibodies used in this study.Please click here to download this file.
Supplementary Coding File 1. Raw experimental data supporting the study. This archive contains the original data files used to generate the results presented in the manuscript, including individual BMD measurements, ELISA raw data, RT-qPCR Ct values with amplification and melt curve outputs, original Western blot images and densitometry analysis files, representative histological microscopy images, and instrument-generated output files associated with these experiments.Please click here to download this file.
Discussion
The factorial interaction term supports a non-additive relationship between the Yin-nourishing and Yang-enhancing components of ZGP. This result is consistent with the traditional principle of seeking Yang within Yin, in which Yang-enhancing components are expected to activate or potentiate the Yin-nourishing base15. The finding should be interpreted as formulation-level pharmacological synergy. It does not identify the individual active constituents responsible for the effect.
EphB4 and ephrinB2 are biologically plausible mediators of osteoblast-osteoclast coupling3,4, but the present evidence is correlative. The observed increase in EphB4, ephrinB2, and ALP with decreased RhoA is compatible with improved coupling, yet it does not establish that this pathway is necessary or sufficient for ZGP action. Pathway inhibitors, anti-EphB4 or ephrinB2-blocking approaches, RhoA/ROCK modulation16, gene knockdown, and osteoblast-osteoclast co-culture experiments are required to test causal dependence.
Clinical translation requires caution. The rat human-equivalent dose conversion supports initial scaling, but human dosing also requires pharmacokinetic, pharmacodynamic, and long-term safety studies. A standardized ZGP product would need HPLC or LC-MS chemical profiling, marker-compound limits, batch-to-batch comparability, contaminant testing, and documentation of herb sourcing, extraction, concentration, and manufacturing practice17. Regulatory translation must also consider interactions among constituents, compatibility with existing anti-osteoporotic drugs, and comparative clinical outcomes such as fracture reduction rather than BMD alone.
This study has several limitations. The OVX rat model induces abrupt estrogen withdrawal and cannot fully reproduce human menopause, aging, immune regulation, lifespan, comorbidities, or long-term bone remodeling dynamics18,19. Systemic endocrine effects may contribute to the observed results, so direct bone-cell signaling should not be assumed. The absence of pathway inhibition or gene knockdown prevents causal mechanistic claims. The lack of HPLC or LC-MS profiling limits reproducibility and prevents attribution of effects to specific constituents. Quantitative assessment of trabecular bone microarchitecture was not performed. Future studies should incorporate micro-CT or quantitative histomorphometric analyses, including BV/TV, Tb.N, Tb.Th, and Tb.Sp, to provide a more comprehensive evaluation of bone structural changes20. Herbal batch variability, extraction procedures, and quality-control requirements remain important translation barriers.
In OVX-induced PMOP rats, full-formula Zuogui Pill was associated with improved BMD, favorable serum markers of bone turnover, and coordinated changes in EphB4/ephrinB2/RhoA/ALP pathway markers. The three-by-three factorial analysis supports a synergistic interaction between Yin-nourishing and Yang-enhancing components, consistent with traditional formula-compatibility theory. These data support further investigation of ZGP as a multi-target candidate for PMOP, but inhibitor studies, gene-silencing experiments, osteoblast-osteoclast co-cultures, chemical profiling, quantitative bone microarchitecture, pharmacokinetics, long-term safety testing, and clinical trials are required before mechanistic or translational claims can be finalized.
Disclosures
The authors have no conflicts of interest to declare.
Acknowledgements
This work was supported by the Natural Science Foundation of Inner Mongolia (Grant No. 2025LHMS08047), the General Project of Inner Mongolia Medical University (Grant No. YKD2025MS015), and the Doctoral Start-up Fund of Inner Mongolia Medical University (Grant No. YKD2023BSQD007). The funders had no role in study design, data collection, analysis, decision to publish, or preparation of the manuscript.
Materials
| Name | Company | Catalog Number | Comments |
|---|---|---|---|
| 1% ammonia water | N/A | N/A | Bluing solution after hematoxylin differentiation. |
| 1% hydrochloric acid alcohol | N/A | N/A | Differentiation solution for hematoxylin staining. |
| 2x qPCR Mix | N/A | N/A | Quantitative PCR master mix. Source reaction volume: 12.5 uL per reaction. |
| 4% paraformaldehyde solution | N/A | N/A | Fixation of left femur and tibia samples for histological analysis. |
| 5x loading buffer | N/A | N/A | Sample denaturation before electrophoresis. |
| ALP primary antibody | Affinity Biosciences | N/A | Western blot antibody. Source dilution: 1:2000. RRID and lot number required for JoVE. |
| ALP primer pair | N/A | N/A | ALP mRNA was measured by qRT-PCR, but the parent primer table does not provide ALP primer sequences. Author confirmation required. |
| Biotin antibody reagent | Supplied with ELISA kit, Jiyinmei | Kit component | Added to sample wells during ELISA. |
| Cervus elaphus antler gelatin, Lu Jiao Jiao | Beijing Tongrentang | N/A | Yang-enhancing component. Complete formula dose in source: 12 g, ratio 4. Gelatin was melted into the decoction. |
| Chinemys reevesii plastron gelatin, Gui Ban Jiao | Beijing Tongrentang | N/A | Yin-nourishing component. Complete formula dose in source: 12 g, ratio 4. Gelatin was melted into the decoction. |
| Chloroform | N/A | N/A | Phase separation during RNA extraction. |
| Cooling stage | Leica | 1150 | Cryo or cooling support for sectioning workflow. |
| Cornus officinalis, Shan Zhu Yu | Beijing Tongrentang | N/A | Yin-nourishing component. Complete formula dose in source: 12 g, ratio 4. |
| Cuscuta australis, Tu Si Zi | Beijing Tongrentang | N/A | Yang-enhancing component. Complete formula dose in source: 12 g, ratio 4. |
| Cyathula officinalis, Chuan Niu Xi | Beijing Tongrentang | N/A | Yin-nourishing component. Complete formula dose in source: 9 g, ratio 3. |
| DEPC-treated PBS | N/A | N/A | Rinsing of L4 to L5 lumbar vertebrae before liquid-nitrogen freezing. |
| Diethylstilbestrol | N/A | N/A | Western medicine positive control. Source dose: 0.04 mg/kg/day, 1 mL/100 g/day. Parent document also contains a Chinese nomenclature inconsistency that should be harmonized as diethylstilbestrol. |
| Dioscorea opposita, Huai Shan Yao | Beijing Tongrentang | N/A | Yin-nourishing component. Complete formula dose in source: 12 g, ratio 4. |
| dNTP mixture | N/A | N/A | Included in reverse transcription reaction. |
| ECL chemiluminescence reagent | N/A | N/A | Western blot detection reagent. |
| ELISA chromogenic reagent A | Supplied with ELISA kit, Jiyinmei | Kit component | Color development reagent for ELISA. |
| ELISA chromogenic reagent B | Supplied with ELISA kit, Jiyinmei | Kit component | Color development reagent for ELISA. |
| ELISA stop solution | Supplied with ELISA kit, Jiyinmei | Kit component | Used to terminate ELISA color reaction. |
| Enzyme-labeled ELISA reagent | Supplied with ELISA kit, Jiyinmei | Kit component | Added to non-blank wells in ELISA. |
| EphB4 primary antibody | Proteintech | N/A | Western blot antibody. Source dilution: 1:2000. RRID and lot number required for JoVE. |
| EphB4 primer pair | N/A | PCR product 232 bp | Forward CTAGACTCTTTCCTGCGGCT; Reverse GGGAACTTGTGTAGGTGGGA. Parent table typo Rat RphB4 should read Rat EphB4. |
| ephrinB2 primary antibody | Affinity Biosciences | N/A | Western blot antibody. Source dilution: 1:2000. RRID and lot number required for JoVE. |
| ephrinB2 primer pair | N/A | PCR product 172 bp | Forward CGGACAAGGCCTGGTACTAT; Reverse ACAGTTGAGCAGTGGGGTAT. |
| Ethanol, absolute and graded 95%, 85%, 75% | N/A | N/A | Gradient dehydration and rehydration during hematoxylin and eosin staining. |
| Female Sprague-Dawley rats | Beijing Vital River Laboratory Animal Technology Co., Ltd. | Animal certificate and license number not supplied in source article | Specific pathogen-free, 6 months old, healthy non-pregnant females. Chinese parent states 230 to 270 g; earlier English draft states 220 to 250 g. Verify one final range before submission. |
| GAPDH primary antibody | Servicebio | N/A | Loading-control antibody. Source dilution: 1:2000. RRID and lot number required for JoVE. |
| GAPDH primer pair | N/A | PCR product 253 bp | Forward ACAGCAACAGGGTGGTGGAC; Reverse TTTGAGGGTGCAGCGAACTT. |
| GraphPad Prism software | GraphPad Software | Version 9.4.1; RRID:SCR_002798 | Statistical analysis and graphing. Normality, variance homogeneity, ANOVA, Bonferroni correction, and effect sizes should be retained in output files. |
| Gusukang granules | Liaoning Wohua Kangchen Pharmaceutical Co., Ltd. | N/A | Traditional Chinese medicine positive control. Source dose: 1.8 g/kg/day or 0.5 mL/100 g/day. |
| Hematoxylin staining solution | Zhuhai Beisuo Biotechnology Co., Ltd. | N/A | Histological staining. Source procedure used 5 min hematoxylin staining. |
| High-speed microcentrifuge | N/A | TG16W | Centrifugation for serum and nucleic acid procedures. |
| Hologic dual-energy X-ray absorptiometer | Hologic | N/A | Bone mineral density analysis. Source reports in vivo and ex vivo femoral scanning. |
| ImageJ software | National Institutes of Health | RRID:SCR_003070 | Densitometry quantification for Western blot bands. Version not supplied in source article. |
| Induction cooker | Midea | N/A | Listed in Chinese parent instrument table. |
| Isoflurane | N/A | N/A | Anesthesia for bilateral ovariectomy and DXA positioning. Revised protocol should specify induction, maintenance, route, and anesthetic-depth criteria. |
| Isopropanol | N/A | N/A | RNA precipitation during extraction. |
| Liquid nitrogen | N/A | N/A | Snap-freezing of lumbar vertebrae samples. |
| Lycium barbarum, Gou Qi Zi | Beijing Tongrentang | N/A | Yin-nourishing component. Complete formula dose in source: 12 g, ratio 4. |
| Microplate reader | N/A | AMR-100 | ELISA absorbance detection at 450 nm. |
| Microplate washer | N/A | APW-200 | Washing step for ELISA plates. |
| MMLV reverse transcriptase | N/A | N/A | Reverse transcription enzyme. |
| Neutral mounting gum | Sinopharm Group | N/A | Mounting medium for hematoxylin and eosin stained slides. |
| Normal saline | N/A | N/A | Vehicle gavage for blank control, sham-operated, and model groups. |
| Oligo(dT)18 primer | N/A | N/A | Used for reverse transcription. |
| Penicillin | N/A | N/A | Post-operative infection prophylaxis. Source dose: 20,000 U/kg intramuscularly for 3 days. |
| Pressure cooker | Xinfei | N/A | Listed in Chinese parent instrument table. |
| Protease inhibitor | N/A | N/A | Added during protein extraction. |
| Protein lysis buffer | N/A | N/A | Bone tissue protein extraction for Western blotting. |
| PVDF membrane | N/A | N/A | Western blot transfer membrane activated by methanol. |
| qRT-PCR instrument | N/A | N/A | Quantitative reverse transcription PCR for EphB4, ephrinB2, RhoA, ALP, and GAPDH. |
| Rat CTX-1 ELISA kit | Jiyinmei | JYM0026Ra | Sandwich ELISA for serum C-terminal telopeptide of type 1 collagen. Detection at 450 nm. |
| Rat P1NP ELISA kit | Jiyinmei | JYM0030Ra | Sandwich ELISA for serum procollagen type 1 N-terminal propeptide. Detection at 450 nm. |
| Rehmannia glutinosa, Shu Di Huang | Beijing Tongrentang | N/A | Yin-nourishing component. Complete formula dose in source: 24 g, ratio 8. |
| RhoA primary antibody | Proteintech | N/A | Western blot antibody. Source dilution: 1:2000. RRID and lot number required for JoVE. |
| RhoA primer pair | N/A | PCR product 177 bp | Forward GTTTATGTGCCCACGGTGTT; Reverse ACTATCAGGGCTGTCGATGG. Terminology harmonized from RHoA to RhoA. |
| RNase inhibitor | N/A | N/A | Included in reverse transcription reaction. |
| RNase-free water | N/A | N/A | RNA dissolution after drying. |
| Rotary microtome | Leica | 2245 | Histological sectioning. |
| Secondary antibody for Western blotting | N/A | N/A | Source dilution: 1:15000. Host reactivity and RRID required for JoVE. |
| Skim milk powder, 5% | N/A | N/A | Blocking reagent for Western blotting, room temperature for 2 h. |
| Slide spreading and baking machine | Jinhua Yidi | N/A | Slide preparation for histology. |
| Sodium pentobarbital, 3% | N/A | N/A | Terminal anesthesia before abdominal aorta blood collection in the Chinese parent document. Final euthanasia procedure and confirmation method must be verified. |
| Standard sample diluent | Supplied with ELISA kit, Jiyinmei | Kit component | Used for serial standard dilution in the ELISA procedure. |
| TBST buffer | N/A | N/A | Wash buffer for Western blotting. |
| Thermostatic shaking incubator | Shanghai Yiheng Scientific Instrument Co., Ltd. | N/A | Laboratory incubation and shaking. |
| TRIzol reagent | N/A | N/A | RNA extraction from 100 mg bone tissue. |
| Upright microscope | Leica | DM1000 | Hematoxylin and eosin histology imaging at 200x. |
| Water-jacket thermostatic incubator | N/A | GNP-9080 | Incubation for assay procedures. |
| Water-soluble eosin staining solution | Zhuhai Beisuo Biotechnology Co., Ltd. | N/A | Histological counterstain. Source procedure used 3 min eosin staining. |
| Western blot electrophoresis system | N/A | N/A | Protein separation. Source electrophoresis: 80 V initially, then 120 V. |
| Western blot imaging system | N/A | N/A | Chemiluminescent membrane imaging. Uncropped membranes required for submission. |
| Western blot transfer system | N/A | N/A | Protein transfer to PVDF membrane. Source transfer condition: 400 mA, 90 min, ice bath. |
| Xylene | N/A | N/A | Dewaxing and tissue clearing during histology. |
| Zuogui Pill component herbs | Beijing Tongrentang | N/A | Eight-herb formulation: Rehmannia glutinosa, Dioscorea opposita, Cornus officinalis, Lycium barbarum, Chinemys reevesii plastron gelatin, Cyathula officinalis, Cuscuta australis, and Cervus elaphus antler gelatin. |
References
- Compston JE, McClung MR, Leslie WD. Osteoporosis. Lancet. 2019;393(10169):364-376. https://doi.org/10.1016/S0140-6736(18)32112-3
- Shen Y, Huang X, Wu J, et al. The global burden of osteoporosis, low bone mass, and its related fracture in 204 countries and territories, 1990-2019. Front Endocrinol (Lausanne). 2022;13:882241. https://doi.org/10.3389/fendo.2022.882241
- Zhao C, Irie N, Takada Y, et al. Bidirectional ephrinB2-EphB4 signaling controls bone homeostasis. Cell Metab. 2006;4(2):111-121. https://doi.org/10.1016/j.cmet.2006.05.012
- Wu Z, Li W, Jiang K, et al. Regulation of bone homeostasis: signaling pathways and therapeutic targets. MedComm (2020). 2024;5(8):e657. https://doi.org/10.1002/mco2.657
- Reid IR, Billington EO. Drug therapy for osteoporosis in older adults. Lancet. 2022;399(10329):1080-1092. https://doi.org/10.1016/S0140-6736(21)02646-5
- Li J, Sun K, Qi B, et al. An evaluation of the effects and safety of Zuogui pill for treating osteoporosis: current evidence for an ancient Chinese herbal formula. Phytother Res. 2021;35(4):1754-1767. https://doi.org/10.1002/ptr.6908
- Shi T, Liu T, Kou Y, et al. The synergistic effect of Zuogui Pill and eldecalcitol on improving bone mass and osteogenesis in type 2 diabetic osteoporosis. Medicina (Kaunas). 2023;59(8):1414. https://doi.org/10.3390/medicina59081414
- Yang S, Zhang B, Wang YG, et al. Zuo Gui Wan promotes osteogenesis via PI3K/AKT signaling pathway: network pharmacology analysis and experimental validation. Curr Med Sci. 2023;43(5):1051-1060. https://doi.org/10.1007/s11596-023-2782-x
- Qiu J, Zhu Y, Xing J, Wang L, Zhang J, Yin H. Comparative pharmacokinetic study of 5 active ingredients after oral administration of Zuogui Pill in osteoporotic rats with different syndrome types. Int J Anal Chem. 2023;2023:1473878. https://doi.org/10.1155/2023/1473878
- Gong W, Zhang N, Cheng G, et al. Rehmannia glutinosa Libosch extracts prevent bone loss and architectural deterioration and enhance osteoblastic bone formation by regulating the IGF-1/PI3K/mTOR pathway in streptozotocin-induced diabetic rats. Int J Mol Sci. 2019;20(16):3964. https://doi.org/10.3390/ijms20163964
- Wang K, Kou Y, Rong X, Wei L, Li J, Liu H, Li M, Song H. ED-71 improves bone mass in ovariectomized rats by inhibiting osteoclastogenesis through EphrinB2-EphB4-RANKL/OPG axis. Drug Des Devel Ther. 2024;18:1515-1528. https://doi.org/10.2147/DDDT.S454116
- Percie du Sert N, Hurst V, Ahluwalia A, et al. The ARRIVE guidelines 2.0: updated guidelines for reporting animal research. PLoS Biol. 2020;18(7):e3000410. https://doi.org/10.1371/journal.pbio.3000410
- Reagan-Shaw S, Nihal M, Ahmad N. Dose translation from animal to human studies revisited. FASEB J. 2008;22(3):659-661. https://doi.org/10.1096/fj.07-9574LSF
- Eastell R, Szulc P. Use of bone turnover markers in postmenopausal osteoporosis. Lancet Diabetes Endocrinol. 2017;5(11):908-923. https://doi.org/10.1016/S2213-8587(17)30184-5
- Yao ZY, Fan SY, Song ZF, Li ZC. Network pharmacology-based and molecular docking-based analysis of You-Gui-Yin for the treatment of osteonecrosis of the femoral head. Medicine (Baltimore). 2023;102(43):e35581. https://doi.org/10.1097/MD.0000000000035581
- Wang J, Xu C, Zhang J, Bao Y, Tang Y, Lv X, Ma B, Wu X, Mao G. RhoA promotes osteoclastogenesis and regulates bone remodeling through mTOR-NFATc1 signaling. Mol Med. 2023;29(1):49. https://doi.org/10.1186/s10020-023-00638-1
- Noviana E, Indrayanto G, Rohman A. Advances in fingerprint analysis for standardization and quality control of herbal medicines. Front Pharmacol. 2022;13:853023. https://doi.org/10.3389/fphar.2022.853023
- Fischer V, Haffner-Luntzer M. Interaction between bone and immune cells: implications for postmenopausal osteoporosis. Semin Cell Dev Biol. 2022;123:14-21. https://doi.org/10.1016/j.semcdb.2021.05.014
- Komori T. Animal models for osteoporosis. Eur J Pharmacol. 2015;759:287-294. https://doi.org/10.1016/j.ejphar.2015.03.028
- Dempster DW, Compston JE, Drezner MK, et al. Standardized nomenclature, symbols, and units for bone histomorphometry: a 2012 update of the report of the ASBMR Histomorphometry Nomenclature Committee. J Bone Miner Res. 2013;28(1):2-17. https://doi.org/10.1002/jbmr.1805