This study presents a retrospective clinical workflow to estimate the risk of pulmonary hypertension in elderly patients hospitalized with an acute exacerbation of chronic obstructive pulmonary disease, using routinely available clinical variables and a nomogram-based prediction model.
Research Article
Routine-Data Nomogram for Estimating Pulmonary Hypertension Risk in Elderly Patients with Acute Exacerbation of Chronic Obstructive Pulmonary Disease
In This Article
Summary
Abstract
Pulmonary hypertension is a clinically important complication in elderly patients hospitalized with acute exacerbation of chronic obstructive pulmonary disease, but early risk estimation remains difficult in primary and resource-limited hospital settings. This retrospective cohort study developed and internally evaluated a routine-data-based nomogram for estimating pulmonary hypertension risk. A total of 230 elderly patients hospitalized with acute exacerbation of chronic obstructive pulmonary disease between May 2023 and May 2025 were analyzed. Patients were classified into non-pulmonary hypertension and pulmonary hypertension groups according to transthoracic echocardiographic findings. Demographic characteristics, comorbidities, complete blood count indices, coagulation markers, inflammatory markers, and cardiac stress markers were compared between groups. Candidate predictors were selected using univariate analysis, assessment of clinical relevance, redundancy assessment, and multivariable logistic regression. Four variables—neutrophil-to-lymphocyte ratio, B-type natriuretic peptide, D-dimer, and asthma history—were independently associated with pulmonary hypertension and were incorporated into the primary nomogram. The model demonstrated good discrimination, with an area under the receiver operating characteristic curve of 0.82. Decision curve analysis indicated potential net benefit across threshold probabilities of approximately 1% to 70%. Calibration findings required cautious interpretation due to residual calibration deviation. This workflow provides a practical approach for early pulmonary hypertension risk stratification in elderly patients hospitalized with acute exacerbation of chronic obstructive pulmonary disease. However, external validation and model recalibration are required before broader clinical implementation.
Introduction
Chronic obstructive pulmonary disease is a common chronic respiratory disorder characterized by persistent airflow limitation, respiratory symptoms, and recurrent episodes of clinical deterioration. It remains a major contributor to morbidity, mortality, and healthcare burden worldwide1. Acute exacerbation of chronic obstructive pulmonary disease refers to an acute worsening of respiratory symptoms, including dyspnea, cough, and sputum production, and is frequently triggered by infection, environmental exposure, or other acute insults2. In elderly patients, acute exacerbations often occur in the presence of multimorbidity, impaired cardiopulmonary reserve, systemic inflammation, and reduced physiological tolerance, increasing the difficulty of early risk assessment.
Pulmonary hypertension is an important complication of chronic obstructive pulmonary disease, particularly during acute exacerbations. Its development is associated with chronic hypoxia, pulmonary vascular remodeling, endothelial dysfunction, inflammatory activation, and increased right ventricular afterload3. Elevated pulmonary artery pressure has been observed in patients with acute exacerbation of chronic obstructive pulmonary disease and may worsen respiratory failure, right-heart strain, hospitalization burden, and survival4. This prognostic impact is particularly important in older patients and those with advanced cardiopulmonary disease5,6. Early identification of patients at increased risk of pulmonary hypertension may therefore support closer monitoring, timely echocardiographic evaluation, and referral for further cardiopulmonary assessment.
Right-heart catheterization remains the reference standard for confirming pulmonary hypertension; however, its invasiveness, cost, technical requirements, and limited availability restrict its use as an initial screening procedure in many primary and county-level hospitals7. Transthoracic echocardiography is widely used as a non-invasive assessment method, but its reliability may be affected by hyperinflation, poor acoustic windows, and emphysematous changes in patients with chronic obstructive pulmonary disease8. Although these limitations do not diminish the clinical value of echocardiography, they highlight the need for a simple risk-estimation workflow that can be applied before or alongside imaging-based evaluation.
Routine clinical and laboratory variables may help address this need. The neutrophil-to-lymphocyte ratio is calculated from complete blood count results and reflects the balance between neutrophil-driven inflammation and lymphocyte-related immune regulation9. It has been associated with disease activity and adverse outcomes in pulmonary and cardiovascular conditions10. B-type natriuretic peptide is a readily available marker of myocardial wall stress, right ventricular pressure overload, and cardiopulmonary strain11. D-dimer reflects coagulation activation and secondary fibrinolysis, and may increase during acute exacerbations due to hypoxemia, infection, endothelial injury, and reduced mobility12. However, no single biomarker is likely to capture the full risk profile of pulmonary hypertension in elderly patients with acute exacerbation of chronic obstructive pulmonary disease.
A nomogram provides a practical means of translating a multivariable prediction model into individualized risk estimation. Compared with reporting regression coefficients alone, it enables the integration of multiple patient-level predictors into a clinically interpretable tool13. Previous clinical prediction studies have used nomogram-based models to support bedside risk estimation, but their usefulness depends on transparent predictor selection, appropriate calibration, validation, and cautious interpretation14. The novelty of the present study lies in developing a routine-data-based workflow for elderly patients hospitalized with acute exacerbation of chronic obstructive pulmonary disease by integrating inflammatory, cardiac-stress, coagulation-related, and airway-phenotype information into a practical nomogram. The study aimed to identify clinical predictors associated with echocardiography-defined pulmonary hypertension and to construct an internally validated model for early risk stratification rather than definitive diagnosis.
Protocol
The study protocol was reviewed and approved by the Ethics Committee of Santai County Hospital of Traditional Chinese Medicine in Mianyang, Sichuan Province (Approval No. 2025003). The study was conducted in accordance with the principles of the Declaration of Helsinki. Written informed consent was obtained from each patient or from a first-degree relative before inclusion in the study. This retrospective cohort study reviewed the clinical records of elderly patients hospitalized for acute exacerbation of chronic obstructive pulmonary disease (AECOPD) in the Department of Respiratory and Critical Care Medicine of Santai County Traditional Chinese Medicine Hospital between May 2023 and May 2025. The study was designed to identify routinely available clinical predictors of pulmonary hypertension (PH) and to develop a nomogram for individualized PH risk estimation. The laboratory instruments, echocardiography system, blood collection supplies, data extraction tools, and statistical software used in this workflow were listed in the Table of Materials.
1. Patient screening and eligibility assessment
Hospitalized patients with a discharge diagnosis of AECOPD during the study period were screened through the inpatient electronic medical record system. Each record was reviewed to confirm that the patient was at least 60 years old and that the diagnosis of chronic obstructive pulmonary disease was consistent with the 2021 Global Initiative for Chronic Obstructive Lung Disease diagnostic criteria15. AECOPD was defined as an acute worsening of respiratory symptoms that required hospitalization and additional treatment. For patients with more than one AECOPD admission during the study period, only the first eligible hospitalization was included.
Patients were included when all of the following criteria were met: age of at least 60 years; hospitalization for AECOPD between May 2023 and May 2025; available transthoracic echocardiography during the index hospitalization; available first fasting venous blood sample after admission; and complete clinical, laboratory, and echocardiographic information required for model construction. Patients were excluded if they had severe hepatic insufficiency, end-stage renal disease, active malignancy, pulmonary hypertension attributable to other known causes, primary left-heart disease, connective tissue disease such as systemic sclerosis, active pulmonary tuberculosis, or missing key variables required for outcome classification or model construction.
Before records were removed because of incomplete information, age, sex, smoking history, drinking history, drug allergy history, hypertension, diabetes mellitus, coronary heart disease, asthma, bronchiectasis, pulmonary infection, emphysema, respiratory failure, heart failure, echocardiographic PH status, complete blood count indices, albumin, creatinine, high-sensitivity C-reactive protein, D-dimer, fibrinogen, B-type natriuretic peptide, and neutrophil-to-lymphocyte ratio were checked. The number of screened and excluded records, exclusion reasons, and final included cases were recorded to construct the patient selection flow diagram (Figure 1).
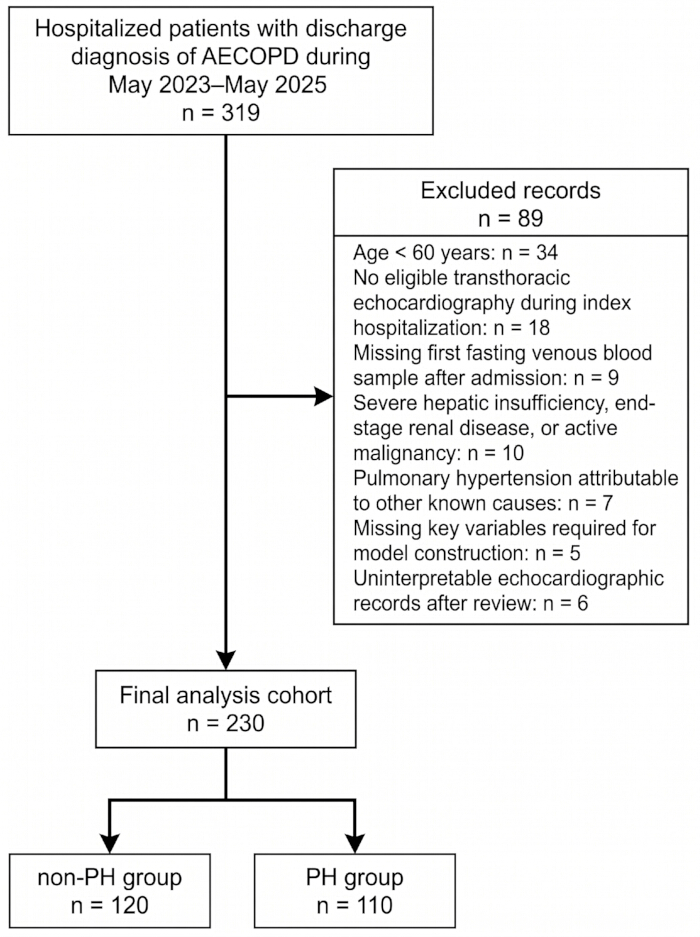
Figure 1: Patient screening and cohort construction. The flow diagram shows record identification, eligibility assessment, exclusion, and final grouping of elderly patients hospitalized with AECOPD. Patients were classified into the non-PH or PH group according to transthoracic echocardiographic findings. Abbreviations: AECOPD, acute exacerbation of chronic obstructive pulmonary disease; PH, pulmonary hypertension. Please click here to view a larger version of this figure.
2. Clinical grouping and diagnostic definition of pulmonary hypertension
Included patients were classified into a non-PH group or a PH group according to transthoracic echocardiographic findings during hospitalization. The diagnostic framework was based on the 2015 European Society of Cardiology/European Respiratory Society guidelines for pulmonary hypertension16. Resting transthoracic echocardiography was used as the diagnostic basis in this retrospective dataset. Examinations were performed by trained echocardiography physicians using standard parasternal, apical, and subcostal views. Echocardiographic interpretability was reviewed before group assignment because poor acoustic windows are common in patients with chronic obstructive pulmonary disease. A record was considered suitable for PH classification when the tricuspid regurgitation Doppler signal was measurable or when right ventricular size, wall thickness, and systolic function could be evaluated from interpretable cardiac views.
Pulmonary arterial systolic pressure was estimated using peak tricuspid regurgitation velocity and estimated right atrial pressure. Right atrial pressure was estimated from the inferior vena cava diameter and inspiratory collapse when both measurements were available. PH was defined as an estimated pulmonary arterial systolic pressure of at least 40 mmHg. When pulmonary arterial systolic pressure could not be reliably estimated, PH classification required indirect echocardiographic evidence of right ventricular involvement, including right ventricular enlargement, right ventricular hypertrophy, right ventricular systolic dysfunction, interventricular septal flattening, or pulmonary artery enlargement. Echocardiographic records with unclear images, untraceable tricuspid regurgitation Doppler signals, or inconsistent right-heart findings were reviewed by a second echocardiography physician before the final group assignment. Records that remained uninterpretable after review were excluded from the final analysis. In the final cohort, 230 elderly patients met the eligibility criteria; 120 patients were assigned to the non-PH group, and 110 patients were assigned to the PH group.
3. Extraction of demographic and clinical variables
All clinical data were retrieved from the inpatient electronic medical record system using a standardized data collection form. Sex, age, smoking history, drinking history, drug allergy history, hypertension, diabetes mellitus, coronary heart disease, asthma, bronchiectasis, pulmonary infection, emphysema, respiratory failure, and heart failure were recorded. Smoking history was defined as lifetime consumption of at least 100 cigarettes, and drinking history was defined as regular alcohol consumption at least two times per week.
Pulmonary infection was diagnosed by integrating respiratory symptoms, physical signs, chest imaging findings, and, when available, microbiological evidence. Heart failure was diagnosed according to clinical manifestations, physical signs, B-type natriuretic peptide levels, and echocardiographic findings. Comorbidity information was cross-checked against discharge diagnoses, progress notes, imaging reports, laboratory reports, and consultation records, when available.
4. Collection and processing of laboratory variables
The first fasting venous blood sample collected on the morning after hospital admission was used as the laboratory data source. This time point corresponded to the first morning blood draw after admission and before routine daytime treatment adjustment, when this information was available in the medical record. Complete blood count indices, biochemical indices, coagulation markers, inflammatory markers, and cardiac stress markers were extracted from the hospital laboratory information system.
Neutrophil count, lymphocyte count, platelet count, mean platelet volume, and red-cell distribution width coefficient of variation were recorded from the complete blood count report. The neutrophil-to-lymphocyte ratio was calculated as follows:

Albumin, creatinine, D-dimer, fibrinogen, high-sensitivity C-reactive protein, and B-type natriuretic peptide were recorded from the corresponding laboratory reports. Consistent measurement units were used across the dataset: albumin in g/L, creatinine in µmol/L, high-sensitivity C-reactive protein in mg/L, D-dimer in µg/mL, fibrinogen in g/L, neutrophil count, lymphocyte count, and platelet count in ×109/L, mean platelet volume in fL, and B-type natriuretic peptide in pg/mL.
5. Data cleaning and preparation
The dataset was inspected before statistical analysis. Each included record was checked for eligibility, group assignment, laboratory completeness, echocardiographic interpretability, and availability of candidate predictors. Direct personal identifiers were removed, and each patient was assigned a study identification number. Duplicate records, repeated hospitalizations, inconsistent group labels, impossible dates, and implausible laboratory values were checked against the original electronic medical record and laboratory report. No imputation was performed for key outcome or predictor variables because the final model was based on complete-case analysis.
Continuous variables were reviewed for distributional characteristics. Normally distributed variables were summarized as mean ± standard deviation; non-normally distributed variables as median with interquartile range; and categorical variables as counts and percentages. Before multivariable modeling, clinically related variables were examined for redundancy. Neutrophil count and lymphocyte count were reviewed together with the neutrophil-to-lymphocyte ratio; pulmonary infection was reviewed together with neutrophil count, high-sensitivity C-reactive protein, and the neutrophil-to-lymphocyte ratio; heart failure was reviewed together with B-type natriuretic peptide and echocardiographic cardiac findings; D-dimer and fibrinogen were reviewed as coagulation-related variables; and platelet count, mean platelet volume, and red-cell distribution width coefficient of variation were reviewed as hematological variables.
6. Univariate comparison between groups
Demographic characteristics, comorbidities, laboratory indicators, and echocardiographic grouping variables were compared between the non-PH and PH groups. An independent-sample t-test was used for normally distributed continuous variables. The Mann-Whitney U test was used for non-normally distributed continuous variables. The χ2 test or Fisher’s exact test was used for categorical variables, depending on expected cell counts. A two-sided P-value less than 0.05 was considered statistically significant. Variables with significant between-group differences were considered for multivariable evaluation together with clinically relevant predictors.
7. Multivariable logistic regression analysis
Binary logistic regression was used to identify independent predictors associated with PH in elderly patients with AECOPD. PH status was used as the dependent variable. Continuous predictors were entered in their original measurement units, and categorical predictors were coded as binary variables. Candidate variables were selected according to univariate results and clinical relevance. Variables with P < 0.05 in the univariate comparison were first identified and then reviewed for redundancy, interpretability, and clinical overlap.
The initial candidate variables included high-sensitivity C-reactive protein, D-dimer, red-cell distribution width coefficient of variation, platelet count, mean platelet volume, neutrophil-to-lymphocyte ratio, B-type natriuretic peptide, coronary heart disease, and asthma history. Neutrophil count and lymphocyte count were not entered together with neutrophil-to-lymphocyte ratio because they were components of the ratio. Pulmonary infection and heart failure were evaluated during redundancy assessment. To examine whether their exclusion affected model interpretation, a sensitivity analysis was performed by adding pulmonary infection and heart failure to the primary predictor set. Regression estimates, discrimination, calibration, and clinical net benefit were compared between the primary and sensitivity models.
Multicollinearity among candidate predictors was assessed using variance inflation factors. Categorical variables were coded before calculation, and continuous variables were entered in the same units used for regression modeling. A variance inflation factor below 5 was considered to indicate no severe multicollinearity. Regression coefficients, standard errors, Wald χ2 values, odds ratios, 95% confidence intervals, P-values, and variance inflation factors were reported for variables included in the multivariable model.
8. Nomogram construction
The nomogram was constructed from the independent predictors retained in the multivariable logistic regression model. The final predictors were D-dimer, neutrophil-to-lymphocyte ratio, B-type natriuretic peptide, and asthma history. The logistic regression model was converted into a point-based nomogram using R software and the rms package. A data distribution object was generated for the modeling dataset, the logistic regression model was fitted, and regression coefficients were used to assign points to each predictor. For each patient, the points for D-dimer, neutrophil-to-lymphocyte ratio, B-type natriuretic peptide, and asthma history were summed to generate a total score, which was then mapped to the estimated probability of PH.
The nomogram was interpreted using standard point-based procedures described in previous clinical prediction model studies17,18. The patient’s D-dimer value, neutrophil-to-lymphocyte ratio, B-type natriuretic peptide value, and asthma status were located on their corresponding axes. A vertical line was drawn from each predictor value to the point scale. The points were added to obtain the total score, and a vertical line was drawn from the total score scale to the predicted probability axis to obtain the individualized estimated probability of PH. The illustrative patient used in the manuscript was selected from values within or close to the observed clinical distribution of the cohort.
9. Evaluation of model performance
Model discrimination was evaluated using receiver operating characteristic curve analysis and the area under the curve. The area under the curve was reported with a 95% confidence interval. The nomogram was compared with individual predictors and with a model combining quantitative laboratory markers. Calibration was assessed by comparing predicted probabilities with observed PH outcomes. A calibration curve was generated using bootstrap resampling. Calibration intercept, calibration slope, mean absolute error, Brier score, and the Hosmer-Lemeshow test were reported. Bootstrap-corrected calibration intercept and bootstrap-corrected calibration slope were also calculated . The Hosmer-Lemeshow test was interpreted together with the calibration curve and quantitative calibration indices.
Clinical utility was evaluated using decision curve analysis. Net benefit was plotted across threshold probabilities and compared with treat-all and treat-none reference strategies. The threshold probability range in which the model provided higher net benefit than the reference strategies was identified.
10. Internal validation and reproducibility
Internal validation was performed using bootstrap resampling with 1,000 replicates. In each bootstrap replicate, the model was refitted and tested to estimate optimism in model performance. Optimism-corrected discrimination and calibration indices were calculated and reported together with the apparent model performance.
Statistical analyses were performed using standard statistical software and R version 4.5.2. R packages were used for logistic regression modeling, nomogram construction, receiver operating characteristic curve analysis, calibration assessment, internal validation, and decision curve analysis. The nomogram was constructed using the rms package in R.
Results
Patient screening and cohort characteristics
A total of 230 elderly patients hospitalized with acute exacerbation of chronic obstructive pulmonary disease (AECOPD) met the eligibility criteria and were included in the final analysis. According to transthoracic echocardiographic assessment, 120 patients were assigned to the non-pulmonary hypertension (non-PH) group, and 110 patients were assigned to the pulmonary hypertension (PH) group (Figure 1). General baseline characteristics were broadly comparable between groups. No statistically significant differences were observed in sex distribution, age, smoking history, drinking history, drug allergy history, hypertension, or diabetes mellitus (all P > 0.05; Table 1). Coronary heart disease was more frequent in the PH group than in the non-PH group (13.64% vs. 4.17%, P = 0.017), as were asthma (29.09% vs. 15.00%, P = 0.011), pulmonary infection (78.18% vs. 1.67%, P < 0.001), and heart failure (65.45% vs. 15.00%, P < 0.001; Table 1).
Echocardiographic quality was reviewed before group assignment. Among the final included patients, the tricuspid regurgitation Doppler signal was measurable in 198 patients (86.1%). In the remaining 32 patients (13.9%), PH classification was based on interpretable right-heart structural or functional findings. Twenty-one records were reviewed by a second echocardiography physician because of limited acoustic windows or incomplete tricuspid regurgitation signals, and six records remained uninterpretable and were excluded before final cohort construction.
| Variable | Non-PH group | PH group (n = 110) | Z/t/χ² | P-value |
| (n = 120) | ||||
| Male, n (%) | 83 (69.17) | 64 (58.18) | 3.003 | 0.099 |
| Age, years | 74.54 ± 7.92 | 74.68 ± 7.17 | -0.144 | 0.886 |
| Smoking history, n (%) | 55 (45.83) | 47 (42.73) | 0.224 | 0.691 |
| Drinking history, n (%) | 46 (38.33) | 37 (33.64) | 0.549 | 0.494 |
| Drug allergy history, n (%) | 6 (5.00) | 1 (0.91) | 3.255 | 0.122 |
| Hypertension, n (%) | 42 (35.00) | 37 (33.64) | 0.047 | 0.89 |
| Diabetes mellitus, n (%) | 12 (10.00) | 21 (19.09) | 3.86 | 0.06 |
| Coronary heart disease, n (%) | 5 (4.17) | 15 (13.64) | 6.482 | 0.017 |
| Asthma, n (%) | 18 (15.00) | 32 (29.09) | 6.698 | 0.011 |
| Bronchiectasis, n (%) | 14 (11.67) | 22 (20.00) | 3.019 | 0.102 |
| Pulmonary infection, n (%) | 2 (1.67) | 86 (78.18) | 142.241 | <0.001 |
| Emphysema, n (%) | 3 (2.50) | 0 (0.00) | 2.786 | 0.248 |
| Respiratory failure, n (%) | 33 (27.50) | 41 (37.27) | 2.512 | 0.122 |
| Heart failure, n (%) | 18 (15.00) | 72 (65.45) | 61.338 | <0.001 |
| Albumin, g/L | 36.38 ± 4.41 | 35.77 ± 4.09 | 1.084 | 0.279 |
| Creatinine, µmol/L | 68.75 (58.30, 83.05) | 66.75 (52.28, 82.03) | -0.951 | 0.341 |
| hs-CRP, mg/L | 8.15 (2.15, 48.58) | 12.60 (4.57, 90.03) | -2.11 | 0.035 |
| D-dimer, µg/mL | 0.415 (0.27, 0.68) | 0.61 (0.37, 1.41) | -3.212 | 0.001 |
| Fibrinogen, g/L | 3.97 (2.90, 4.88) | 4.04 (3.09, 5.04) | -0.94 | 0.347 |
| Neutrophil count, ×109/L | 5.51 (3.67, 7.58) | 7.31 (4.78, 12.61) | -3.533 | <0.001 |
| Lymphocyte count, ×109/L | 1.12 (0.79, 1.59) | 0.85 (0.59, 1.25) | -3.252 | 0.001 |
| RDW-CV, % | 13.60 (13.00, 14.30) | 14.10 (13.30, 14.92) | -2.637 | 0.008 |
| Platelet count, ×109/L | 200.00 (163.00, 252.00) | 180.50 (143.00, 209.00) | -2.783 | 0.005 |
| Mean platelet volume, fL | 10.00 (9.10, 11.47) | 10.75 (9.70, 11.72) | -2.793 | 0.005 |
| NLR | 4.49 (2.76, 9.30) | 8.54 (4.73, 15.57) | -4.357 | <0.001 |
| BNP, pg/mL | 59.75 (41.45, 89.40) | 135.50 (64.65, 632.00) | -6.5 | <0.001 |
Table 1: Comparison of clinical characteristics between the non-PH and PH groups. This table summarizes baseline characteristics, comorbidities, inflammatory markers, coagulation indicators, hematological indices, and cardiac stress markers in elderly patients with AECOPD. Continuous variables are shown as mean ± standard deviation or median with interquartile range; categorical variables are shown as number and percentage. Abbreviations: AECOPD, acute exacerbation of chronic obstructive pulmonary disease; PH, pulmonary hypertension; hs-CRP, high-sensitivity C-reactive protein; RDW-CV, red-cell distribution width coefficient of variation; NLR, neutrophil-to-lymphocyte ratio; BNP, B-type natriuretic peptide.
Laboratory differences between the non-PH and PH groups
The PH group showed higher inflammatory, coagulation-related, hematological, and cardiac stress burden (Table 1). Median high-sensitivity C-reactive protein was higher in the PH group than in the non-PH group (12.60 mg/L vs. 8.15 mg/L, P = 0.035). NLR was also higher in the PH group (8.54 vs. 4.49, P < 0.001), with a higher neutrophil count (7.31 × 10⁹/L vs. 5.51 × 10⁹/L, P < 0.001) and a lower lymphocyte count (0.85 × 10⁹/L vs. 1.12 × 10⁹/L, P = 0.001). D-dimer was higher in the PH group (0.61 µg/mL vs. 0.415 µg/mL, P = 0.001). Platelet count was lower in the PH group (180.50 × 10⁹/L vs. 200.00 × 10⁹/L, P = 0.005), whereas mean platelet volume (10.75 fL vs. 10.00 fL, P = 0.005) and red-cell distribution width coefficient of variation (14.10% vs. 13.60%, P = 0.008) were higher. BNP also differed clearly between groups, with a median value of 135.50 pg/mL in the PH group and 59.75 pg/mL in the non-PH group (P < 0.001). Albumin, creatinine, and fibrinogen did not differ significantly between groups (all P > 0.05; Table 1).
Predictor selection and multivariable logistic regression
Thirteen variables showed significant between-group differences in the univariate analysis and were reviewed together with clinically relevant predictors. Neutrophil count and lymphocyte count were not entered with NLR because they were components of the ratio. Pulmonary infection and heart failure were evaluated during redundancy assessment because of their overlap with inflammatory markers and BNP, respectively. Nine variables were entered into the primary multivariable logistic regression model: high-sensitivity C-reactive protein, D-dimer, red-cell distribution width coefficient of variation, platelet count, mean platelet volume, NLR, BNP, coronary heart disease, and asthma history. All variance inflation factors were below 5, indicating no severe multicollinearity; the highest was 2.16 for BNP (Table 2).
In the primary model, four variables remained independently associated with PH in elderly patients with AECOPD (Table 2). D-dimer was associated with higher odds of PH (OR = 1.251, 95% CI: 1.001–1.563, P = 0.049), as were NLR (OR = 1.043, 95% CI: 1.003–1.083, P = 0.033), BNP (OR = 1.003, 95% CI: 1.001–1.005, P < 0.001), and asthma history (OR = 3.054, 95% CI: 1.489–6.267, P = 0.002). High-sensitivity C-reactive protein, red-cell distribution width coefficient of variation, platelet count, mean platelet volume, and coronary heart disease were not independently associated with PH after adjustment (all P > 0.05; Table 2).
| Variable | B | SE | Wald χ2 | OR (95% CI) | P-value | VIF |
| hs-CRP | -0.002 | 0.002 | 1.099 | 0.998 (0.995, 1.002) | 0.295 | 1.22 |
| D-dimer | 0.224 | 0.114 | 3.877 | 1.251 (1.001, 1.563) | 0.049 | 1.16 |
| RDW-CV | 0.088 | 0.124 | 0.504 | 1.092 (0.856, 1.393) | 0.478 | 1.31 |
| Platelet count | -0.003 | 0.002 | 1.281 | 0.997 (0.993, 1.002) | 0.258 | 1.44 |
| Mean platelet volume | 0.096 | 0.088 | 1.197 | 1.101 (0.927, 1.309) | 0.274 | 1.37 |
| NLR | 0.042 | 0.02 | 4.545 | 1.043 (1.003, 1.083) | 0.033 | 1.53 |
| BNP | 0.003 | 0.001 | 13.58 | 1.003 (1.001, 1.005) | <0.001 | 2.16 |
| Coronary heart disease | 0.662 | 0.637 | 1.078 | 1.938 (0.556, 6.759) | 0.299 | 1.18 |
| Asthma history | 1.117 | 0.367 | 9.271 | 3.054 (1.489, 6.267) | 0.002 | 1.11 |
| Constant | -3.285 | 2.13 | 2.378 | — | 0.123 | — |
Table 2: Primary multivariable logistic regression model for pulmonary hypertension. This table presents regression coefficients, standard errors, Wald χ2 values, odds ratios, 95% confidence intervals, P-values, and variance inflation factors. D-dimer, NLR, BNP, and asthma history remained independently associated with PH. Abbreviations: PH, pulmonary hypertension; SE, standard error; OR, odds ratio; CI, confidence interval; VIF, variance inflation factor; NLR, neutrophil-to-lymphocyte ratio; BNP, B-type natriuretic peptide.
Sensitivity analysis including pulmonary infection and heart failure
A sensitivity model was constructed by adding pulmonary infection and heart failure to the primary predictor set (Table 3). Pulmonary infection remained strongly associated with PH (OR = 24.80, 95% CI: 5.62–109.44, P < 0.001), and heart failure was also associated with PH (OR = 3.36, 95% CI: 1.52–7.43, P = 0.003). After these two variables were added, the associations of BNP and NLR were attenuated but remained directionally consistent. D-dimer and asthma history also retained positive associations. The sensitivity model showed higher apparent discrimination than the primary model (AUC = 0.91, 95% CI: 0.87–0.95), but it introduced substantial overlap with inflammatory and cardiac diagnostic states. Therefore, the four-variable model was retained as the primary nomogram, while the sensitivity model was reported to illustrate the influence of pulmonary infection and heart failure on the model's interpretation.
Construction of the nomogram
A nomogram was constructed using the four independent predictors retained in the primary multivariable logistic regression model: D-dimer, NLR, BNP, and asthma history (Figure 2A). Each predictor contributed a point value according to its regression weight, and the total score was mapped to the individualized predicted probability of PH. The illustrative case was revised to avoid values far outside the observed clinical distribution. In the revised example, an elderly patient hospitalized with AECOPD had a D-dimer level of 0.90 µg/mL, an NLR of 10.0, a BNP level of 230 pg/mL, and a history of asthma. The estimated total score was 173 points, corresponding to a PH probability of 78.4% on the nomogram (Figure 2B).
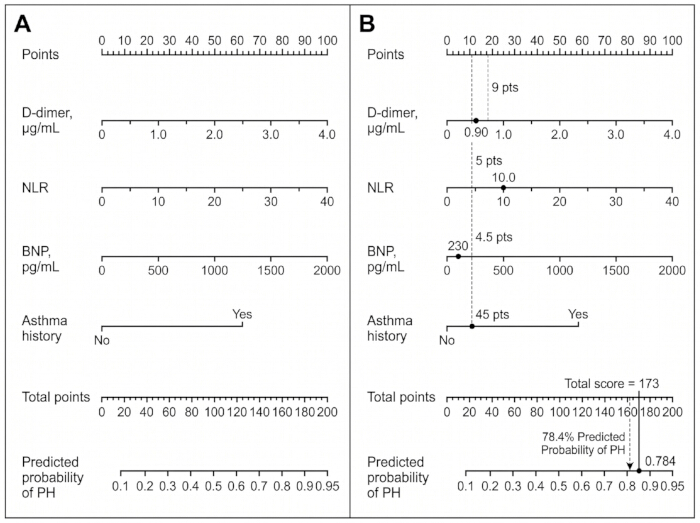
Figure 2: Nomogram for estimating pulmonary hypertension risk in elderly patients with AECOPD. (A) The nomogram was constructed using D-dimer, NLR, BNP, and asthma history. Each predictor was assigned a point value, and the total score was mapped to the predicted probability of PH. (B) A revised example showed D-dimer = 0.90 µg/mL, NLR = 10.0, BNP = 230 pg/mL, and asthma history = Yes, corresponding to 173 points and an estimated PH probability of 78.4%. Abbreviations: AECOPD, acute exacerbation of chronic obstructive pulmonary disease; PH, pulmonary hypertension; NLR, neutrophil-to-lymphocyte ratio; BNP, B-type natriuretic peptide. Please click here to view a larger version of this figure.
Discrimination of the prediction model
The four-variable nomogram achieved an area under the receiver operating characteristic curve of 0.82, with a 95% confidence interval of 0.760–0.874 (Figure 3A). In comparison, D-dimer alone had an area under the curve of 0.623, NLR alone had an area under the curve of 0.666, and BNP alone had an area under the curve of 0.748. A model combining the three quantitative markers yielded an area under the curve of 0.793 (Figure 3B). Thus, the nomogram showed better discrimination than each individual marker and slightly better discrimination than the three-marker model.
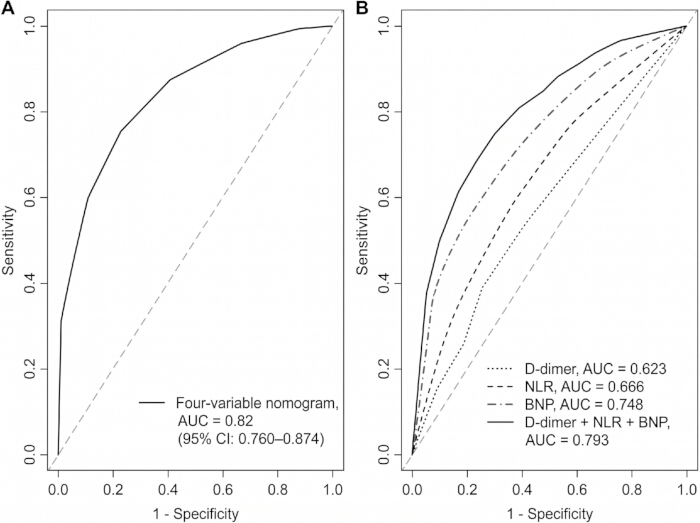
Figure 3: Receiver operating characteristic curves for the nomogram and quantitative predictors. (A) The four-variable nomogram achieved an AUC of 0.82, with a 95% CI of 0.760–0.874. (B) The AUC values were 0.623 for D-dimer, 0.666 for NLR, 0.748 for BNP, and 0.793 for the combined quantitative-marker model. Abbreviations: ROC, receiver operating characteristic; AUC, area under the curve; NLR, neutrophil-to-lymphocyte ratio; BNP, B-type natriuretic peptide. Please click here to view a larger version of this figure.
Calibration and internal validation
Internal validation was performed using bootstrap resampling with 1,000 replicates. Calibration analysis compared predicted PH probabilities with observed PH outcomes (Figure 4). The apparent calibration intercept was 0.0000, and the apparent calibration slope was 1.0000. After bootstrap correction, the calibration intercept was -0.08, and the calibration slope was 0.86. The mean absolute calibration error was 0.054, and the Brier score was 0.1878. The Hosmer-Lemeshow test was statistically significant (P = 0.0005), indicating residual calibration deviation. Therefore, despite good discrimination, the calibration findings were interpreted cautiously, and recalibration may be required before use in other settings.
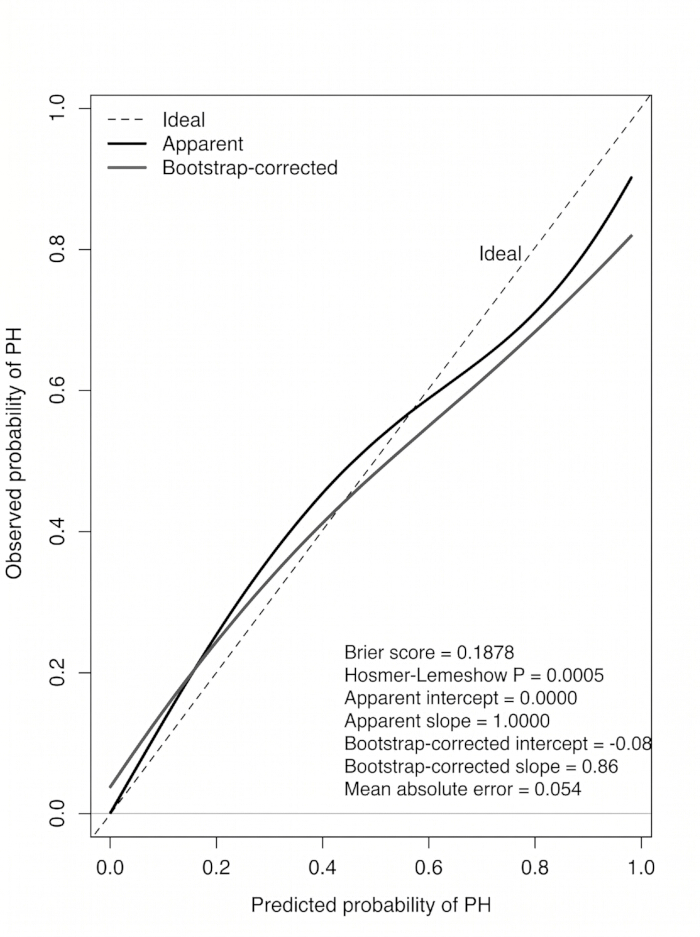
Figure 4: Calibration curve of the pulmonary hypertension prediction nomogram. The calibration curve compares predicted and observed PH probabilities. Apparent and bootstrap-corrected curves were generated using 1,000 bootstrap resamples. The Brier score was 0.1878, and the Hosmer-Lemeshow test was significant (P = 0.0005), indicating residual calibration deviation. Abbreviations: PH, pulmonary hypertension; HL, Hosmer-Lemeshow. Please click here to view a larger version of this figure.
Clinical utility assessed by decision curve analysis
Decision curve analysis showed that the nomogram curve remained above both the treat-all and treat-none reference strategies across a threshold probability range of approximately 1%–70% (Figure 5). This finding suggested potential net benefit for identifying elderly patients with AECOPD who may require closer echocardiographic review, cardiopulmonary monitoring, or further diagnostic evaluation. Because the model was validated only internally, the decision curve findings were interpreted as preliminary evidence of clinical usefulness rather than proof of implementation benefit.
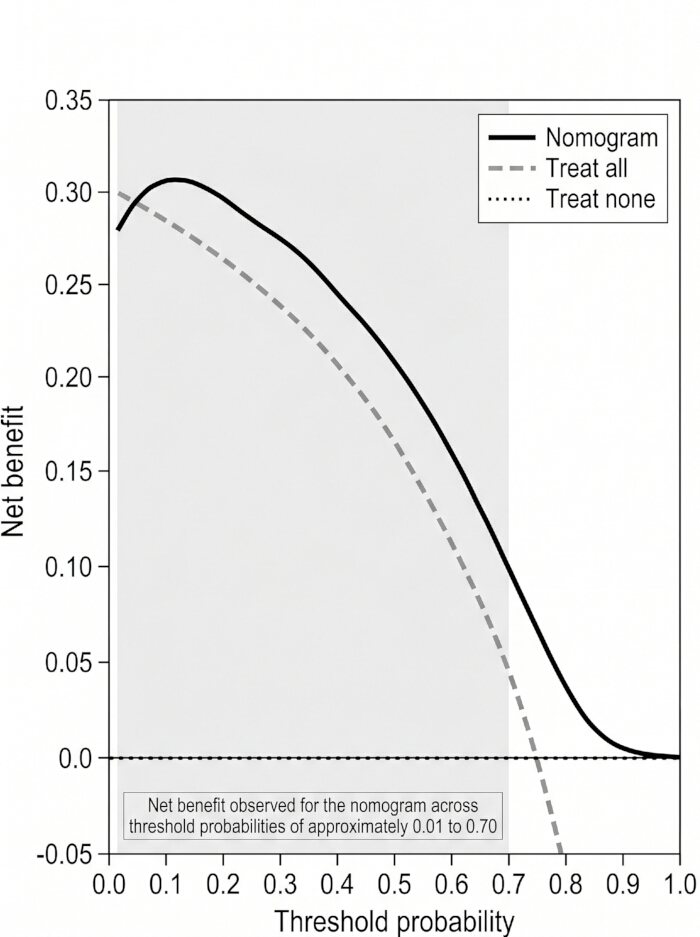
Figure 5: Decision curve analysis of the pulmonary hypertension prediction nomogram. Decision curve analysis showed that the nomogram provided potential net benefit across threshold probabilities ranging from approximately 1%–70% compared with the treat-all and treat-none strategies. Abbreviations: DCA, decision curve analysis; PH, pulmonary hypertension. Please click here to view a larger version of this figure.
Overall model findings
PH risk in elderly patients hospitalized with AECOPD was associated with inflammatory, coagulation-related, cardiac stress, and airway disease-related information. NLR, BNP, D-dimer, and asthma history were independently associated with PH and were integrated into a nomogram with good discrimination. Sensitivity analysis showed that pulmonary infection and heart failure were strongly associated with PH, but their inclusion increased overlap with inflammatory and cardiac stress markers. Calibration was not fully optimal, especially given the significant Hosmer-Lemeshow test. These findings support the nomogram as an internally validated risk stratification tool that requires external validation and possible recalibration before broader clinical use.
DATA AVAILABILITY:
The dataset supporting the findings of this study has been deposited in the Figshare repository and is publicly available at: https://doi.org/10.6084/m9.figshare.32765667.v1 .
| Analysis Item | Primary Four-Variable Nomogram | Sensitivity Model Including Pulmonary Infection and Heart Failure |
| Included predictors | D-dimer, NLR, BNP, asthma history | D-dimer, NLR, BNP, asthma history, pulmonary infection, heart failure |
| Pulmonary infection OR (95% CI) | Not included | 24.80 (5.62, 109.44) |
| Heart failure OR (95% CI) | Not included | 3.36 (1.52, 7.43) |
| D-dimer direction | Positive | Positive |
| NLR direction | Positive | Positive but attenuated |
| BNP direction | Positive | Positive but attenuated |
| Asthma history direction | Positive | Positive |
| AUC (95% CI) | 0.82 (0.760, 0.874) | 0.91 (0.87, 0.95) |
| Brier score | 0.1878 | 0.146 |
| Apparent calibration intercept | 0 | 0 |
| Apparent calibration slope | 1 | 1 |
| Bootstrap-corrected calibration intercept | -0.08 | -0.05 |
| Bootstrap-corrected calibration slope | 0.86 | 0.89 |
| Mean absolute calibration error | 0.054 | 0.041 |
| Hosmer-Lemeshow P-value | 0.0005 | 0.021 |
| Decision curve threshold range with net benefit | Approximately 1%–70% | Approximately 2%–75% |
| Model role | Primary nomogram | Sensitivity analysis only |
Table 3: Sensitivity analysis and internal validation indicators. This table compares the primary four-variable nomogram with the sensitivity model that additionally included pulmonary infection and heart failure. Discrimination, calibration, Hosmer-Lemeshow testing, decision curve range, and bootstrap-corrected indicators are shown. Abbreviations: AUC, area under the receiver operating characteristic curve; OR, odds ratio; CI, confidence interval; NLR, neutrophil-to-lymphocyte ratio; BNP, B-type natriuretic peptide.
Discussion
This study developed a routine-data-based nomogram to estimate the risk of pulmonary hypertension (PH) in elderly patients hospitalized with acute exacerbation of chronic obstructive pulmonary disease (AECOPD). Four readily available variables, namely neutrophil-to-lymphocyte ratio (NLR), B-type natriuretic peptide (BNP), D-dimer, and asthma history, were retained in the primary model. The nomogram showed better discrimination than single quantitative markers and potential net benefit across a broad threshold range. However, calibration was not fully optimal, as indicated by the significant Hosmer-Lemeshow test and bootstrap-corrected calibration results. Therefore, the model should be interpreted as an internally validated risk stratification tool rather than a diagnostic substitute or an implementation-ready clinical instrument.
The selected predictors are biologically plausible in AECOPD-related PH. NLR reflects the balance between neutrophil-driven inflammation and lymphocyte-related immune regulation. In acute exacerbations of COPD, this ratio has been described as a clinically accessible marker of inflammatory burden and disease activity19. In COPD complicated by PH, higher NLR has also been associated with pulmonary vascular involvement and worse clinical status20. BNP added a different dimension of risk information. In patients with COPD, natriuretic peptide elevation may reflect right ventricular pressure overload, coexisting cardiac dysfunction, or broader cardiopulmonary stress21. D-dimer represented the coagulation-related component of the model. Prior work has linked elevated D-dimer with mortality after AECOPD, supporting its value as a marker of acute systemic risk22. Inflammation-based biomarkers, including D-dimer-related and blood-count-derived indices, have also been evaluated for predicting PH during AECOPD23. These findings support the interpretation that PH risk in this cohort was shaped by inflammatory, cardiac stress, coagulation-related, and airway phenotype information rather than by a single pathway.
The broader literature further supports the translational relevance of routine inflammatory and coagulation-related markers. D-dimer has been studied as a marker of thromboinflammatory severity and in-hospital mortality in COVID-1924. NLR-derived indices have also been evaluated as predictors of progression and mortality among critically ill patients with COVID-1925. Fibrinogen and D-dimer variation has been discussed in relation to coagulation disturbance and anticoagulation decision-making in systemic viral inflammation26. These studies do not prove that the same mechanisms operate identically in AECOPD-related PH. They do, however, support the broader concept that routine hematologic and coagulation indices can capture clinically relevant host-response signals across pulmonary and systemic inflammatory diseases.
Asthma history was the only comorbidity retained in the primary nomogram. This finding may reflect a subgroup with overlapping airway inflammation, remodeling, mucus hypersecretion, and greater vulnerability to exacerbations. In elderly patients with COPD, a history of asthma may mark a more complex airway disease phenotype rather than a simple background diagnosis. The retrospective design cannot confirm an asthma-COPD overlap mechanism, but the association suggests that a history of asthma should be considered when assessing PH risk during AECOPD hospitalization.
The study also clarifies the role of pulmonary infection and heart failure. Both variables showed strong univariate associations with PH and remained influential in sensitivity analysis. Their exclusion from the primary nomogram was not intended to dismiss their clinical importance. Rather, pulmonary infection partly overlaps with inflammatory markers, and heart failure partly overlaps with BNP and echocardiographic cardiac findings. Including these variables increased apparent performance but also increased clinical redundancy. The four-variable nomogram was therefore retained as the primary model to emphasize early, routinely measurable predictors, while the sensitivity model was used to show how pulmonary infection and heart failure affected model interpretation.
The main contribution of this study is practical rather than mechanistic. A point-based nomogram can translate multivariable regression results into an individualized visual estimate of the probability of PH. Transparent reporting is essential for clinical prediction models, especially when a model is proposed for risk stratification rather than causal inference27. The TRIPOD Explanation and Elaboration document also emphasizes complete reporting of predictor selection, model performance, validation, and clinical applicability28. In recent clinical studies, nomogram-based tools have been used to support individualized bedside risk estimation in cardiovascular settings29. Similar risk-prediction approaches have also been proposed for elderly patients undergoing non-elective surgery, highlighting the growing interest in interpretable clinical prediction tools30. In the present study, the significant Hosmer-Lemeshow test and bootstrap-corrected calibration slope indicate that predicted probabilities may require recalibration before use outside the derivation setting. Thus, the nomogram may help identify patients who warrant closer echocardiographic review or cardiopulmonary monitoring, but it should not replace guideline-based assessment or right-heart catheterization when a definitive diagnosis is required.
Several limitations should be acknowledged. First, this was a single-center retrospective study, and selection bias, missing information, and center-specific diagnostic practice may have influenced the results. Second, PH was defined by transthoracic echocardiography rather than right-heart catheterization. Although echocardiography is widely used in routine practice, acoustic window limitations in COPD may lead to pressure estimation errors or outcome misclassification. Third, the model was validated only internally; no external cohort was available. Fourth, pulmonary function indices, arterial blood gas parameters, medication exposure, exacerbation history, imaging-derived variables, treatment response, and long-term outcomes were not fully incorporated. Fifth, the significant Hosmer-Lemeshow test result indicates residual calibration deviation; therefore, absolute predicted probabilities should be interpreted with caution.
Alternative study designs could further test the hypothesis. A prospective multicenter cohort could standardize blood sampling, echocardiography quality control, and predictor definitions. A diagnostic accuracy study using right-heart catheterization in a representative subset could clarify the extent of outcome misclassification. Time-to-event studies could examine whether the same variables predict mortality, readmission, PH progression, or right-heart failure. Comparative modeling could also test whether adding pulmonary function, blood gas, computed tomography, or echocardiographic right-heart parameters improves prediction beyond the four routine variables.
Future work should focus on external validation, recalibration, and clinical usability. The model should be tested in hospitals with varying patient case mixes, laboratory platforms, and echocardiographic workflows. If performance remains stable, the workflow could support early triage of elderly patients with AECOPD who may require closer cardiopulmonary monitoring or specialist evaluation. At this stage, the nomogram provides a practical and reproducible risk-estimation approach, but broader implementation requires prospective validation and assessment of whether model-guided decisions improve patient management.
Disclosures
The authors declare no competing financial interests or other conflicts of interest related to this work.
Author Contributions
Mingfeng Wu: Study design, supervision and implementation, manuscript drafting and revision, and coordination of team responsibilities; Li Zhang: Data collection and organization, statistical analysis, and manuscript drafting; Xiong Wang: Data collection and manuscript drafting; Shaohua Xu: Statistical analysis and manuscript revision; Li Xie: Manuscript revision.
Acknowledgements
This study was supported by the Scientific Research Projects of the Sichuan Provincial Administration of Traditional Chinese Medicine, including Practical Exploration of Constructing a Pulmonary Hypertension Prediction Model for Elderly Patients with Chronic Obstructive Pulmonary Disease Based on the NLR Ratio (Grant No. 25MSZX321) and Construction of a County Medical Community Laboratory Service Model and Policy Response Research Driven by “Drone Delivery + AI-Assisted Diagnosis” (Grant No. 25MSZX322). The authors thank Santai County Traditional Chinese Medicine Hospital for supporting this study.
Materials
| Name | Company | Catalog Number | Comments |
|---|---|---|---|
| Automated clinical chemistry analyzer | Mindray Bio-Medical Electronics Co., Ltd. | BS-480 | Used to measure serum albumin, creatinine, and high-sensitivity C-reactive protein in routine clinical laboratory testing. |
| Automated coagulation analyzer | Mindray Bio-Medical Electronics Co., Ltd. | C3510 | Used to measure D-dimer and fibrinogen in routine coagulation testing. |
| Automated hematology analyzer | Mindray Bio-Medical Electronics Co., Ltd. | BC-5380 | Used to measure neutrophil count, lymphocyte count, platelet count, mean platelet volume, and red-cell distribution width coefficient of variation. |
| Chemiluminescence immunoassay analyzer | Mindray Bio-Medical Electronics Co., Ltd. | CL-1200i | Used to measure B-type natriuretic peptide in routine clinical laboratory testing. |
| Chemiluminescence immunoassay reagents, calibrators, and controls | Mindray Bio-Medical Electronics Co., Ltd. | CL-series reagent system | Used for chemiluminescence immunoassay testing and quality control. |
| Clinical chemistry reagents, calibrators, and controls | Mindray Bio-Medical Electronics Co., Ltd. | BS-series reagent system | Used for routine clinical chemistry assays performed on the BS-series analyzer. |
| Coagulation calibrators and controls | Mindray Bio-Medical Electronics Co., Ltd. | Product-specific* | Used for quality control and calibration of coagulation assays. |
| dcurves package | CRAN | dcurves | Used to perform decision curve analysis and calculate clinical net benefit across threshold probabilities. |
| EDTA venous blood collection tube | BD | Vacutainer K2EDTA tube (REF 367856) | Used for complete blood count testing. |
| Electronic medical record system | Santai County Traditional Chinese Medicine Hospital | Not applicable | Used to retrieve inpatient demographic characteristics, admission records, discharge diagnoses, comorbidities, progress notes, imaging reports, consultation records, and clinical outcomes. |
| Hematology reagents, calibrators, and controls | Mindray Bio-Medical Electronics Co., Ltd. | BC-series reagent system | Used for routine complete blood count testing and analyzer quality control. |
| IBM SPSS Statistics | IBM Corp. | Version 26.0 | Used for descriptive statistics, group comparisons, and preliminary logistic regression analysis. |
| Laboratory information system | Santai County Traditional Chinese Medicine Hospital | Not applicable | Used to retrieve complete blood count indices, biochemical indices, coagulation markers, inflammatory markers, and cardiac stress markers. |
| pROC package | CRAN | pROC | Used for receiver operating characteristic curve analysis and area-under-the-curve estimation. |
| R statistical software | R Foundation for Statistical Computing | Version 4.5.2 | Used for logistic regression modeling, nomogram construction, receiver operating characteristic curve analysis, calibration assessment, bootstrap internal validation, and decision curve analysis. |
| ResourceSelection package | CRAN | ResourceSelection | Used to perform the Hosmer-Lemeshow goodness-of-fit test. |
| rms package | CRAN (Frank E. Harrell Jr.) | rms | Used for regression modeling, nomogram construction, calibration assessment, and internal validation. |
| Serum separator venous blood collection tube | BD | Vacutainer SST tube (REF 367820) | Used for serum biochemical and inflammatory marker testing. |
| Sodium citrate venous blood collection tube | BD | Vacutainer citrate tube (REF 363080) | Used for coagulation testing, including D-dimer and fibrinogen. |
| Standardized clinical data extraction form | Created by the study team | Not applicable | Used to extract predefined demographic, clinical, laboratory, and echocardiographic variables from retrospective records. |
| Transthoracic echocardiography system | GE HealthCare | Vivid E95 | Used to estimate pulmonary arterial systolic pressure and evaluate right ventricular size, wall thickness, and systolic function. |
References
- Adeloye D, et al. Global, regional, and national prevalence of, and risk factors for, chronic obstructive pulmonary disease (COPD) in 2019: a systematic review and modelling analysis. Lancet Respir Med. 2022;10:447-58.
- Chronic Obstructive Pulmonary Disease Group of Chinese Thoracic Society, Chronic Obstructive Pulmonary Disease Committee of Chinese Association of Chest Physician. Guidelines for the diagnosis and management of chronic obstructive pulmonary disease, revised version 2021. Chin J Tuberc Respir Dis. 2021;44:170-205.
- Johnson S, et al. Pulmonary hypertension: a contemporary review. Am J Respir Crit Care Med. 2023;208:528-48.
- Munshi RF, Pellegrini JR Jr, Patel P, Anjum F. Impact of pulmonary hypertension in patients with acute exacerbation of chronic obstructive pulmonary disease and its effect on healthcare utilization. Pulm Circ. 2021;11(3):20458940211046838.
- Prins KW, et al. Disproportionate right ventricular dysfunction and poor survival in group 3 pulmonary hypertension. Am J Respir Crit Care Med. 2018;197:1496-9.
- Andersen KH, et al. Prevalence, predictors, and survival in pulmonary hypertension related to end-stage chronic obstructive pulmonary disease. J Heart Lung Transplant. 2012;31:373-80.
- Chen Y, et al. Right heart catheterization-related complications: a review of the literature and best practices. Cardiol Rev. 2020;28:36-41.
- Younis M, et al. Echocardiography and pulmonary hypertension in patients with chronic obstructive pulmonary disease undergoing lung transplantation evaluation. Am J Med Sci. 2024;367:95-104.
- Pascual-González Y, López-Sánchez M, Dorca J, Santos S. Defining the role of neutrophil-to-lymphocyte ratio in COPD: a systematic literature review. Int J Chron Obstruct Pulmon Dis. 2018;13:3651-62.
- Lee SJ, et al. Usefulness of neutrophil to lymphocyte ratio in patients with chronic obstructive pulmonary disease: a prospective observational study. Korean J Intern Med. 2016;31:891-8.
- Leuchte HH, et al. Brain natriuretic peptide is a prognostic parameter in chronic lung disease. Am J Respir Crit Care Med. 2006;173:744-50.
- Husebø GR, et al. Coagulation markers as predictors for clinical events in COPD. Respirology. 2021;26:342-51.
- Iasonos A, Schrag D, Raj GV, Panageas KS. How to build and interpret a nomogram for cancer prognosis. J Clin Oncol. 2008;26:1364-70.
- Balachandran VP, Gonen M, Smith JJ, DeMatteo RP. Nomograms in oncology: more than meets the eye. Lancet Oncol. 2015;16(4):e173-e180.
- Global Initiative for Chronic Obstructive Lung Disease. Global Strategy for the Diagnosis, Management, and Prevention of Chronic Obstructive Pulmonary Disease: 2021 Report. Global Initiative for Chronic Obstructive Lung Disease; Fontana; 2021.
- Galiè N, et al. 2015 ESC/ERS Guidelines for the diagnosis and treatment of pulmonary hypertension. Eur Heart J. 2016;37:67-119.
- Wu Z, Zhan S, Wang D, Tang C. A novel nomogram for predicting the risk of acute heart failure in intensive care unit patients with COPD. Chronic Obstr Pulm Dis. 2025;12(2):117-126.
- Cheng H, et al. A risk nomogram for predicting prolonged intensive care unit stays in patients with chronic obstructive pulmonary disease. Front Med. 2023;10:1177786.
- Zinellu A, et al. Clinical significance of the neutrophil-to-lymphocyte ratio and platelet-to-lymphocyte ratio in acute exacerbations of COPD: present evidence and future perspectives. Eur Respir Rev. 2022;31(166):220095.
- Jiang T, et al. Value of the neutrophil-to-lymphocyte ratio in chronic obstructive pulmonary disease complicated with pulmonary hypertension. J Int Med Res. 2023;51(1):3000605231200266.
- Hawkins NM, et al. B-type natriuretic peptides in chronic obstructive pulmonary disease: a systematic review. BMC Pulm Med. 2017;17:11.
- Hu G, et al. Prognostic role of D-dimer for in-hospital and 1-year mortality in exacerbations of COPD. Int J Chron Obstruct Pulmon Dis. 2016;11:2729-36.
- Zuo H, et al. Predictive value of novel inflammation-based biomarkers for pulmonary hypertension in the acute exacerbation of chronic obstructive pulmonary disease. Anal Cell Pathol (Amst). 2019;2019:5189165.
- Hayiroglu MI, Cicek V, Kilic S, Cinar T. Mean serum D-dimer level to predict in-hospital mortality in COVID-19 patients. Rev Assoc Med Bras (1992). 2021;67:1108-13.
- Guney BC, et al. Evaluation of N/LP ratio as a predictor of disease progression and mortality in COVID-19 patients admitted to the intensive care unit. Medeni Med J. 2021;36:241-8.
- Hayiroglu MI, Cinar T, Tekkesin AI. Fibrinogen and D-dimer variances and anticoagulation recommendations in COVID-19: current literature review. Rev Assoc Med Bras (1992). 2020;66:842-8.
- Collins GS, Reitsma JB, Altman DG, Moons KGM. Transparent reporting of a multivariable prediction model for individual prognosis or diagnosis: the TRIPOD statement. Ann Intern Med. 2015;162:55-63.
- Moons KGM, et al. Transparent reporting of a multivariable prediction model for individual prognosis or diagnosis: explanation and elaboration. Ann Intern Med. 2015;162(1):W1-W73.
- Kalenderoglu K, et al. Heart rate variability nomogram predicts atrial fibrillation in patients with moderate to high burden of premature ventricular complexes. Medicina (Kaunas). 2026;62:243.
- Cicek V, et al. A new risk prediction model for the assessment of myocardial injury in elderly patients undergoing non-elective surgery. J Cardiovasc Dev Dis. 2025;12(1):6.