This protocol embeds a diagnosis-decision-defense competition sequence into undergraduate Strategic Management instruction through staged team tasks, structured feedback, rater training, implementation-fidelity monitoring, and separate student- and team-level outcome review.
A subscription to JoVE is required to view this content. Sign in or start your free trial.
Method Article
Integrating Course-Based Competitions into Strategic Management Instruction: A Reproducible Course Improvement Protocol
In This Article
Summary
Abstract
Strategic Management instruction requires students to apply analytical frameworks to uncertain, resource-constrained, and trade-off-based business situations. Course competitions can support this process when they are organized as a structured instructional system rather than as a single presentation activity. This article describes a reproducible protocol for integrating a three-stage course-based competition into an undergraduate Strategic Management course. The protocol follows a 16-week sequence that includes baseline assessment, core instruction, enterprise case introduction, team formation, strategic diagnosis, strategic decision simulation or decision-sheet completion, final strategy defense, post-course assessment, and course review. The instructional mechanism combines staged practice, enterprise case exposure, structured formative feedback, team accountability, oral defense, and rubric-based scoring. Locally operationalized process indicators are used to monitor classroom interaction, case-design completeness, feedback timeliness, task-rubric alignment, student engagement, and implementation fidelity. Student-level outcomes, team-level competition outcomes, rater agreement, missing-data patterns, artificial intelligence use disclosure, and score-inflation warning patterns are analyzed separately to avoid unit-of-analysis problems. Representative results, when reported, should be interpreted as context-specific implementation outputs from a retrospective, non-randomized educational-record comparison, not as evidence of causal effectiveness. The protocol provides an auditable procedure for designing, implementing, documenting, evaluating, and refining competition-integrated Strategic Management instruction within a course-improvement cycle.
Introduction
Strategic Management courses require students to move beyond conceptual recall. Students must apply ideas such as industry structure, competitive advantage, resource allocation, strategic choice, and implementation under conditions of incomplete information and competing priorities. Competitive positioning explains how firms choose positions under external constraints1, whereas the resource-based view emphasizes firm-specific resources and capabilities that shape strategic options2. These perspectives make Strategic Management suitable for applied teaching designs in which students diagnose a business situation, make a strategic choice, defend the choice, and revise their reasoning after feedback. Lectures and isolated case discussions remain useful, but they may not fully expose how students reason through uncertainty, trade-offs, and implementation constraints. A course-based competition can create a more demanding learning environment only when it is connected to course objectives, task sequencing, scoring criteria, and feedback cycles. Without these elements, competition may reward presentation confidence or task division rather than strategic reasoning.
Prior work on business games and simulations has shown that these activities require explicit rules, decision cycles, assessment evidence, and debriefing if they are to function as educational methods rather than classroom entertainment3,4. Active learning also depends on task design rather than activity alone. Students may appear engaged while still applying concepts superficially. A structured Strategic Management competition should therefore require students to analyze a situation, justify a decision, receive formative feedback, revise their reasoning, and defend an implementation plan. This sequence reflects active learning principles because students produce, test, and refine their own reasoning rather than only listen to instruction5. It also reflects experiential learning because the competition cycle links concrete case exposure, reflective analysis, decision making, and revised action6.
Published business simulation and competition reports vary widely in their procedural detail. Some describe the use of a simulation or competition but provide limited information about team formation, task staging, feedback timing, rater training, rubric construction, missing-data handling, or separation of individual and team outcomes. Previous reviews and taxonomies have also shown that business games are not a single instructional method; they differ in rules, fidelity, learner roles, decision structure, technology use, assessment design, and debriefing procedures7,8. A reproducible Strategic Management protocol, therefore, needs to specify not only that a competition occurred, but how the competition was embedded into the course and how its implementation was monitored.
This protocol is best understood as a multicomponent competition-integrated course improvement package. The expected instructional effect cannot be attributed solely to competition, as the protocol also includes enterprise case exposure, repeated practice, structured feedback, team accountability, public defense, rater calibration, and systematic course review. The competition element is educationally useful because it creates deadlines, comparison, accountability, and public justification, but these elements are deliberately combined with staged learning tasks and assessment controls. The procedure differs from conventional experiential, simulation-based, and competition-based Strategic Management teaching in three ways. First, the competition is staged across diagnosis, decision, and final defense rather than concentrated in a single final presentation. Second, implementation fidelity is monitored before learning outcomes are interpreted. Third, student-level learning outcomes are separated from team-level competition outcomes. This distinction is important because a team may perform well in a final defense while some members show limited individual learning. Team learning requires accountability, interaction, and shared reasoning, not only group membership9. The protocol therefore uses team charters, process logs, peer contribution forms, rater training, rater agreement checks, and score-inflation warning rules.
The protocol was implemented as a routine teaching activity in an undergraduate Strategic Management course at the Business School, Zhuhai College of Science and Technology, China. The protocol cohort was taught in course section SM-2025-F01 during the fall semester of the 2025-2026 academic year. The comparison cohort was a historical cohort taught in course section SM-2024-F01 during the fall semester of the 2024–2025 academic year. The protocol course section enrolled 96 students; 94 students provided written or electronic consent for research use of de-identified course records after ethics approval and before inclusion in the research dataset, 2 students were excluded because of course withdrawal before Week 8 or absence of any valid post-course outcome, and 92 students formed the final analytic protocol cohort. The historical comparison section enrolled 92 students; 90 students consented to research use of de-identified course records after ethics approval and before retrospective extraction, 2 were excluded after applying the same missing-data and withdrawal rules, and 88 students formed the final analytic comparison cohort.
Both cohorts consisted of third-year undergraduate business students. Majors included Business Administration, Marketing, E-Commerce, and International Business. The protocol cohort included 51 female and 41 male students, with a mean age of 20.4 ± 0.7 years. The comparison cohort included 49 female and 39 male students, with a mean age of 20.5 ± 0.8 years. Prior competition experience was reported by 27 students in the protocol cohort and 24 students in the comparison cohort. Attrition before final analysis was 4.2% in the protocol cohort and 4.3% in the comparison cohort. Missing-data counts in the protocol cohort were 2 baseline knowledge tests, 3 postcourse knowledge tests, 4 post-course learning surveys, and 4 incomplete competition-task records. Missing-data counts in the comparison cohort were 3 baseline knowledge tests, 4 postcourse knowledge tests, 5 postcourse learning surveys, and 70 incomplete competition-task records because the historical course did not contain the full three-stage competition process.
The comparison cohort received conventional case-based Strategic Management instruction without the complete three-stage competition sequence. The same instructor taught both cohorts. Both cohorts used comparable course learning outcomes, core Strategic Management topics, knowledge-assessment coverage, individual case-analysis assessment, and final course grading structure. The protocol cohort additionally received the enterprise case package, staged competition tasks, structured feedback cycles, formal team process records, rater training procedures, and implementation-fidelity monitoring. The present article describes the protocol as a reproducible course-improvement method rather than as a claim of causal effectiveness. The representative results show the types of implementation, instructional quality, student-level, team-level, scoring reliability, missing data, and troubleshooting outputs generated by the protocol. Because the comparison is historical, non-randomized, and context-specific, differences between cohorts should be interpreted as course-improvement evidence within one implementation context, not as proof that course-based competition alone caused the observed outcomes.
The broader purpose of the protocol is to help instructors design, document, evaluate, and refine competition-integrated Strategic Management instruction. It supports assurance of learning by linking teaching activities, student outputs, scoring rubrics, implementation records, and course review decisions10. It also addresses concerns in gamification and competitive learning research that game-like elements may yield mixed outcomes when motivation is emphasized without sufficient attention to task design, feedback quality, and assessment validity11,12. The expected outputs include implementation records, locally operationalized instructional quality indicators, student-level learning outcomes, team-level competition outcomes, rater agreement evidence, artificial intelligence use disclosures, missing-data documentation, and troubleshooting records.
Access restricted. Please log in or start a trial to view this content.
Protocol
The research use of de-identified educational records from both cohorts was approved by the Teaching Research Ethics Committee of Zhuhai College of Science and Technology, Zhuhai, China (Approval No.20260507001; approval date: 7 May 2026). The approval covered the protocol cohort and the historical comparison cohort, including routine course records, surveys, classroom observations, team process records, competition scores, rater scores, learning platform records, and de-identified gradebook variables. The 16-week course was delivered as routine Strategic Management teaching prior to data extraction for research, and no identifiable research dataset was extracted, coded, analyzed, or reported before ethics approval. Written or electronic consent for research use of de-identified course records was obtained after ethics approval and before dataset inclusion. Course participation was separated from research data use; non-consenting students completed the course normally but were excluded from research analysis. Consent records were stored separately from the gradebook, the code-to-identity file was restricted to the data manager, and the analysis-ready dataset was created only after grade submission, consent verification, code assignment, and removal of direct identifiers and identifiable free-text comments.
1. Establish the competition-integrated course improvement protocol.
- Define the protocol as a 16-week competition-integrated course improvement process for an undergraduate Strategic Management course. The instructional mechanism is a staged diagnosis-decision-defense cycle linking strategic analysis, evidence-based decision making, feedback, team accountability, oral defense, and course review.
- Define instructional quality through classroom interaction, case-design completeness, feedback timeliness, task-rubric alignment, and student engagement. Define implementation fidelity through planned activity completion, enterprise or case-session completion, task completion, feedback turnaround, rubric completion, observation completion, and rater-training completion. Aggregate indicators only when reliability and dimensional evidence support aggregation.
- Align learning outcomes, teaching activities, competition tasks, rubrics, feedback points, and outcome measures before course delivery to maintain constructive alignment13.
- Assign the roles of course instructor, competition coordinator, enterprise liaison, classroom observer, rater coordinator, and data manager. Teaching roles may be combined in small programs, but the data manager should remain separate from final grading and research dataset preparation whenever possible.
- Prepare a version-controlled course implementation folder containing the syllabus, case files, handbook, task templates, rubrics, observation forms, surveys, team records, scoring forms, feedback logs, AI-use disclosure forms, and version-control records. After ethics approval, create a research reproducibility folder containing the approval record, consent-verification record, de-identification log, de-identified datasets, data dictionary, cleaning log, analysis scripts, statistical outputs, figure source files, tables, and supplementary files (Figure 1 and the Table of Materials; operational templates are provided in Supplementary File 1).
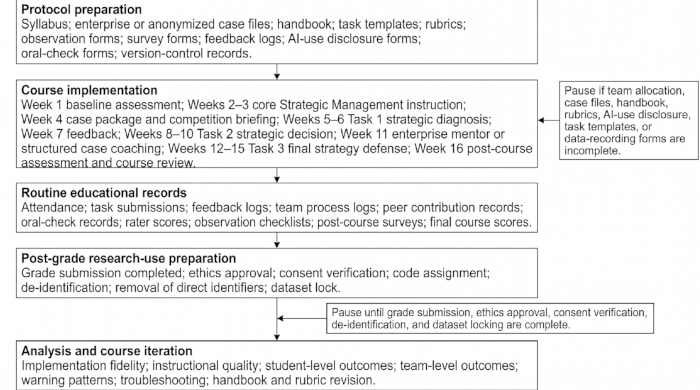
Figure 1: Workflow of the competition-integrated Strategic Management course improvement protocol. The workflow shows the sequence from course preparation to 16 week routine course implementation, routine educational-record generation, grade submission, ethics-approved research-use preparation, consent verification, de-identification, dataset locking, analysis, reporting, troubleshooting, and course refinement. The figure separates routine teaching activities from post-grade research data extraction and analysis. Please click here to view a larger version of this figure.
2. Recruit the student cohort and prepare the research dataset.
- Include students formally enrolled in the selected undergraduate Strategic Management section. Record institution, academic year, semester, section, cohort type, major, year level, teaching weeks, contact hours, enrollment, consented sample, exclusions, final analytic sample, demographics, prior competition experience, attrition, and missing-data counts.
- Define the protocol cohort as the class receiving the complete competition-integrated protocol and the comparison cohort as a historical class receiving conventional case-based Strategic Management instruction without the full three-stage competition sequence. Record whether the same instructor taught both cohorts and whether learning outcomes, assessment coverage, individual case-analysis requirements, and grading structure were comparable.
- After ethics approval, verify consent, assign non-identifiable student and team codes, remove direct identifiers, and apply the inclusion, exclusion, and missing-data rules in Table 1.
- Include consenting students with at least one valid post-course outcome. Exclude students from paired knowledge analysis when either knowledge test is missing and from competition-related analysis when all three task records are missing. Retain available records for other eligible analyses.
- Code missing research data as NA. Do not assign zero unless zero reflects an actual course score under the approved course policy. Create a participant-flow record for each cohort.
| Item | Operational definition | Application rule | Dataset variable | Analysis implication |
| Target course | Undergraduate Strategic Management course delivered in the selected semester | Include students formally enrolled in the selected course section | course_section | Defines the eligible teaching population |
| Protocol cohort | Class receiving the complete competition-integrated course improvement protocol | Code as 1 | cohort_type | Protocol cohort |
| Historical comparison cohort | Historical class receiving conventional case-based Strategic Management instruction without the complete three-stage competition process | Code as 0 | cohort_type | Non-randomized historical comparison cohort |
| Official enrollment | Student appears on the official course roster | Screen as potentially eligible | eligible_status | Required before research-use screening |
| Research consent | Student provides written or electronic consent for de-identified course-record use after ethics approval | Include only consenting students in the research dataset | consent_status | Non-consenting students complete the course normally but are excluded from research analysis |
| Course participation | Routine course learning activities completed regardless of research consent | Allow all enrolled students to attend class, join teams, complete course tasks, and receive grades | course_participation_status | Separates teaching participation from research participation |
| Valid post-course outcome | At least one valid post-course outcome is available | Include in analyses for which the relevant outcome is available | outcome_available | Allows available-case analysis |
| Course withdrawal before midpoint | Student withdraws before Week 8 | Exclude from the final research dataset | withdrawal_status | Reduces incomplete-exposure bias |
| Missing baseline knowledge test | Week 1 knowledge test is missing | Code as NA | pre_knowledge_missing | Exclude from paired knowledge analysis only |
| Missing post-course knowledge test | Week 16 knowledge test is missing | Code as NA | post_knowledge_missing | Exclude from paired knowledge analysis only |
| Missing both knowledge tests | Both baseline and post-course knowledge scores are missing | Exclude from knowledge-score analysis | knowledge_pair_status | Retain for other eligible analyses if data are available |
| Missing post-course survey | Anonymous post-course survey is missing | Code as NA | survey_missing | Retain in objective performance analyses |
| Missing one or two competition-task records | One or two task or mapped project records are missing | Code missing records as NA unless course policy assigns zero | task_score_missing | Retain available task or mapped project records |
| Missing all three competition-task records | No valid record for Task 1, Task 2, or Task 3 is available | Exclude from competition-related analyses | competition_completion | Retain for non-competition analyses if other outcomes are available |
| Duplicate record | More than one row appears for the same student code | Keep the verified final record after source-file checking | duplicate_check | Resolve before analysis |
| Identifier leakage | Name, student number, phone number, email, platform account, device identifier, or identifiable free-text comment appears | Remove identifier before analysis | identifier_check | Dataset cannot be analyzed until de-identified |
| Final analytic sample | Consenting students with usable data after exclusion and missing-data rules | Report final number and exclusion reasons | analysis_sample | Required for participant-flow reporting |
Table 1: Cohort structure, inclusion criteria, exclusion criteria, and missing-data rules. This table defines the protocol cohort, historical comparison cohort, eligibility criteria, research-use permission, exclusion criteria, missing-data handling, and analytic sample construction.
3. Implement the 16-week course sequence.
- Deliver the course over 16 teaching weeks, with 32 classroom contact hours and approximately 24-30 independent teamwork hours. Record instructional hours, teamwork time, case interaction, feedback, rehearsal, and assessment time separately.
- In Week 1, conduct the course briefing, baseline knowledge test, and baseline engagement survey as routine course activities. Explain the course process, task sequence, assessment rules, data-protection principles, and later research use of de-identified records. Deliver core Strategic Management instruction in Weeks 2–3 and short concept reinforcement during Weeks 4–15.
- In Week 4, introduce the enterprise case package and competition handbook, including task sequence, submission rules, rubrics, feedback timeline, team responsibilities, academic integrity rules, AI disclosure, oral-check procedure, and appeal process.
- Implement Task 1 in Weeks 5–6 and return feedback within 7 calendar days in Week 7. Require revision of the strategic issue statement before Task 214. Implement Task 2 in Weeks 8–10, enterprise mentor or structured case coaching in Week 11, and Task 3 in Weeks 12–15.
- In Week 16, conduct the post-course knowledge test, postcourse survey, data audit, and course review as routine course activities. Export, code, de-identify, and analyze records for research use only after ethics approval, consent verification, and grade submission (see Table 2).
PAUSE POINT: Pause after Week 4 if team allocation, case files, handbook, rubrics, AI disclosure form, task templates, or data-recording forms are incomplete. For research reporting, pause analysis until ethics approval, consent verification, grade submission, de-identification, and dataset locking are complete.
| Week | Activity | Instructional focus | Student or team output | Required record | Quality check |
| Week 1 | Course briefing and baseline assessment | Course process, assessment rules, baseline knowledge test, baseline engagement survey | Baseline knowledge test; baseline survey | Attendance; baseline test file; baseline survey file; course-briefing record | Confirm baseline assessment completion and routine course-record separation from later research use |
| Week 2 | Core Strategic Management instruction I | Environmental analysis, industry analysis, competitor analysis | In-class worksheet | Attendance; worksheet record | Check worksheet completion |
| Week 3 | Core Strategic Management instruction II | Internal resource analysis, strategic choice, implementation planning, performance evaluation | Short case-discussion response | Attendance; case-discussion record | Confirm core concepts before competition launch |
| Week 4 | Enterprise case introduction and competition briefing | Case package, handbook, task sequence, rubrics, AI disclosure, team rules, appeal procedure | Team list; team charter; AI-use acknowledgement | Team list; team charter; handbook access record; case access record | Pause if case files, handbook, rubrics, team records, task templates, or AI-use forms are incomplete |
| Week 5 | Task 1 begins | Strategic diagnosis report structure and evidence requirements | Draft strategic diagnosis report | Team process log; consultation record | Confirm team role allocation |
| Week 6 | Task 1 submission | Strategic diagnosis, industry and internal analysis, evidence use | Final Task 1 report | Submission record; report file | Identify missing or incorrectly formatted submissions |
| Week 7 | Task 1 feedback | Rubric-based feedback and revision direction | Revised strategic issue statement | Feedback log; feedback turnaround record | Pause if >15% of reports fail to meet the required structure |
| Week 8 | Task 2 begins | Decision sheet, simulation assumptions, decision variables | Initial strategic decision sheet | Team process log; observation record | Confirm understanding of decision variables |
| Week 9 | Strategic decision refinement | Market positioning, resource allocation, implementation sequence, risk assumptions | Revised decision sheet | Coaching record; observation checklist | Check evidence-based justification |
| Week 10 | Task 2 submission | Final strategic decision logic | Final Task 2 decision sheet | Task 2 score; submission record; decision-sheet file | Check submission completeness |
| Week 11 | Enterprise or structured case coaching | Mentor or case-based feedback on strategic dilemmas | Mentor reflection sheet; team revision plan | Enterprise engagement log; student questions; reflection record | Confirm attendance and reflection completion |
| Week 12 | Task 3 begins | Final defense format, executive summary, slide structure, Q&A rules | Draft presentation outline | Team process log; AI-disclosure update | Check workload balance using peer contribution form |
| Week 13 | Final defense preparation | Strategic coherence, feasibility, risk control, evidence use | Draft slide deck; executive summary | Coaching log; observation checklist | Confirm diagnosis-choice-implementation linkage |
| Week 14 | Rehearsal and rater calibration | Rehearsal defense and rater training | Rehearsal presentation | Rater training record; preliminary rubric check | Confirm scoring calibration |
| Week 15 | Final strategy defense | 8-min presentation and 5-min Q&A | Final slide deck; executive summary; oral defense | Task 3 scores; rater scores; Q&A notes | Calculate ICC for overlapping subjective scoring |
| Week 16 | Post-course assessment and course review | Post-course knowledge test, post-course survey, course review, routine data audit | Post-course knowledge test; post-course survey | Post-course test file; survey file; course-review record | Pause research analysis until grade submission, ethics approval, consent verification, de-identification, and dataset lock are complete |
Table 2: Sixteen-week implementation schedule for the competition-integrated Strategic Management course protocol. This table summarizes weekly protocol activities, instructional focus, student or team outputs, required records, and quality-control checkpoints across the 16-week course.
4. Prepare enterprise cases and competition materials.
- Select one main enterprise case and two optional supporting cases from public, anonymized, or enterprise-approved teaching materials. Screen each case for industry context, managerial decision problem, resource constraint, strategic trade-off, implementation challenge, and measurable consequence. Use “case-design completeness” rather than “case authenticity” unless independent validation is available.
- Prepare an anonymized model case when enterprise-approved materials are unavailable. Specify the industry, firm size, customer segment, competitive pressure, resource constraint, strategic decision, implementation risk, and expected consequence. Remove confidential enterprise information, including company names, exact financial figures, customer information, employee information, proprietary data, and strategic documents without written permission. The case template is provided in Supplementary File 1.
- Prepare the handbook, task templates, peer contribution form, team process log, feedback log, AI-use disclosure form, oral-check record form, rubrics, and version-control table. Permit disclosed AI use for language polishing, formatting, grammar checking, general brainstorming, and slide-layout improvement. Prohibit AI use that replaces student-generated diagnosis, evidence selection, decision justification, risk analysis, implementation planning, or oral defense.
- Design rubrics to prioritize strategic reasoning over polished text. Score evidence use, trade-off reasoning, implementation feasibility, internal consistency, and oral defense separately from presentation style. Upload the handbook, templates, rubrics, case materials, AI-use rules, and appeal procedure before Week 4.
5. Form student teams and assign team roles.
- Form teams of 4–6 students. Use stratified grouping when baseline course performance, major, gender, or prior competition experience is available and permitted by institutional course policy.
- Assign one primary role to each student before Task 1. Require each team to submit a team charter and maintain a process log that documents role allocation, communication rules, contribution expectations, deadlines, AI use responsibilities, attendance, decisions, evidence reviewed, unresolved problems, and next actions.
- Collect peer contribution scores at the midpoint and final stage to identify contribution imbalance. Conduct individual oral checks during coaching, rehearsal, or final defense by asking selected students to explain the team’s diagnosis, evidence base, decision logic, risk assumptions, or implementation plan in their own words.
6. Conduct baseline assessment.
- Administer the baseline Strategic Management knowledge test in Week 1 before enterprise case introduction and competition tasks as a routine course assessment.
- Use a 24-item test scored from 0 to 100, covering environmental analysis, industry and competitor analysis, internal resource analysis, strategic choice, implementation planning, and strategic evaluation. The blueprint, item-development rules, review form, and scoring rules are provided in Supplementary File 1.
- Develop Form A and Form B as equivalent but non-identical versions matched by topic coverage, item format, cognitive level, score range, expected difficulty, and scoring rules. Have two Strategic Management instructors and one business education assessment reviewer evaluate item relevance, clarity, cognitive level, and topic coverage. Pilot both forms with 24 students outside the analytic sample.
- Retain items with difficulty values of 0.30–0.80 and item discrimination values above 0.20 when feasible. Treat internal consistency as acceptable when KR-20 or Cronbach’s alpha is ≥0.70. Treat the forms as acceptable for paired use when the pilot mean difference is ≤3 points and the standardized difference is <0.20.
- Counterbalance forms when feasible. Assign half of the students to Form A at baseline and Form B post-course, and the other half to Form B at baseline and Form A post-course. If one fixed order is used, record it as a limitation.
- Administer the baseline engagement survey after the knowledge test. Use 5-point items to record interest in Strategic Management, perceived practical relevance, case-analysis confidence, willingness to participate in team tasks, teamwork readiness, and prior competition experience. Analyze conceptually different items separately unless reliability and dimensional evidence support a composite score.
- Record baseline attendance, knowledge-test completion, survey completion, and form version during routine course delivery. Export baseline data for research use only after ethics approval, consent verification, code assignment, and removal of direct identifiers.
7. Deliver enterprise case-based Strategic Management instruction.
- Deliver case-based instruction through short lectures, guided discussion, team worksheets, and brief decision exercises. Use active learning tasks to move students from concept reception to analysis, decision making, team discussion, and reflection15.
- Invite enterprise managers, entrepreneurs, or industry mentors when available. Provide course objectives, student level, case topic, confidentiality requirements, discussion focus, and time commitment at least 7 days before the session. Use an anonymized or public case briefing when a live mentor is unavailable.
- Present one non-confidential strategic problem involving market uncertainty, competitive pressure, business model adjustment, resource constraints, implementation barriers, or risk control. Require each team to identify the problem, evidence base, alternatives, risks, and recommended decision using a structured worksheet.
- Require each team to submit a 300–500 word reflection linking the case problem with one Strategic Management concept and one active competition decision. Record mentor background, case source, attendance, student questions, worksheet completion, and reflection submission in the enterprise engagement log. Link case exposure, reflection, decision making, and revision across the competition cycle through experiential learning activities16.
8. Implement the three-stage teaching competition.
- Conduct the formal competition briefing in Week 4. Explain the task sequence, timeline, rubrics, feedback rules, academic integrity requirements, AI disclosure, oral-check procedure, and appeal procedure.
- Implement Task 1 in Weeks 5–6 as a 1,500–2,000-word strategic diagnosis report covering industry analysis, competitor analysis, internal resource analysis, strategic issue diagnosis, evidence use, and initial recommendation. Return feedback within 7 calendar days and use the revised strategic issue statement as the starting point for Task 2.
- Implement Task 2 in Weeks 8–10 as a strategic decision simulation or structured decision sheet covering market positioning, resource allocation, pricing or cost logic, implementation sequence, risk assumptions, and expected outcome.
- Implement Task 3 in Weeks 12–15 as a final strategy defense. Require an 8–12-slide deck, a 1,000–1,500-word executive summary, an 8 min presentation, and 5 min of questions. Confirm that the defense connects Task 1 diagnosis, Task 2 decision logic, implementation plan, risk control, and expected outcome.
- Score all three tasks using 100 point rubrics and apply the structure and scoring dimensions in Table 3.
PAUSE POINT: Pause after Task 1 scoring when more than 15% of submissions fail to follow the required structure or when raters identify unclear descriptors. Revise task instructions or rater guidance before Task 2.
| Task | Weeks | Required Output | Main Content | Score | Scoring Dimensions |
| Task 1: Strategic diagnosis report | Weeks 5–6 | 1,500–2,000-word team report | Industry analysis, competitor analysis, internal resource analysis, strategic issue diagnosis, evidence use, initial recommendation | 100 | Industry and market analysis, 20 |
| internal resource analysis, 20 | |||||
| strategic issue diagnosis, 20 | |||||
| evidence use, 20 | |||||
| written logic and clarity, 20 | |||||
| Task 2: Strategic decision simulation or decision sheet | Weeks 8–10 | Structured team decision sheet | Market positioning, resource allocation, pricing or cost logic, implementation sequence, risk assumptions, expected outcome | 100 | Strategic coherence, 25 |
| market logic, 20 | |||||
| operational feasibility, 20 | |||||
| risk analysis, 20 | |||||
| decision justification, 15 | |||||
| Task 3: Final strategy defense | Weeks 12–15 | 8–12-slide deck, 1,000–1,500-word executive summary, 8-min presentation, 5-min Q&A | Strategic diagnosis, strategic choice, implementation plan, risk control, expected performance | 100 | Strategic diagnosis, 20 |
| strategic choice, 25 | |||||
| implementation feasibility, 20 | |||||
| innovation, 15 | |||||
| evidence use, 10 | |||||
| oral defense, 10 |
Table 3: Three-stage teaching competition structure and scoring dimensions. This table defines the three competition tasks, implementation weeks, required outputs, main content requirements, total score, and scoring dimensions.
9. Standardize scoring and train raters.
- Recruit at least two raters for subjective scoring when staffing allows; document single-rater scoring when a second rater is unavailable.
- Train raters with rubrics, descriptors, calibration submissions, common scoring errors, AI disclosure rules, and oral-check criteria. Raters independently score two calibration submissions and discuss score differences greater than 10 points.
- Freeze the rubric after training and use the same version throughout the implementation cycle. Calculate ICC when two or more raters score the same submission. Treat ICC ≥ 0.75 as acceptable and reconcile scores when ICC is <0.75 or score gaps exceed 10 points. Preserve raw scores, reconciled scores, and reconciliation notes.
- Use rubric-based scoring to clarify expectations and support formative assessment17. Follow the rater training, scoring agreement, and reconciliation procedure in Supplementary Table S1.
10. Collect instructional quality and implementation fidelity data.
- Measure instructional quality through classroom interaction, case-design completeness, feedback timeliness, task-rubric alignment, and student engagement. Analyze indicators separately unless reliability and dimensional evidence support aggregation.
- Use “case-design completeness” rather than “case authenticity” unless independent authenticity validation is available.
- Measure implementation fidelity through planned activity completion, enterprise or case-session completion, task submission, feedback turnaround, rubric completion, observation completion, and rater-training completion.
- Treat Table 4 thresholds as predefined operational quality-control rules, not externally validated cutoffs. The thresholds were set before research analysis based on pilot feasibility, teaching team consensus, and workload constraints.
- Use the indicators, data sources, thresholds, warning rules, and corrective actions in Table 4. Additional troubleshooting procedures are provided in Supplementary Table S2.
- Treat implementation as adequate when ≥85% of planned weekly activities are completed, ≥85% of protocol-cohort students complete all three tasks, ≥80% of feedback is returned within 7 calendar days, all major rubrics are completed, and required observations are available. Treat implementation as suboptimal when task completion is <75%, feedback exceeds 14 calendar days for >20% of submissions, ICC is <0.75, or >25% of planned observations are missing.
| Category | Indicator | Data source | Time point | Scale | Positive signal or threshold | Warning rule | Corrective action |
| Implementation fidelity | Planned activity completion | Course implementation log | Weeks 1–16 | % completed | ≥85% planned activities completed | <85% completed | Review missed sessions and revise schedule control |
| Implementation fidelity | Enterprise or structured case session | Enterprise engagement log | Week 11 | Implemented / not implemented | Planned session implemented or replaced by structured case coaching | Planned session missing without replacement | Use anonymized case session or structured case coaching |
| Implementation fidelity | Three-task sequence completion | Submission records | Weeks 6, 10, 15 | % students | ≥85% protocol-cohort students complete all three tasks | <75% complete all tasks | Simplify instructions and add progress checks |
| Implementation fidelity | Feedback timeliness | Feedback log | Weeks 7, 10, 15 | Calendar days | ≥80% feedback returned within 7 days | >20% feedback returned after 14 days | Shorten feedback form and distribute scoring workload |
| Implementation fidelity | Observation completion | Observation forms | Weeks 1–16 | % planned observations | ≥75% planned observations completed | >25% planned observations missing | Add observer backup and fixed observation schedule |
| Scoring quality | Rater agreement | Rater scores | Task 1 subset and Task 3 defense | ICC | ICC ≥0.75 | ICC <0.75 | Retrain raters, clarify descriptors, reconcile affected scores |
| Instructional quality | Classroom interaction | Observation checklist | Selected sessions | 1–5 score | Mean ≥3.50 or increase ≥0.30 | Mean <3.50 | Strengthen discussion prompts and facilitation |
| Instructional quality | Case-design completeness | Case checklist | Before Week 4 | 0–5 or 1–5 score | Mean ≥4.00 | Mean <3.50 | Revise case context, decision problem, constraints, and consequence |
| Instructional quality | Task-rubric alignment | Alignment checklist | Before Week 4 and post-course review | 0–5 or 1–5 score | Mean ≥4.00 | Mean <3.50 | Revise task-output-rubric-feedback alignment |
| Instructional quality | Student engagement | Attendance, participation, logs, survey items | Weeks 1–16 | Item-level or 1–5 score | Increase ≥0.30 points | Decrease >0.30 points | Reduce overload, clarify expectations, increase formative support |
| Learning outcome | Strategic Management knowledge | Baseline and post-course tests | Weeks 1 and 16 | 0–100 | Mean increase ≥5 points | Increase <3 points | Review teaching coverage, item alignment, and test equivalence |
| Learning outcome | Individual case analysis | Case-analysis rubric | Late semester | 0–100 | Protocol-cohort advantage ≥3 points | No advantage or decrease | Add case-analysis practice and annotated examples |
| Team outcome | Team competition performance | Competition rubrics | Weeks 6, 10, 15 | 0–100 | Progressive improvement across tasks | High final score with weak earlier evidence | Check score inflation and rebalance rubric toward reasoning |
| Student perception | Satisfaction | Post-course survey | Week 16 | 1–5 score | Mean ≥4.00 | Mean <3.50 | Review workload, task clarity, feedback quality, and team coordination |
| Student perception | Practical relevance | Post-course survey | Week 16 | 1–5 score | Mean ≥4.00 | Mean <3.50 | Increase case specificity and links to real strategic decisions |
| Workload safety | Competition pressure | Post-course survey | Week 16 | 1–5 score or % | High pressure ≤20% students | High pressure >20% students | Reduce task overlap and adjust deadline spacing |
| Interpretation warning | Ceiling effect | Baseline test and survey | Week 1 | 0–100 or 1–5 | Baseline knowledge ≤85 and satisfaction ≤4.50 | Knowledge >85 or satisfaction >4.50 | Interpret small improvement cautiously |
| Interpretation warning | Score inflation | Team and individual outcomes | End of semester | Pattern judgment | Team gains accompanied by individual learning evidence | Team scores improve but individual learning does not | Increase individual accountability and reasoning-based scoring |
| Team process | Peer contribution balance | Peer contribution form | Midpoint and final stage | 1–5 score | No repeated major imbalance | One or more members repeatedly rated very low | Require role reallocation and instructor check-in |
| Academic integrity | AI-use transparency | AI disclosure and oral check | Each major task | Disclosed / not disclosed | AI use disclosed according to institutional rules | Undisclosed or inappropriate AI use | Apply institutional academic integrity procedure and clarify AI rules |
Table 4: Implementation fidelity, instructional quality, outcome-interpretation, and troubleshooting indicators. This table specifies implementation fidelity indicators, instructional quality indicators, student-level and team-level outcome indicators, scoring-quality indicators, interpretation thresholds, warning rules, and corrective actions.
11. Collect postcourse outcome data.
- Administer the post-course Strategic Management knowledge test in Week 16 using the equivalent post-course form rather than the exact baseline form.
- Collect the late-semester individual case-analysis score using a rubric covering problem identification, evidence use, strategic logic, feasibility, and written clarity. Report it as a post-course performance indicator unless a true baseline case-analysis assessment was administered.
- Collect team scores from Tasks 1–3 and keep them separate from individual-level learning outcomes.
- Collect satisfaction, perceived practical relevance, feedback usefulness, team collaboration, competition pressure, workload, and perceived improvement through an anonymous post-course survey. Do not combine items into one score unless reliability and dimensional evidence support a composite.
- Collect final course scores only after grade submission. Export post-course records for research use only after ethics approval, consent verification, code assignment, and removal of direct identifiers and identifiable comments.
PAUSE POINT: Pause research analysis until final grades are submitted, ethics approval is obtained, consent verification is completed, the consent list is separated from the research dataset, and de-identification is confirmed.
12. Clean and merge the de-identified dataset.
- After ethics approval and consent verification, create de-identified student-level, team-level, and class-session datasets. Check duplicate records, impossible values, missing codes, inconsistent team codes, and direct identifiers.
- Merge student- and team-level data by team code only. Clean and code all datasets using the template in Supplementary File 1 and the variable dictionary in Supplementary Table S3.
- Code missing values as NA. Do not replace missing outcomes unless the course policy defines a make-up assessment or zero score for a specific requirement. Exclude students missing either the knowledge test from paired knowledge analysis only, and exclude students missing all three competition tasks from competition-related analyses. Retain available records for other eligible analyses.
- Save the cleaned dataset, data dictionary, cleaning log, analysis-ready file, and locked output file. Modify locked data only with a dated correction log.
13. Analyze implementation fidelity, instructional quality, and learning outcomes.
- Analyze implementation fidelity before interpreting learning outcomes. Interpret outcome differences cautiously when fidelity thresholds are not met.
- Report descriptive statistics for continuous variables and frequencies for categorical variables, including cohort type, major group, prior competition experience, task completion, missing-data category, and protocol-cohort award level. Report the award level only for the protocol cohort unless the comparison cohort used the same award structure.
- Compare baseline characteristics using independent-samples t-tests, chi-square tests, or Fisher’s exact tests, as appropriate, to describe baseline comparability rather than causal equivalence.
- Compare within-cohort knowledge change using paired-samples t-tests or Wilcoxon signed-rank tests. Compare post-course outcomes between cohorts using independent-samples t-tests, Mann-Whitney U tests, ANCOVA, or regression models adjusted for baseline differences. Interpret all cohort comparisons as context-specific educational-record analyses, not causal estimates.
- Use repeated-measures or mixed-effects models when multiple time points are analyzed. Include student-level random effects for repeated measurements and team-level random effects or cluster-robust standard errors when students are nested within teams.
- Analyze team-level outcomes separately from student-level outcomes. Do not treat team scores as independent individual observations unless clustering is addressed.
- Report Cohen’s d for major mean differences, with 0.20, 0.50, and 0.80 interpreted as small, moderate, and large. Report 95% confidence intervals when possible and compare complete-case with available-case results in sensitivity analyses.
- Save the statistical script, software output, figure source files, and final tables. Submit all tables as separate editable files and archive the figure source data.
14. Interpret successful and suboptimal implementation.
- Define implementation success before interpreting final outcomes. Treat the protocol as successfully implemented when the core fidelity thresholds in Table 4 are met.
- Interpret learning outcomes only after checking fidelity, scoring reliability, missing-data patterns, baseline comparability, and unit of analysis.
- Treat a post-course knowledge increase of ≥5 points, a late-semester individual case-analysis advantage of ≥3 points, or an instructional process-indicator increase of ≥0.30 on a 5 point scale as a positive implementation signal when fidelity is adequate.
- Define warning patterns before analysis: ceiling effect when baseline knowledge exceeds 85/100 or baseline satisfaction exceeds 4.50/5; score inflation when team scores improve without individual learning evidence; excessive competition pressure when satisfaction decreases by >0.30 points or >20% of students report high workload pressure.
- Interpret evaluation as a layered process from implementation fidelity to student reaction, learning evidence, and course refinement, not as a single score18. Avoid causal wording because the design uses routine educational cohorts, a historical comparison group, and retrospective de-identified course records rather than randomized assignment.
15. Conduct troubleshooting, adaptation, and course iteration.
- Review fidelity after each major task and identify delayed feedback, low team participation, unclear instructions, incomplete scoring forms, missing observations, weak case-design completeness, rater disagreement, or inappropriate AI use.
- Apply the corrective actions in Supplementary Table S2, including instruction revision, additional coaching, rater retraining, role reallocation, workload adjustment, or institutional academic integrity review.
- For shorter terms, combine Tasks 1 and 2 into a diagnosis-decision brief while preserving the final defense, feedback record, and fidelity checks. For online, hybrid, or large multi-section delivery, use digital briefings, submission logs, online oral checks, standardized feedback templates, common rubrics, shared rater training, section-level observers, team dashboards, and central data management.
- After Week 16, review fidelity, process indicators, student outcomes, rater notes, missing-data patterns, AI-use records, student comments, and instructor reflections. Revise the handbook, case package, rubrics, templates, feedback schedule, and data-recording forms before the next cycle.
- After ethics approval and research data preparation, archive the protocol map, schedule, handbook, case files, rubrics, observation forms, survey instruments, de-identified dataset, data dictionary, analysis script, statistical output, figure source files, tables, and supplementary materials. Record all revisions in the version-control table.
Access restricted. Please log in or start a trial to view this content.
Results
The representative results show the outputs generated by the 16 week competition-integrated Strategic Management course improvement protocol. Results are organized by implementation fidelity, instructional quality, student-level outcomes, team-level outcomes, and predefined warning patterns. Because the data came from routine educational cohorts with a historical comparison group rather than randomized assignment, all results should be interpreted as context-specific implementation and evaluation outputs, not causal evid...
Access restricted. Please log in or start a trial to view this content.
Discussion
This protocol provides a reproducible approach for embedding a teaching-competition sequence into an undergraduate Strategic Management course. Its purpose is not to add a competition event to an existing course, but to convert competition into a structured course-improvement process that links strategic diagnosis, decision making, formative feedback, final defense, and post-course evaluation. The instructional value, therefore, depends on the design of the sequence rather than on the presence of competition alone. Compe...
Access restricted. Please log in or start a trial to view this content.
Disclosures
The authors have no conflicts of interest to declare.
Acknowledgements
The authors thank the students and teaching staff who participated in and supported the implementation of the course-based competition activities. The authors also acknowledge the Business School of Zhuhai College of Science and Technology for providing non-financial institutional support for routine instructional implementation, course coordination, and data organization. This study was supported by the 2024 Guangdong Provincial Undergraduate University Teaching Quality and Teaching Reform Project of Higher Education Teaching Reform (Grant No. 1174).
Access restricted. Please log in or start a trial to view this content.
Materials
| Name | Company | Catalog Number | Comments |
|---|---|---|---|
| AI-use disclosure form | Author-developed | AI-Disclosure-v1.0; Supplementary File 1 | Records disclosed AI use for each major submission |
| Baseline Strategic Management knowledge test | Author-developed | SMKT-Pre-v1.0; Supplementary File 1 | Measures Week 1 baseline knowledge |
| Classroom observation checklist | Author-developed | Observation-v1.0; Supplementary File 1 | Records classroom interaction and instructional process quality |
| Cleaning log | Author-developed | Cleaning-Log-v1.0; Supplementary File 1 | Records data checks, corrections, exclusions, and dataset lock |
| Competition handbook | Author-developed | Handbook-v1.0; Supplementary File 1 | Defines task sequence, submission rules, rubrics, AI disclosure, oral checks, appeals, and deadlines |
| Data dictionary | Author-developed | Data-Dictionary-v1.0; Supplementary Table 2 | Defines variables, coding ranges, data sources, and missing-data rules |
| De-identified dataset workbook | Author-developed | Dataset-Workbook-v1.0; Supplementary File 1 | Stores student-level, team-level, and class-session-level variables |
| Enterprise or anonymized case package | Author-developed or enterprise-approved | CasePack-v1.0; Supplementary File 1 | Provides the strategic decision context |
| Final defense slide template | Author-developed | FSD-Template-v1.0; Supplementary File 1 | Guides Task 3 slide deck structure |
| Final strategy defense scoring form | Author-developed | FSDSF-v1.0; Supplementary File 1 | Records Task 3 rater scores and Q&A assessment |
| IBM SPSS Statistics | IBM | Version 27.0; institutional or personal license | Descriptive statistics, group comparisons, effect sizes, and ICC analysis |
| Individual case-analysis task sheet | Author-developed | ICATS-v1.0; Supplementary File 1 | Defines individual case-analysis requirements and scoring domains |
| Knowledge-test answer key | Author-developed | SMKT-Key-v1.0; Supplementary File 1 | Supports knowledge-test scoring |
| Microsoft Excel | Microsoft | Excel 2021; institutional or personal license | Data entry, data dictionary, cleaning log, table preparation, and source-data checks |
| Oral-check record form | Author-developed | Oral-Check-v1.0; Supplementary File 1 | Records individual oral-check questions and responses |
| Peer contribution form | Author-developed | PCF-v1.0; Supplementary File 1 | Records peer contribution and contribution imbalance |
| Post-course learning survey | Author-developed | PCLS-v1.0; Supplementary File 1 | Measures satisfaction, relevance, feedback usefulness, collaboration, workload, and perceived improvement |
| Post-course Strategic Management knowledge test | Author-developed | SMKT-Post-v1.0; Supplementary File 1 | Measures Week 16 post-course knowledge using an equivalent form |
| Rater training file | Author-developed | Rater-Training-v1.0; Supplementary File 1 | Provides calibration files, descriptors, examples, and common scoring errors |
| Statistical output file | Software-generated | Statistical-Output-v1.0; archived with locked analysis folder | Stores statistical outputs with the analysis file and dataset version |
| Strategic decision sheet | Author-developed | SDS-v1.0; Supplementary File 1 | Guides Task 2 decision output |
| Strategic diagnosis report template | Author-developed | SDR-Template-v1.0; Supplementary File 1 | Guides Task 1 report structure |
| Student code linkage file | Author-developed restricted file | Student-Code-Linkage-v1.0; stored separately by data manager | Links student identity and research code before de-identification |
| Task-rubric alignment checklist | Author-developed | Alignment-v1.0; Supplementary File 1 | Checks alignment among learning outcomes, task outputs, scoring criteria, and feedback points |
| Team charter template | Author-developed | Team-Charter-v1.0; Supplementary File 1 | Records role allocation, communication rules, deadlines, and contribution expectations |
| Team process log | Author-developed | Team-Process-Log-v1.0; Supplementary File 1 | Records meeting attendance, decisions, progress, problems, and next actions |
| Version-control table | Author-developed | Version-Control-v1.0; Supplementary File 1 | Tracks version number, date, editor, reason, and approval status |
| Wenjuanxing online survey platform | Wenjuanxing | Web-based platform; institutional or user account access | Baseline survey, post-course survey, peer contribution form, and AI-disclosure exports |
References
- Porter ME. Competitive strategy: techniques for analyzing industries and competitors. Free Press; New York; 1980.
- Barney J. Firm resources and sustained competitive advantage. J Manage. 1991;17(1):99-120.
- Keys JB, Wolfe J. The role of management games and simulations in education and research. J Manage. 1990;16(2):307-36.
- Crookall D. Serious games, debriefing, and simulation/gaming as a discipline. Simul Gaming. 2010;41(6):898-920.
- Prince M. Does active learning work? A review of the research. J Eng Educ. 2004;93(3):223-31.
- Morris TH. Experiential learning: a systematic review and revision of Kolb’s model. Interact Learn Environ. 2020;28(8):1064-77.
- Greco M, Baldissin N, Nonino F. An exploratory taxonomy of business games. Simul Gaming. 2013;44(5):645-82.
- Vlachopoulos D, Makri A. The effect of games and simulations on higher education: a systematic literature review. Int J Educ Technol High Educ. 2017;14:22.
- Johnson DW, Johnson RT, Smith KA. Cooperative learning returns to college: what evidence is there that it works? Change. 1998;30(4):26-35.
- Martell K. Assessing student learning: are business schools making the grade? J Educ Bus. 2007;82(4):189-95.
- Hamari J, Koivisto J, Sarsa H. Does gamification work? A literature review of empirical studies on gamification. In: Proceedings of the 47th Hawaii International Conference on System Sciences. IEEE; 2014. p. 3025-34.
- Buckley P, Doyle E. Gamification and student motivation. Interact Learn Environ. 2016;24(6):1162-75.
- Biggs J, Tang C. Teaching for quality learning at university: what the student does. 4th ed. Open University Press; Maidenhead; 2011.
- Hattie J, Timperley H. The power of feedback. Rev Educ Res. 2007;77(1):81-112.
- Freeman S, et al. Active learning increases student performance in science, engineering, and mathematics. Proc Natl Acad Sci U S A. 2014;111(23):8410-5.
- Kolb DA. Experiential learning: experience as the source of learning and development. 2nd ed. Pearson FT Press; Upper Saddle River; 2014.
- Panadero E, Jonsson A. The use of scoring rubrics for formative assessment purposes revisited: a review. Educ Res Rev. 2013;9:129-44.
- Frye AW, Hemmer PA. Program evaluation models and related theories: AMEE Guide No. 67. Med Teach. 2012;34(5):e288-99.
- Garris R, Ahlers R, Driskell JE. Games, motivation, and learning: a research and practice model. Simul Gaming. 2002;33(4):441-67.
- Sitzmann T. A meta-analytic examination of the instructional effectiveness of computer-based simulation games. Pers Psychol. 2011;64(2):489-528.
- Shute VJ. Focus on formative feedback. Rev Educ Res. 2008;78(1):153-89.
- Jonsson A, Svingby G. The use of scoring rubrics: reliability, validity, and educational consequences. Educ Res Rev. 2007;2(2):130-44.
- O’Donnell CL. Defining, conceptualizing, and measuring fidelity of implementation and its relationship to outcomes in K-12 curriculum intervention research. Rev Educ Res. 2008;78(1):33-84.
- Marsden E, Torgerson CJ. Single group, pre- and post-test research designs: some methodological concerns. Oxf Rev Educ. 2012;38(5):583-616.
- Gosen J, Washbush J. A review of scholarship on assessing experiential learning effectiveness. Simul Gaming. 2004;35(2):270-93.
Access restricted. Please log in or start a trial to view this content.