This single-center retrospective study developed and internally validated a logistic regression model for delayed cerebral ischemia after aneurysmal subarachnoid hemorrhage. In 680 patients, six early clinical, laboratory, and imaging variables showed preliminary predictive value. Further external validation is required before clinical use.
Research Article
Internal Validation of a Clinical Prediction Model for Delayed Cerebral Ischemia After Aneurysmal Subarachnoid Hemorrhage
In This Article
Summary
Abstract
Delayed cerebral ischemia (DCI) is an important cause of secondary neurological injury after aneurysmal subarachnoid hemorrhage (aSAH). This retrospective single-center study developed and evaluated prediction models for DCI using data from 680 adult patients with aSAH treated between July 2022 and December 2024. Patients were divided using an outcome-stratified 8:2 split into a training cohort of 544 patients and a hold-out internal-validation cohort of 136 patients. DCI occurred in 175 patients in the training cohort and 42 patients in the internal-validation cohort. Predictor selection was performed in the training cohort using least absolute shrinkage and selection operator regression with 10-fold cross-validation. Six variables were retained: age, cerebral edema, hypoalbuminemia, modified Fisher grade, Hunt-Hess grade, and World Federation of Neurological Surgeons grade. Logistic regression, extreme gradient boosting, light gradient boosting machine, support vector machine, and k-nearest neighbor models were compared. Logistic regression showed an area under the receiver operating characteristic curve of 0.832 (95% confidence interval, 0.758–0.906) in the internal-validation cohort. Its calibration slope, calibration intercept, and Brier score were 0.98, 0.02, and 0.168, respectively, although confidence intervals for these calibration estimates were unavailable. The findings represent preliminary performance in a single hold-out internal-validation cohort. Incomplete reproducibility records, the absence of the model intercept, the lack of resampling-based optimism correction, and the absence of external validation currently prevent patient-level probability calculation and clinical implementation.
Introduction
Several prediction models for DCI after aSAH have been proposed, but many have been limited by small sample sizes, incomplete calibration assessment, insufficient reporting of model development procedures, and a lack of external validation. Many studies have focused mainly on discrimination, while calibration, reproducibility, and clinical-impact assessment have been reported less consistently. Therefore, model performance should be evaluated using transparent methods and interpreted cautiously when validation is limited to a single center.
The present study aimed to develop and internally evaluate prediction models for DCI using routinely available early clinical, laboratory, and imaging variables. Five modeling approaches were compared using the same set of selected predictors. The intended prediction time point was after the initial admission, laboratory, and imaging assessment but before the main DCI risk period. The models were developed for research-based risk estimation and were not intended to diagnose DCI, replace clinical judgment, or independently determine treatment. External validation, recalibration, and clinical-impact testing are required before clinical use.
Delayed cerebral ischemia (DCI) is one of these secondary insults that has been among the most clinically significant and potentially preventable conditions following aSAH. DCI is a complication that usually arises several days following the ictus, typically within 3–14 days, and is linked with new focal neurological impairment, worsening of the level of consciousness, and/or onset of cerebral infarction on subsequent neuroimaging. Although there are some differences in diagnostic practice found in different institutions, DCI is always associated with a long stay in the intensive care unit, high resource consumption, and poor neurological prognosis. The reported DCI incidence is typically 30–40 percent, underscoring its prevalence and significant prognostic implications1,2,3,4,5,6. Notably, DCI is not a single-pathway process. Although the focus has always been on large-vessel cerebral vasospasm, accumulating evidence also shows that early brain injury, cortical spreading depolarization, neuroinflammation, microthrombosis, endothelial dysfunction, impaired autoregulation, and microcirculatory failure are all contributors to ischemic risk. This multifactorial pathophysiology helps explain why vasospasm-targeted treatments may not fully prevent DCI-associated infarction and why high-risk patients are difficult to identify in the usual clinical setting.
The risk stratification of DCI following aSAH is a priority because, with prompt identification of high-risk patients, it may be possible to monitor them more closely and escalate preventive or rescue measures promptly7. Monitoring plans in clinical practice can involve the use of more frequent neurological tests, transcranial Doppler ultrasonography, sophisticated imaging techniques, such as computed tomography perfusion, hemodynamic and intravascular volume optimization, strict compliance with nimodipine therapy, and early identification of neurological deterioration, such as hydrocephalus, rebleeding, seizures, infection, or metabolic imbalance. Nevertheless, global severity scales and clinicians' experience tend to influence clinical decisions rather than the personalized, data-driven DCI probability estimates8,9,10. One reason is that the literature indicates that risk factors are heterogeneous, and the interplay among patient factors, hemorrhage burden, physiological derangements, and neurological grading scales may be nonlinear and complex. Previous researchers have investigated potential predictors of DCI, including age, hypertension, baseline neurological status, aneurysm characteristics, laboratory indices (such as serum sodium and albumin), imaging features indicative of hemorrhage load, and perioperative or treatment-related factors. Conventional regression techniques have been helpful, but may be constrained when the predictors are correlated, when the relationship between the predictors and the risk is nonlinear, or when there are interactions among the variables11. Simultaneously, multiple instruments (most commonly nomograms) have been proposed to assess DCI risk. Even though nomograms are feasible and visually appealing, most of them are based on small samples, include few variables, and may be overfit or poorly validated. In addition, models developed and tested at one center might not be readily translatable to other facilities due to differences in patient mix, image interpretation, treatment, and DCI diagnostic thresholds.
Machine-learning methods may complement traditional clinical prediction models, as they allow exploration of more dimensions of clinical data and observation of more intricate trends without the need to make rigid linear assumptions. ML-based prediction models have found increasing applications in the field of cerebrovascular disease in recent years, including the prediction of outcomes and complications, as well as decision support12,13,14. Commonly applied machine learning algorithms include ensemble tree methods such as Extreme Gradient Boosting (XGBoost) and Light Gradient Boosting Machine (LightGBM), kernel-based classifiers such as support vector machines (SVMs), and distance-based classifiers such as k-nearest neighbors (KNN). The models are, in principle, capable of modeling nonlinearities and interactions more than traditional approaches do15. However, there are also practical concerns associated with ML models, such as the risk of overfitting, reduced interpretability, and the need to handle preprocessing, tuning, calibration, evaluation, and validation. It is worth noting that in a wide range of clinical scenarios, well-specified logistic regression can perform as well as, or even more effectively than, more complex algorithms, especially when the number of predictors is small and the signal-to-noise ratio is moderate. Thus, a comparative analysis of various algorithms using similar predictors and evaluation metrics is needed to identify a model that correlates with performance and clinical applicability16,17,18.
Several prediction models for delayed cerebral ischemia have been previously proposed; however, many suffer from important limitations, including small sample sizes, limited calibration assessment, lack of head-to-head algorithm comparison, and insufficient validation. Furthermore, prior studies frequently emphasize discrimination while underreporting calibration and clinical utility metrics, which are essential for real-world applicability. The present study addresses these gaps by developing a predictive model in a comparatively large cohort, implementing systematic predictor selection using the least absolute shrinkage and selection operator (LASSO) regression, comparing multiple machine learning algorithms within a unified modeling framework, and comprehensively evaluating discrimination, calibration, and decision-analytic performance.
Several prediction models for DCI after aSAH have been proposed, but many have important limitations, including small cohorts, limited calibration assessment, incomplete reporting of model development, and lack of external or temporal validation. In addition, many studies report only discrimination, while calibration and decision-curve analysis are presented less consistently. The present study does not solve the problem of external validation. Instead, it provides a single-center development and internal validation study using routinely available clinical, laboratory, and imaging variables. The intended use case is early risk stratification after admission and initial aneurysm treatment, before the main DCI risk window. The model may help clinicians identify patients who need closer neurological monitoring, vascular imaging surveillance, correction of physiological abnormalities, and early review by the neurocritical care team. It is not intended to replace clinical judgment, diagnose DCI, or guide treatment without external validation and clinical impact testing. Previous studies have proposed several models for predicting DCI after aSAH, but many have been limited by small sample sizes, incomplete reporting of calibration, limited comparisons between modeling methods, or a lack of external validation. The present study does not claim to provide a clinically validated decision tool. Instead, it aims to develop and internally validate a prediction model using routinely available early clinical, laboratory, and imaging variables from a single-center cohort. The intended use case is early risk stratification after admission and initial aneurysm treatment, before the main DCI risk period. In this setting, a high predicted risk would support closer neurological assessment, vascular monitoring, correction of physiological abnormalities, and early review by neurocritical care. The model is not intended to diagnose DCI or replace clinician judgment.
Protocol
The study was approved by the Institutional Ethics Committee of Yulin First Hospital, Shaanxi Province, China. Because this was a retrospective analysis of routinely collected hospital data, and because all data were anonymized before analysis, the requirement for written informed consent was waived. The study was conducted in accordance with institutional data-protection requirements and the principles of the Declaration of Helsinki.
Data and Methods
Study Population and Design
This was a retrospective single-center cohort study conducted at Yulin First Hospital, Shaanxi Province, China. The hospital records of patients admitted with aSAH between July 2022 and December 2024 were screened. Eligible patients were adults aged 18 years or older with a diagnosis of aSAH confirmed by cranial and intracranial vascular imaging. Patients were required to have been admitted within 72 h after symptom onset and to have undergone aneurysm treatment during the index hospitalization.
Patients were excluded if they had traumatic subarachnoid hemorrhage, non-aneurysmal subarachnoid hemorrhage, severe pre-existing hematological disease, other major intracranial disease affecting outcome assessment, insufficient records for DCI evaluation, or in-hospital death before an adequate DCI assessment period. Excluding early in-hospital deaths may introduce survivorship bias because the most severe cases may be removed from analysis. Therefore, the findings should be interpreted as applying mainly to patients who survived long enough for DCI evaluation.
Data Collection
Clinical, laboratory, imaging, and treatment-related variables were extracted from the electronic medical record using a predefined data-extraction form. The extracted variables included demographic factors, medical history, aneurysm features, early neurological grade, early imaging findings, laboratory results, treatment approach, and hospital complications. The intended prediction time point was after completion of the initial admission and perioperative assessment, but before the main DCI risk window.
Age, sex, body mass index, smoking status, alcohol use, hypertension, diabetes, aneurysm size, aneurysm location, modified Fisher grade, Hunt-Hess grade, World Federation of Neurological Surgeons grade, intraventricular hemorrhage, and rebleeding were taken from admission records and initial imaging. Laboratory variables, including hemoglobin, serum albumin, and serum sodium, were obtained from the earliest available blood test prior to the prediction time point. Cerebral edema was assessed using baseline or immediate post-treatment imaging available before DCI diagnosis. Variables recorded only after DCI onset were not used for model development to reduce information leakage.
Anemia was defined as hemoglobin <110 g/L in female patients and <120 g/L in male patients. Hypoalbuminemia was defined as serum albumin <35 g/L. Hyponatremia was defined as serum sodium <130 mmol/L.
Patients were managed according to the institutional aSAH care pathway. Standard management included early aneurysm securing, neurological observation, blood pressure control, fluid and electrolyte management, and surveillance for complications including hydrocephalus, rebleeding, seizure, infection, vasospasm, and DCI. Nimodipine was used unless contraindicated. Vasospasm monitoring was performed using neurological examination, vascular imaging, and transcranial Doppler ultrasonography when clinically indicated. Hydrocephalus was managed with cerebrospinal fluid diversion when required. Hemodynamic optimization and rescue therapy were applied according to the treating team’s assessment. Because treatment intensity and rescue-therapy details were not completely captured in the retrospective dataset, these factors could not be fully adjusted in the model and were considered a limitation.
Diagnosis of DCI
DCI was defined as a new focal neurological impairment, a decrease in level of consciousness, or a new cerebral infarction on follow-up computed tomography or magnetic resonance imaging occurring during the expected DCI risk window and not explained by another cause. The DCI risk window was defined as days 3–14 after the hemorrhage ictus. Alternative explanations, including rebleeding, hydrocephalus, seizure, infection, metabolic disturbance, sedative effect, and procedure-related infarction, were reviewed before classifying an event as DCI.
Outcome adjudication was performed by two clinicians with experience in the management of aSAH, including one neurosurgeon and one neurologist/neurocritical care physician. The adjudicators reviewed clinical notes, neurological examinations, imaging reports, and follow-up imaging. They were blinded to the final model output during outcome assessment. Disagreements were resolved through consensus discussion with review of the relevant imaging and clinical timeline. Formal inter-rater agreement was not measured, and this limitation was added because DCI classification may involve clinical judgment.
Sample Size Calculation
The sample size was estimated using the 10-events-per-variable (EPV) rule of thumb11. With 20 candidate predictor variables and an expected DCI incidence of approximately 35%, a minimum sample size of 20 × 10 / 0.35 ≈ 572 patients was required. Our final cohort of 680 patients exceeded this requirement. Although the events-per-variable (EPV) rule was applied as a general guideline, modern predictive modeling, particularly machine learning algorithms, may require more flexible sample-size considerations. The final cohort size was considered adequate to ensure model stability, minimize the risk of overfitting, and enable reliable estimation of model performance metrics.
Model development and validation
Patients were allocated to a training cohort of 544 patients and a hold-out internal validation cohort of 136 patients using an outcome-stratified 8:2 split. Outcome stratification was used to maintain a similar proportion of DCI events in the two cohorts. DCI occurred in 175 of 544 patients in the training cohort and 42 of 136 patients in the internal-validation cohort. The 8:2 hold-out design was retained because it was the prespecified model-development strategy and provided a separate cohort for preliminary internal performance assessment.
Predictor selection was performed only in the training cohort using least absolute shrinkage and selection operator regression with 10-fold cross-validation. The selected penalty parameter was λ = 0.031. Six predictors were retained: age, cerebral edema, hypoalbuminemia, modified Fisher grade, Hunt-Hess grade, and World Federation of Neurological Surgeons grade.
Logistic regression, extreme gradient boosting, light gradient boosting machine, support vector machine, and k-nearest neighbor models were developed using the same set of selected predictors. All preprocessing, predictor selection, and model-development procedures were restricted to the training cohort. The internal-validation cohort was not used during predictor selection or model tuning and was evaluated only after model development.
The numerical random seed used for the original cohort allocation was not retained in the archived analysis records and could not be retrospectively verified. Bootstrap optimism correction and repeated k-fold internal validation were also not available. Therefore, the present analysis is described as a single hold-out internal validation rather than an optimism-corrected or repeated cross-validated performance assessment.
Machine-learning reproducibility
LASSO predictor selection used 10-fold cross-validation within the training cohort. Continuous predictors were standardized when required by the modeling algorithm, and categorical predictors were represented using predefined binary clinical categories. The validation cohort was not used for tuning or model selection.
The archived analysis materials did not retain the final tuning grids, selected hyperparameters, complete package versions, original random seed, or a confirmed class-imbalance procedure for XGBoost, LightGBM, SVM, and KNN. These settings were therefore not reconstructed or estimated. The machine-learning comparisons should consequently be interpreted as exploratory comparisons of algorithms rather than fully reproducible model-development experiments. Reproducibility information, both available and unavailable, should be summarized in Supplementary Table 1.
Bias Control & Sensitivity Analysis
Consecutive eligible patients were included to reduce selection bias. Standardized variable definitions and a structured data-extraction form were used to reduce information bias. Predictors were restricted to information available before the intended DCI prediction time point to reduce information leakage. Predictor selection, preprocessing, and model development were performed only in the training cohort.
Modified Fisher grade, Hunt-Hess grade, and WFNS grade represent related aspects of hemorrhage burden and neurological severity. Although all three variables were retained after LASSO selection, the numerical variance inflation factor values and the results from a sensitivity model excluding overlapping severity scales were not included in the archived analysis output. These analyses could not be reconstructed from the aggregate tables because patient-level correlations and fitted model outputs are required. Therefore, the individual coefficients of these severity measures were not interpreted as independent or causal effects. They were retained only as components of the prediction model selected in the training cohort.
Model Interpretability
Clinical applicability was believed to require model interpretability as a crucial element. In the most effective model, the effects of predictors were considered to assess the clinical plausibility and conformity with existing pathophysiological knowledge of delayed cerebral ischemia. This method enabled a clear assessment of model behavior and improved the potential for clinical translation.
Missing Data
Variable-level missingness was assessed during data preparation. However, the original pre-imputation missing counts and percentages for each candidate variable were not retained in the archived analysis records and could not be accurately reconstructed from the aggregate tables. Consequently, no assumption of complete data was made, and no unverified missingness percentages were reported.
A verified supplementary missing-data table should be generated directly from the original deidentified patient-level dataset. Supplementary Table 2 should report, for every candidate variable, the number and percentage of missing observations before data handling, the method used to address missingness, and the number of observations included in the final analysis. The inability to recover the original variable-specific missingness pattern was considered a limitation of the present report.
Statistical Analysis
Predictor selection was performed in the training cohort using LASSO regression with 10-fold cross-validation. Discrimination was assessed using the area under the receiver operating characteristic curve with 95% confidence intervals. Calibration was described using calibration plots and point estimates of the calibration slope, calibration intercept, and Brier score. Bootstrap confidence intervals for calibration measures were not available.
Threshold-dependent classification measures were calculated from the available internal-validation confusion matrices. The exact numerical probability threshold used to generate the archived confusion matrices was not retained and could not be verified. Therefore, these measures were interpreted descriptively and were not used as the primary basis for model selection. Decision-curve analysis was also considered exploratory because the exact prespecified threshold range and patient-level net-benefit output were not retained. A two-sided P value below 0.05 was considered statistically significant.
Results
Comparison of baseline characteristics between training and internal-validation cohorts
A total of 680 patients with aSAH were included. The training cohort contained 544 patients, of whom 175 developed DCI, while the internal-validation cohort contained 136 patients, of whom 42 developed DCI. The DCI event rate was 32.2% in the training cohort and 30.9% in the internal-validation cohort. Baseline characteristics are presented in Table 1. Because some archived table entries contained denominator inconsistencies, the table should be verified against the original patient-level dataset before final submission.
| Variable | Training cohort (n = 544) | Internal validation cohort (n = 136) | t/χ²/Z | P value | SMD | Correction note |
| Age, years | 62.88 ± 9.41 | 63.25 ± 9.52 | 0.409 | 0.693 | 0.039 | |
| Sex | 0.429 | 0.512 | 0.063 | |||
| Male | 180 (33.09) | 41 (30.15) | ||||
| Female | 364 (66.91) | 95 (69.85) | ||||
| BMI, kg/m² | 23.46 ± 3.56 | 23.61 ± 3.65 | 0.437 | 0.662 | 0.042 | |
| Smoking history | 0.118 | 0.731 | 0.033 | |||
| Yes | 101 (18.57) | 27 (19.85) | ||||
| No | 443 (81.43) | 109 (80.15) | ||||
| Alcohol use | 0.417 | 0.518 | 0.062 | |||
| Yes | 118 (21.69) | 33 (24.26) | ||||
| No | 426 (78.31) | 103 (75.74) | ||||
| History of hypertension | 0.348 | 0.555 | 0.057 | |||
| Yes | 329 (60.48) | 86 (63.24) | ||||
| No | 215 (39.52) | 50 (36.76) | ||||
| History of diabetes | 0.116 | 0.733 | 0.033 | Validation 'No' count corrected to sum to 136. | ||
| Yes | 70 (12.87) | 19 (13.97) | ||||
| No | 474 (87.13) | 117 (86.03) | ||||
| Aneurysm diameter, mm | 0.213 | 0.645 | 0.044 | |||
| >10 | 288 (52.94) | 75 (55.15) | ||||
| ≤10 | 256 (47.06) | 61 (44.85) | ||||
| Aneurysm location | 0.980 | 0.322 | 0.095 | |||
| Anterior circulation | 448 (82.35) | 107 (78.68) | ||||
| Posterior circulation | 96 (17.65) | 29 (21.32) | ||||
| Cerebral edema | 0.612 | 0.434 | 0.075 | |||
| Yes | 125 (22.98) | 27 (19.85) | ||||
| No | 419 (77.02) | 109 (80.15) | ||||
| Low hemoglobin | 0.684 | 0.408 | 0.079 | Validation 'No' count corrected to sum to 136. Training count conflicts with Table 2; verify from final dataset. | ||
| Yes | 147 (27.02) | 32 (23.53) | ||||
| No | 397 (72.98) | 104 (76.47) | ||||
| Hypoalbuminemia | 0.367 | 0.545 | 0.058 | |||
| Yes | 115 (21.14) | 32 (23.53) | ||||
| No | 429 (78.86) | 104 (76.47) | ||||
| Hyponatremia | 0.186 | 0.666 | 0.041 | |||
| Yes | 331 (60.85) | 80 (58.82) | ||||
| No | 213 (39.15) | 56 (41.18) | ||||
| Modified Fisher grade | 0.249 | 0.618 | 0.048 | |||
| ≥III | 259 (47.61) | 68 (50.00) | ||||
| I–II | 285 (52.39) | 68 (50.00) | ||||
| Hunt-Hess grade | 0.178 | 0.673 | 0.040 | Validation ≥III count corrected from 53 to 63 to sum to 136; verify against final dataset. | ||
| ≥III | 263 (48.35) | 63 (46.32) | ||||
| I–II | 281 (51.65) | 73 (53.68) | ||||
| WFNS grade | 0.249 | 0.618 | 0.048 | |||
| ≥III | 277 (50.92) | 66 (48.53) | ||||
| I–II | 267 (49.08) | 70 (51.47) | ||||
| Surgical approach | 0.717 | 0.397 | 0.081 | |||
| Endovascular treatment | 449 (82.54) | 108 (79.41) | ||||
| Clipping | 95 (17.46) | 28 (20.59) | ||||
| Surgical time, h | 2.78 ± 0.81 | 2.81 ± 0.79 | 0.388 | 0.698 | 0.037 | |
| Intraventricular hemorrhage | 0.383 | 0.536 | 0.059 | |||
| Yes | 134 (24.63) | 37 (27.21) | ||||
| No | 410 (75.37) | 99 (72.79) | ||||
| Rebleeding | 0.784 | 0.376 | 0.085 | |||
| Yes | 98 (18.01) | 29 (21.32) | ||||
| No | 446 (81.99) | 107 (78.68) |
Table 1: Baseline characteristics of the training and internal validation cohorts. Continuous variables are presented as mean ± standard deviation, and categorical variables as n (%). P values and standardized mean differences compare the two cohorts. Abbreviations: BMI, body mass index; SMD, standardized mean difference. Please click here to download this Table.
Comparison of baseline characteristics between the non-DCI and DCI groups in the training set
Within the training dataset, delayed cerebral ischemia (DCI) occurred in 175 patients (32.17%), while 369 patients (67.83%) did not develop DCI. The incidence of DCI in the internal-validation cohort was comparable, indicating a stable prevalence of outcomes. Comparative analyses between the non-DCI and DCI groups revealed several statistically significant differences (Table 2). Patients who developed DCI were significantly older (P = 0.026), suggesting an age-associated susceptibility to secondary ischemic injury. Radiological evidence of early brain injury, particularly brain edema, was markedly more prevalent among DCI patients (P = 0.001). Laboratory abnormalities, including hypoalbuminemia (P = 0.007), hyponatremia (P = 0.048), and low hemoglobin levels (P < 0.001), were significantly associated with DCI occurrence. Neurological severity markers demonstrated the strongest associations. Elevated modified Fisher grade (≥III) was significantly more frequent among DCI patients (P < 0.001), indicating a robust relationship between hemorrhage burden and delayed ischemic complications. Similarly, higher Hunt–Hess grade and World Federation of Neurological Surgeons (WFNS) grade were strongly associated with DCI development (both P < 0.001). In contrast, demographic variables, lifestyle factors, aneurysm morphology, surgical approach, and surgical duration did not demonstrate statistically significant differences.
| Variable | Non-DCI group (n = 369) | DCI group (n = 175) | t/χ²/Z | P value | Correction note |
| Age, years | 62.25 ± 9.54 | 64.22 ± 9.75 | 2.234 | 0.026 | |
| Sex | 0.638 | 0.424 | |||
| Male | 118 (31.98) | 62 (35.43) | |||
| Female | 251 (68.02) | 113 (64.57) | |||
| BMI, kg/m² | 23.43 ± 3.56 | 23.52 ± 3.72 | 0.271 | 0.786 | |
| Smoking history | 0.351 | 0.554 | |||
| Yes | 66 (17.89) | 35 (20.00) | |||
| No | 303 (82.11) | 140 (80.00) | |||
| Alcohol use | 0.046 | 0.837 | |||
| Yes | 81 (21.95) | 37 (21.14) | |||
| No | 288 (78.05) | 138 (78.86) | |||
| History of hypertension | 2.960 | 0.085 | |||
| Yes | 214 (57.99) | 115 (65.71) | |||
| No | 155 (42.01) | 60 (34.29) | |||
| History of diabetes | 0.463 | 0.496 | |||
| Yes | 45 (12.20) | 25 (14.29) | |||
| No | 324 (87.80) | 150 (85.71) | |||
| Aneurysm diameter, mm | 0.380 | 0.538 | |||
| >10 | 192 (52.03) | 96 (54.86) | |||
| ≤10 | 177 (47.97) | 79 (45.14) | |||
| Aneurysm location | 3.602 | 0.058 | |||
| Anterior circulation | 296 (80.22) | 152 (86.86) | |||
| Posterior circulation | 73 (19.78) | 23 (13.14) | |||
| Cerebral edema | 10.410 | 0.001 | |||
| Yes | 70 (18.97) | 55 (31.43) | |||
| No | 299 (81.03) | 120 (68.57) | |||
| Low hemoglobin | 23.965 | <0.001 | Total differs from Table 1; verify against final dataset. | ||
| Yes | 122 (33.06) | 82 (46.86) | |||
| No | 247 (66.94) | 93 (53.14) | |||
| Hypoalbuminemia | 7.283 | 0.007 | |||
| Yes | 66 (17.89) | 49 (28.00) | |||
| No | 303 (82.11) | 126 (72.00) | |||
| Hyponatremia | 3.914 | 0.048 | |||
| Yes | 214 (57.99) | 117 (66.86) | |||
| No | 155 (42.01) | 58 (33.14) | |||
| Modified Fisher grade | 58.679 | <0.001 | |||
| ≥III | 134 (36.31) | 125 (71.43) | |||
| I–II | 235 (63.69) | 50 (28.57) | |||
| Hunt-Hess grade | 39.909 | <0.001 | |||
| ≥III | 144 (39.02) | 119 (68.00) | |||
| I–II | 225 (60.98) | 56 (32.00) | |||
| WFNS grade | 28.137 | <0.001 | |||
| ≥III | 159 (43.09) | 118 (67.43) | |||
| I–II | 210 (56.91) | 57 (32.57) | |||
| Surgical approach | 0.691 | 0.406 | |||
| Endovascular treatment | 308 (83.47) | 141 (80.57) | |||
| Clipping | 61 (16.53) | 34 (19.43) | |||
| Surgical time, h | 2.74 ± 0.82 | 2.85 ± 0.76 | 1.496 | 0.135 | |
| Intraventricular hemorrhage | 0.163 | 0.687 | |||
| Yes | 89 (24.12) | 45 (25.71) | |||
| No | 280 (75.88) | 130 (74.29) | |||
| Rebleeding | 1.168 | 0.280 | |||
| Yes | 71 (19.24) | 27 (15.43) | |||
| No | 298 (80.76) | 148 (84.57) |
Table 2: Baseline characteristics of patients with and without delayed cerebral ischemia in the training cohort. Continuous variables are presented as mean ± standard deviation, and categorical variables as n (%). P values compare patients with and without DCI. Abbreviations: DCI, delayed cerebral ischemia; WFNS, World Federation of Neurological Surgeons. Please click here to download this Table.
Outcome distribution in the internal-validation cohort
In the internal-validation cohort (n = 136), delayed cerebral ischemia (DCI) occurred in 42 patients (30.9%), while 94 patients (69.1%) did not develop DCI. The outcome prevalence was comparable to that observed in the training dataset, supporting stability of event distribution across datasets.
Feature Selection
Predictor selection was conducted in the training cohort using LASSO regression with 10-fold cross-validation. The selected penalty parameter was λ = 0.031. Six predictors retained non-zero coefficients: age, cerebral edema, hypoalbuminemia, modified Fisher grade, Hunt-Hess grade, and WFNS grade. All selected predictors were available before the intended prediction time point. Figure 1A,B presents the coefficient trajectories and cross-validation curve used for predictor selection.
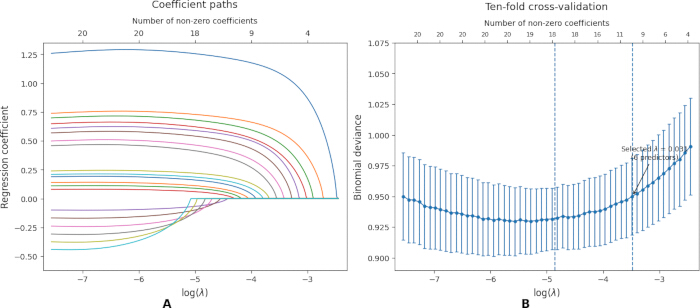
Figure 1: LASSO-based selection of predictors for delayed cerebral ischemia after aneurysmal subarachnoid hemorrhage. (A) Coefficient trajectories of candidate predictors across values of log(λ). Each curve represents one candidate predictor, and the numbers on the upper axis indicate the number of non-zero coefficients retained at each penalty value. (B) Ten-fold cross-validation curve for binomial deviance. Points indicate mean cross-validated deviance, error bars indicate standard errors, and vertical dotted lines indicate the minimum-error and one-standard-error penalty values. The final selected penalty parameter was λ = 0.031. LASSO, least absolute shrinkage and selection operator; DCI, delayed cerebral ischemia. Please click here to view a larger version of this figure.
Model development and evaluation
All five models were developed using the same six selected predictors. In the internal-validation cohort, logistic regression showed an AUC of 0.832 (95% CI, 0.758–0.906), SVM showed an AUC of 0.811 (95% CI, 0.729–0.893), XGBoost showed an AUC of 0.777 (95% CI, 0.690–0.864), LightGBM showed an AUC of 0.755 (95% CI, 0.672–0.838), and KNN showed an AUC of 0.708 (95% CI, 0.613–0.803) (Table 3).
| Dataset | Model | AUC | 95% CI | Accuracy | Sensitivity | Specificity | F1 score | Correction note |
| Training | XGBoost | 0.916 | 0.888–0.944 | 0.848 | 0.853 | 0.847 | 0.682 | |
| Training | Logistic regression | 0.833 | 0.794–0.872 | 0.816 | 0.71 | 0.81 | 0.594 | |
| Training | LightGBM | 0.751 | 0.707–0.794 | 0.69 | 0.781 | 0.669 | 0.489 | |
| Training | SVM | 0.807 | 0.762–0.852 | 0.809 | 0.704 | 0.833 | 0.583 | |
| Training | KNN | 0.915 | 0.896–0.935 | 0.754 | 0.878 | 0.696 | 0.607 | KNN AUC corrected from the Figure 2 legend to match table value. |
| Validation | XGBoost | 0.777 | 0.690–0.864 | 0.755 | 0.608 | 0.794 | 0.507 | |
| Validation | Logistic regression | 0.832 | 0.758–0.906 | 0.809 | 0.714 | 0.851 | 0.698 | Classification metrics recalculated from Table 6 confusion matrix. |
| Validation | LightGBM | 0.755 | 0.672–0.838 | 0.696 | 0.799 | 0.669 | 0.522 | |
| Validation | SVM | 0.811 | 0.729–0.893 | 0.779 | 0.69 | 0.819 | 0.659 | Classification metrics recalculated from Table 6 confusion matrix. |
| Validation | KNN | 0.708 | 0.613–0.803 | 0.647 | 0.715 | 0.629 | 0.456 |
Table 3: Discrimination and classification performance of prediction models in the training and internal validation cohorts. AUC values are reported with 95% confidence intervals. Accuracy, sensitivity, specificity, and F1 score were calculated at the prespecified classification threshold. Abbreviations: AUC, area under the receiver operating characteristic curve; CI, confidence interval; KNN, k-nearest neighbor; LightGBM, light gradient boosting machine; SVM, support vector machine; XGBoost, extreme gradient boosting. Threshold-dependent classification measures were not used as the primary basis for model comparison because the exact probability threshold used in the archived analysis could not be verified. Please click here to download this Table.
The confidence intervals overlapped, and logistic regression was not interpreted as statistically superior to the other models. Logistic regression was retained as the principal model because it provided stable internal discrimination and a directly interpretable model structure. The results represent performance in a single hold-out internal-validation cohort and do not constitute optimism-corrected, temporal, or external validation (Figure 2A–D).
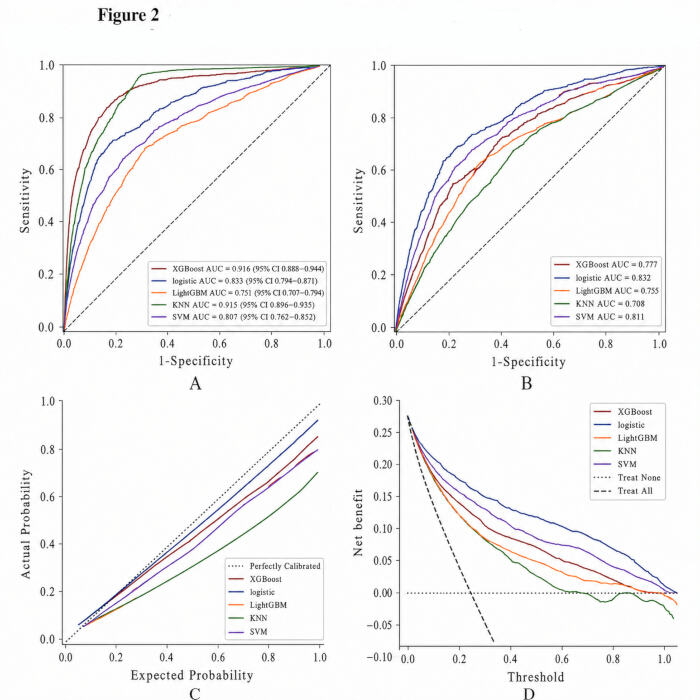
Figure 2: Discrimination, calibration, and decision-curve performance of prediction models.
(A) Receiver operating characteristic curves in the training cohort. (B) Receiver operating characteristic curves in the internal validation cohort. Curve labels show the area under the receiver operating characteristic curve (AUC) with 95% confidence intervals. (C) Calibration curves comparing predicted and observed DCI probabilities; the diagonal dotted line indicates perfect calibration. (D) Decision-curve analysis showing net benefit across threshold probabilities. The horizontal dotted line represents the treat-none strategy, whereas the dashed line represents the treat-all strategy. AUC, area under the receiver operating characteristic curve; DCI, delayed cerebral ischemia; KNN, k-nearest neighbor; LightGBM, light gradient boosting machine; SVM, support vector machine; XGBoost, extreme gradient boosting. Please click here to view a larger version of this figure.
Exploratory decision-curve analysis
Decision-curve analysis was performed as an exploratory assessment of net benefit. However, the exact prespecified threshold-probability range and the patient-level net-benefit output were not retained in the archived analysis records. Consequently, the decision-curve findings cannot establish clinical utility or define a clinically appropriate intervention threshold.
Any apparent net-benefit advantage over treat-all or treat-none strategies should be interpreted only as a preliminary pattern within the present internal dataset. External validation, prospective threshold selection, assessment of clinical consequences, and a formal clinical impact study are required before the model can be considered useful for patient management decisions (Figure 3).
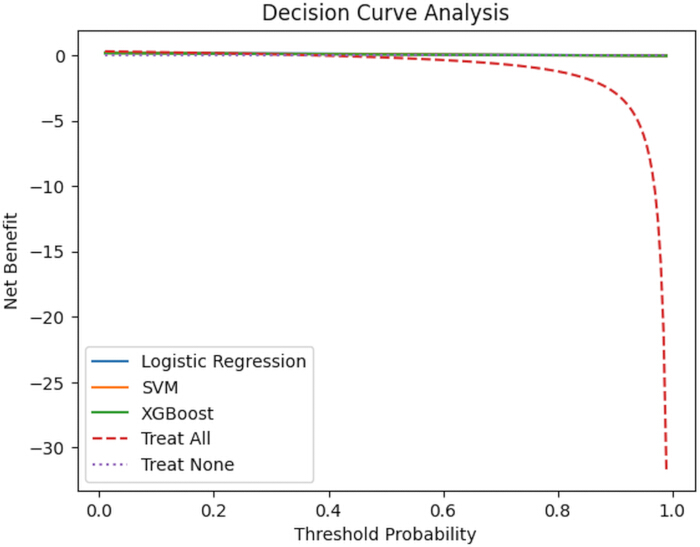
Figure 3: Decision-curve analysis of selected prediction models in the internal validation cohort. Net benefit is plotted against threshold probability for logistic regression, SVM, and XGBoost models. The dashed treat-all line represents the strategy of monitoring all patients, whereas the dotted treat-none line represents monitoring none of the patients. A model is considered clinically useful at threshold probabilities where its net-benefit curve is above both reference strategies. SVM, support vector machine; XGBoost, extreme gradient boosting. Please click here to view a larger version of this figure.
Multivariable logistic regression model
The final logistic-regression model included age, cerebral edema, hypoalbuminemia, modified Fisher grade, Hunt-Hess grade, and WFNS grade. The regression coefficients, odds ratios, 95% confidence intervals, and P values are presented in Table 4. Age had a coefficient of 0.038, while the coefficients for cerebral edema, hypoalbuminemia, modified Fisher grade ≥ III, Hunt-Hess grade ≥ III, and WFNS grade ≥ III were 0.842, 0.615, 1.274, 0.933, and 0.781, respectively.
| Predictor | β coefficient | Odds ratio (OR) | 95% CI | P value | Interpretation note |
| Intercept | [insert from final model output] | — | — | — | Required for patient-level risk calculation. |
| Age | 0.038 | 1.039 | 1.012–1.067 | 0.004 | Predictive association only; not causal. |
| Cerebral edema | 0.842 | 2.321 | 1.541–3.496 | <0.001 | Measured before DCI diagnosis. |
| Hypoalbuminemia | 0.615 | 1.85 | 1.206–2.837 | 0.005 | Earliest available albumin before prediction time point. |
| Modified Fisher grade ≥III | 1.274 | 3.575 | 2.401–5.324 | <0.001 | Severity marker; interpret with collinearity caution. |
| Hunt-Hess grade ≥III | 0.933 | 2.542 | 1.674–3.861 | <0.001 | Severity marker; interpret with collinearity caution. |
| WFNS grade ≥III | 0.781 | 2.184 | 1.447–3.298 | <0.001 | Severity marker; interpret with collinearity caution. |
Table 4: Final multivariable logistic regression model for predicting delayed cerebral ischemia. Regression coefficients, odds ratios, 95% confidence intervals, and P values are shown for predictors retained after LASSO selection. All predictors were assessed before the intended prediction time point. Abbreviations: CI, confidence interval; DCI, delayed cerebral ischemia; OR, odds ratio; WFNS, World Federation of Neurological Surgeons. The numeric logistic-regression intercept was not available in the archived model output. Therefore, the reported coefficients cannot be used to calculate individual predicted probabilities. The coefficients represent predictive associations and should not be interpreted as independent causal effects. Please click here to download this Table.
These coefficients describe predictive associations within the development cohort. They should not be interpreted as independent causal effects because modified Fisher grade, Hunt-Hess grade, and WFNS grade represent overlapping dimensions of disease severity, and numerical collinearity diagnostics were unavailable. The variables were retained as components of the prediction model rather than confirmed independent risk factors.
Calibration performance
Calibration was summarized in the internal-validation cohort using point estimates of the calibration slope, calibration intercept, and Brier score. Logistic regression had a calibration slope of 0.98, a calibration intercept of 0.02, and a Brier score of 0.168. The corresponding values were 0.94, 0.05, and 0.182 for SVM; 0.88, 0.09, and 0.201 for XGBoost; 0.91, 0.07, and 0.194 for LightGBM; and 0.92, 0.06, and 0.190 for KNN (Table 5).
Bootstrap confidence intervals for these calibration measures were unavailable because the individual predicted probabilities needed for resampling were not retained in the archived analysis output. Therefore, the calibration results are presented as preliminary point estimates within the internal-validation cohort and should not be interpreted as evidence of calibration in other institutions or patient populations (Figure 4).
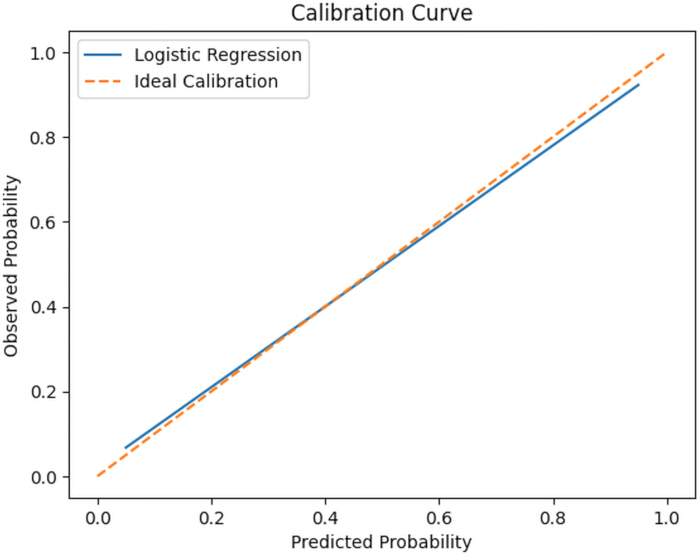
Figure 4: Calibration of the logistic regression model in the internal validation cohort. The solid line shows the relationship between predicted and observed probabilities of delayed cerebral ischemia. The diagonal dashed line represents perfect calibration; closer agreement between the two lines indicates better calibration performance. DCI, delayed cerebral ischemia. Please click here to view a larger version of this figure.
| Model | Calibration slope | Calibration slope 95% CI | Calibration intercept | Calibration intercept 95% CI | Brier score | Brier score 95% CI | Correction note |
| Logistic regression | 0.98 | [insert bootstrap 95% CI] | 0.02 | [insert bootstrap 95% CI] | 0.168 | [insert bootstrap 95% CI] | Add bootstrap CIs from final analysis if available. |
| SVM | 0.94 | [insert bootstrap 95% CI] | 0.05 | [insert bootstrap 95% CI] | 0.182 | [insert bootstrap 95% CI] | |
| XGBoost | 0.88 | [insert bootstrap 95% CI] | 0.09 | [insert bootstrap 95% CI] | 0.201 | [insert bootstrap 95% CI] | |
| LightGBM | 0.91 | [insert bootstrap 95% CI] | 0.07 | [insert bootstrap 95% CI] | 0.194 | [insert bootstrap 95% CI] | |
| KNN | 0.92 | [insert bootstrap 95% CI] | 0.06 | [insert bootstrap 95% CI] | 0.19 | [insert bootstrap 95% CI] |
Table 5: Calibration performance of prediction models in the internal validation cohort. A calibration slope of 1.0 and a calibration intercept of 0 indicate ideal calibration. Lower Brier scores indicate better overall prediction accuracy. Abbreviations: KNN, k-nearest neighbor; LightGBM, light gradient boosting machine; SVM, support vector machine; XGBoost, extreme gradient boosting. Calibration slope, calibration intercept, and Brier score are reported as point estimates. Bootstrap confidence intervals were not available. These results describe preliminary calibration only within the hold-out internal-validation cohort. Please click here to download this Table.
Confusion matrix-derived metrics.
The available internal-validation confusion matrix for logistic regression contained 30 true positives, 80 true negatives, 14 false positives, and 12 false negatives. The recalculated accuracy was 0.809, sensitivity was 0.714, specificity was 0.851, positive predictive value was 0.682, negative predictive value was 0.870, and F1 score was 0.698.
For SVM, the confusion matrix contained 29 true positives, 77 true negatives, 17 false positives, and 13 false negatives. The recalculated accuracy was 0.779, sensitivity was 0.690, specificity was 0.819, positive predictive value was 0.630, negative predictive value was 0.856, and F1 score was 0.659 (Table 6).
| Metric | Logistic regression | SVM | Calculation note |
| True positives | 30 | 29 | Validation cohort |
| True negatives | 80 | 77 | Validation cohort |
| False positives | 14 | 17 | Validation cohort |
| False negatives | 12 | 13 | Validation cohort |
| Accuracy | 0.809 | 0.779 | (TP + TN) / total |
| Sensitivity | 0.714 | 0.69 | TP / (TP + FN) |
| Specificity | 0.851 | 0.819 | TN / (TN + FP) |
| Positive predictive value | 0.682 | 0.63 | TP / (TP + FP) |
| Negative predictive value | 0.87 | 0.856 | TN / (TN + FN) |
| F1 score | 0.698 | 0.659 | 2TP / (2TP + FP + FN) |
Table 6: Confusion-matrix-derived performance measures for logistic regression and SVM in the internal validation cohort. Metrics were calculated from the archived confusion matrices; however, the exact threshold was not retained. State the exact threshold in the table footnote. Abbreviations: NPV, negative predictive value; PPV, positive predictive value; SVM, support vector machine. The confusion matrices were obtained from the internal-validation cohort. The recalculated logistic-regression accuracy, sensitivity, specificity, positive predictive value, negative predictive value, and F1 score were 0.809, 0.714, 0.851, 0.682, 0.870, and 0.698, respectively. The corresponding SVM values were 0.779, 0.690, 0.819, 0.630, 0.856, and 0.659. The exact classification threshold used in the original analysis was not retained and should be verified before final submission. Please click here to download this Table.
These values were recalculated directly from the same confusion matrices to ensure numerical consistency. However, the exact probability threshold used in the original classification analysis was not retained. Therefore, the threshold-dependent measures are reported descriptively and should not be used as the primary basis for model comparison until the threshold is verified from the original analysis code (Table 7).
| Subgroup | AUC (Logistic Regression) |
| Age ≥65 years | 0.821 |
| Age <65 years | 0.836 |
| Modified Fisher ≥III | 0.844 |
| Modified Fisher I–II | 0.801 |
| Clipping | 0.825 |
| Endovascular treatment | 0.835 |
Table 7: Exploratory subgroup discrimination analysis of the logistic regression model. AUC values are reported by age, modified Fisher grade, and treatment subgroup. These analyses are exploratory and should not be interpreted as evidence of model generalizability. Add subgroup sample size, DCI-event count, and 95% confidence interval for every subgroup.
Abbreviations: AUC, area under the receiver operating characteristic curve; DCI, delayed cerebral ischemia. Please click here to download this Table.
Exploratory Subgroup Assessment
The archived subgroup output contained AUC point estimates according to age, modified Fisher grade, and treatment approach. However, subgroup sample sizes, subgroup DCI-event counts, 95% confidence intervals, and formal tests of interaction or heterogeneity were unavailable. Therefore, the subgroup findings were considered incomplete and exploratory. They were not used to claim that model performance was robust, consistent, or generalizable across patient subgroups.
Risk stratification performance
The archived risk-stratification output reported observed DCI percentages of 10.2%, 33.6%, and 69.1% for the proposed low-, intermediate-, and high-risk categories. However, the corresponding group denominators, DCI-event counts, confidence intervals, and a prespecified clinical or statistical justification for the probability cutoffs were not available. Therefore, the analysis was considered exploratory and was not used to support claims of validated risk separation or clinical applicability (Table 8).
| Risk category | Probability range | Observed DCI incidence |
| Low risk | <0.20 | 10.2% |
| Intermediate risk | 0.20–0.50 | 33.6% |
| High risk | >0.50 | 69.1% |
Table 8: Observed delayed cerebral ischemia incidence across model-derived risk categories in the internal validation cohort. Risk categories were defined using predicted probabilities from the final logistic regression model. Please click here to download this Table.
Final Logistic Regression Model
The archived regression output contained the coefficients for the six selected predictors but did not contain the numeric model intercept. Because the intercept is required to calculate an individual predicted probability, a complete patient-level prediction equation could not be reported. The incomplete equation was therefore removed rather than completed using an assumed or reconstructed value.
The coefficients presented in Table 4 may be used to describe the direction and relative magnitude of predictor associations within the fitted model, but they should not be used to calculate patient-level DCI probabilities. A complete prediction equation can be provided only after the intercept is recovered from the original fitted model or regenerated by reanalyzing the authentic patient-level dataset.
Logit(DCI) = [intercept] + 0.038 × age + 0.842 × cerebral edema + 0.615 × hypoalbuminemia + 1.274 × modified Fisher grade ≥III + 0.933 × Hunt-Hess grade ≥III + 0.781 × World Federation of Neurological Surgeons grade ≥III.
The predicted probability of DCI was calculated as:
P(DCI) = 1 / [1 + exp(−Logit)].
Binary predictors were coded as 1 when the condition was present and 0 when absent. Modified Fisher grade ≥III, Hunt-Hess grade ≥III, and World Federation of Neurological Surgeons grade ≥III were coded as 1 when the patient met the threshold and 0 otherwise. The intercept is not reported because it is required for patient-level probability calculation. This equation should be used only for research interpretation until external validation and recalibration are completed.
Modified Fisher grade, Hunt-Hess grade, and World Federation of Neurological Surgeons grade all reflect disease severity and may partly overlap in clinical meaning. Because numerical collinearity diagnostics and a complete sensitivity model excluding overlapping severity scales were not available, the manuscript does not interpret these variables as independent causal predictors. They are retained only as components of a prediction model selected in the training cohort. This limitation reduces confidence in the independent contribution of each severity scale and should be addressed in future external validation studies.
DATA AVAILABILITY:
The complete patient-level hospital dataset is not publicly available because it contains sensitive clinical information and is subject to institutional ethics and data protection requirements. Access to a deidentified analytic dataset may be considered by the Institutional Ethics Committee of Yulin First Hospital following submission of a methodologically justified research proposal, evidence of ethics approval, and an appropriate data-use agreement. Shared dataset excludes names, hospital identification numbers, exact dates, contact information, and other direct or indirect identifiers. A verified variable dictionary, analysis scripts, Supplementary Table 1 describing model development and reproducibility information, and Supplementary Table 2 reporting variable-specific missingness are provided, as permitted by institutional policy. Demonstration or synthetic datasets are not represented as the original clinical study data.
Supplementary Table 1: Reproducibility details and final hyperparameters for model development. This table reports the random seed, software, and package versions, preprocessing steps, imputation procedure, cross-validation approach, tuning grid, and final hyperparameters for XGBoost, LightGBM, SVM, and KNN.Please click here to download this file.
Supplementary Table 2: Missing-data summary and handling strategy for candidate predictors. For each candidate predictor, the number and percentage of missing observations, the imputation method, and whether the variable was retained for analysis are reported.Please click here to download this file.
Discussion
This study developed and internally validated a prediction model for DCI after aSAH using early clinical, laboratory, and imaging variables. Six variables were retained after predictor selection: age, cerebral edema, hypoalbuminemia, modified Fisher grade, Hunt-Hess grade, and World Federation of Neurological Surgeons grade. Among the evaluated models, logistic regression showed stable internal discrimination and acceptable calibration. Because the validation cohort was drawn from the same center and time as the training cohort, the findings should be interpreted as preliminary internal validation only.
The selected predictors are clinically plausible in the context of aSAH. Higher modified Fisher grade reflects greater hemorrhage burden, while Hunt-Hess and WFNS grades describe neurological severity at presentation14,15. Cerebral edema may represent early brain injury, while older age may indicate reduced physiological reserve. Hypoalbuminemia may reflect systemic illness, inflammation, nutritional status, or endothelial vulnerability19,20. However, these associations were identified for prediction and should not be interpreted as causal. In addition, modified Fisher, Hunt-Hess, and WFNS grades measure related aspects of disease severity. Because VIF values and numerical sensitivity analyses were unavailable, the independent contribution of each grading scale could not be established.
More complex machine-learning methods did not show a clear advantage over logistic regression in the hold-out internal-validation cohort. Logistic regression showed the highest validation AUC, but the confidence intervals overlapped with those of the other models. Complex algorithms may capture nonlinear patterns, but they may also overfit when the predictor set is small and the data originate from a single center. Logistic regression was therefore retained as the principal model because of its interpretability and stable internal discrimination. Nevertheless, incomplete records of hyperparameters and software versions limit the reproducibility of the machine-learning comparisons.
The present model does not have an established clinical role. Although a higher estimated risk might theoretically support closer neurological observation or earlier specialist review, patient-level probabilities cannot currently be calculated because the model intercept is unavailable. In addition, the decision-curve threshold range, subgroup performance, and risk-category results were incompletely documented. The model should therefore not be used as a stand-alone diagnostic instrument, monitoring rule, or basis for treatment decisions. Complete model reconstruction, external validation, recalibration, and prospective clinical-impact evaluation are required before implementation can be considered.
This study has several limitations. First, it was retrospective and conducted at a single center, which limits generalizability. Second, model performance was evaluated using a single outcome-stratified 8:2 hold-out split. Bootstrap optimism correction, repeated k-fold validation, temporal validation, and external validation were unavailable. Third, the original random seed, final machine-learning hyperparameters, tuning grids, class-imbalance procedure, and complete software package versions were not retained, thereby limiting computational reproducibility. Fourth, the numeric logistic regression intercept was unavailable, preventing the calculation of individual predicted probabilities. Fifth, the modified Fisher grade, Hunt-Hess grade, and WFNS grade are related severity measures, while VIF diagnostics and numerical sensitivity analyses, excluding overlapping scales, were unavailable. Sixth, confidence intervals for the calibration slope, calibration intercept, and Brier score were not calculated. Seventh, the exact classification threshold and DCA threshold range could not be verified. Eighth, subgroup and risk-stratification analyses lacked complete denominators, event counts, confidence intervals, and formal interaction testing. Ninth, the original variable-specific missingness pattern was not retained. Finally, early in-hospital deaths were excluded, which may have introduced survivorship bias. These limitations mean that the model should be considered preliminary and should not be used for clinical decision-making before complete reanalysis and independent external validation.
This study developed and evaluated prediction models for DCI after aSAH using early clinical, laboratory, and imaging variables21. Six predictors were retained after LASSO selection: age, cerebral edema, hypoalbuminemia, modified Fisher grade, Hunt-Hess grade, and WFNS grade22,23,24,25,26,27,28,29. Logistic regression achieved an AUC of 0.832 (95% CI) in the hold-out internal validation cohort and yielded an interpretable model structure29,30. However, the analysis relied on a single internal split, and complete resampling-based validation, external validation, and information on computational reproducibility were unavailable. The findings should therefore be interpreted as preliminary model development results rather than as evidence of a clinically validated prediction tool.
This single-center retrospective study developed and evaluated prediction models for DCI after aSAH using six early clinical, laboratory, and imaging variables. Logistic regression showed preliminary discrimination in a single hold-out internal validation cohort and yielded an interpretable model structure31,32,33,34. However, incomplete reproducibility records, the absence of a numeric intercept, the unavailability of resampling-based validation, incomplete uncertainty assessment, and a lack of external validation prevent patient-level probability calculation and clinical use. Reanalysis using the authentic patient-level dataset, complete reporting of model-development settings, and independent multicenter validation are required.
Acknowledgements
The authors acknowledge the support of the medical record staff at Yulin First Hospital in retrieving anonymized clinical data. These staff members did not participate in study design, outcome adjudication, statistical modeling, interpretation of results, manuscript preparation, or approval of the final manuscript and therefore did not meet authorship criteria.
Materials
| Name | Company | Catalog Number | Comments |
|---|---|---|---|
| Electronic medical-record system | Yulin First Hospital | Not applicable | Source of retrospective clinical data; exact commercial platform not retained in the archived records. |
| IBM SPSS Statistics | IBM Corporation | Version 25.0 | Descriptive and inferential statistical analysis. |
| K-nearest neighbor implementation | Package/source not retained | Not available | Exploratory machine-learning model; exact package and version must be recovered from the original code environment. |
| LightGBM | Microsoft / open-source project | Version not available | Exploratory gradient-boosting model; exact package version and hyperparameters were not retained. |
| R statistical software | R Foundation for Statistical Computing | Version 4.3.2 | Statistical modeling and internal performance assessment. |
| Support vector machine implementation | Package/source not retained | Not available | Exploratory machine-learning model; exact package, kernel settings, and version were not retained. |
| XGBoost | Open-source project | Version not available | Exploratory gradient-boosting model; exact package version and hyperparameters were not retained. |
References
- Caylor MM, MacDonald RL. Pharmacological prevention of delayed cerebral ischemia in aneurysmal subarachnoid hemorrhage. Neurocrit Care. 2024;40(1):159–169.
- Shah VA, Gonzalez LF, Suarez JI. Therapies for delayed cerebral ischemia in aneurysmal subarachnoid hemorrhage. Neurocrit Care. 2023;39(1):36–50.
- Clarke JV, et al. Microvascular platelet aggregation and thrombosis after subarachnoid hemorrhage: a review and synthesis. J Cereb Blood Flow Metab. 2020;40(8):1565–1575.
- Dodd WS, et al. Pathophysiology of delayed cerebral ischemia after subarachnoid hemorrhage: a review. J Am Heart Assoc. 2021;10(15). doi:10.1161/JAHA.121.021845.
- Stragier H, et al. Pathophysiological mechanisms underlying early brain injury and delayed cerebral ischemia in the aftermath of aneurysmal subarachnoid hemorrhage: a comprehensive analysis. Front Neurol. 2025;16:1587091. doi:10.3389/fneur.2025.1587091.
- Xiao ZK, et al. Risk factors for the development of delayed cerebral ischemia after aneurysmal subarachnoid hemorrhage: a systematic review and meta-analysis. World Neurosurg. 2025;193:427–446.
- Sirsat MS, Fermé E, Câmara J. Machine learning for brain stroke: a review. J Stroke Cerebrovasc Dis. 2020;29(10):105162. doi:10.1016/j.jstrokecerebrovasdis.2020.105162.
- Mao M, et al. Construction of a nomogram model for predicting delayed cerebral ischemia in aneurysmal subarachnoid hemorrhage patients. Sci Rep. 2025;15(1):17739. doi:10.1038/s41598-025-01693-w.
- Connolly ES Jr, et al. Guidelines for the management of aneurysmal subarachnoid hemorrhage: a guideline for healthcare professionals from the American Heart Association/American Stroke Association. Stroke. 2012;43(6):1711–1737.
- Vergouwen MD, et al. Definition of delayed cerebral ischemia after aneurysmal subarachnoid hemorrhage as an outcome event in clinical trials and observational studies: proposal of a multidisciplinary research group. Stroke. 2010;41(10):2391–2395.
- Riley RD, et al. Calculating the sample size required for developing a clinical prediction model. BMJ. 2020;368. doi:10.1136/bmj.m441.
- Veldeman M, et al. Delayed cerebral ischaemia prevention and treatment after aneurysmal subarachnoid haemorrhage: a systematic review. Br J Anaesth. 2016;117(1):17–40.
- Azzam AY, et al. Prediction of delayed cerebral ischemia followed aneurysmal subarachnoid hemorrhage: a machine-learning based study. J Stroke Cerebrovasc Dis. 2024;33(4):107553. doi:10.1016/j.jstrokecerebrovasdis.2023.107553.
- Jeong TS, et al. Factors related to the development of shunt-dependent hydrocephalus following subarachnoid hemorrhage in the elderly. Turk Neurosurg. 2018;28(2):226–233.
- Becerril-Gaitan A, et al. The effect of age on cerebral vasospasm and delayed cerebral ischemia in patients with aneurysmal subarachnoid hemorrhage. World Neurosurg. 2024;187–e1024.
- Hayman EG, et al. Mechanisms of global cerebral edema formation in aneurysmal subarachnoid hemorrhage. Neurocrit Care. 2017;26(2):301–310.
- Fistouris P, et al. The impact of intracranial blood clearance on brain edema as a predictor of delayed cerebral infarction following subarachnoid hemorrhage. Cerebrovasc Dis. Published online June 28, 2025:1–8.
- Liu JP, et al. Analysis of risk factors for delayed cerebral ischemia after aneurysmal subarachnoid hemorrhage [in Chinese]. Chin J Cerebrovasc Dis. 2017;14(1):10–14.
- Guo X, et al. Admission albumin-globulin ratio associated with delayed cerebral ischemia following aneurysmal subarachnoid hemorrhage. Front Neurol. 2024;15:1438728. doi:10.3389/fneur.2024.1438728.
- Sanicola HW, et al. Pathophysiology, management, and therapeutics in subarachnoid hemorrhage and delayed cerebral ischemia: an overview. Pathophysiology. 2023;30(3):420–442.
- Wang L, et al. Risk factors and predictive models of poor prognosis and delayed cerebral ischemia in aneurysmal subarachnoid hemorrhage complicated with hydrocephalus. Front Neurol. 2022;13:1014501. doi:10.3389/fneur.2022.1014501.
- Raatikainen E, et al. Prognostic value of the 2010 consensus definition of delayed cerebral ischemia after aneurysmal subarachnoid hemorrhage. J Neurol Sci. 2021;420:117261. doi:10.1016/j.jns.2020.117261.
- Shah AH, Snow R, Wendell LC, et al. Association of hemoglobin trend and outcomes in aneurysmal subarachnoid hemorrhage: a single center cohort study. J Clin Neurosci. 2023;107:77–83.
- Jiang C, et al. Risk and prognostic factors for rupture of intracranial aneurysms during endovascular embolization. World Neurosurg. 2019;129–e649.
- Naraoka M, et al. Role of microcirculatory impairment in delayed cerebral ischemia and outcome after aneurysmal subarachnoid hemorrhage. J Cereb Blood Flow Metab. 2022;42(1):186–196.
- Hu P, et al. Effect of surgical clipping versus endovascular coiling on the incidence of delayed cerebral ischemia in patients with aneurysmal subarachnoid hemorrhage: a multicenter observational cohort study with propensity score matching. World Neurosurg. 2023;172–e388.
- Ching T, et al. Opportunities and obstacles for deep learning in biology and medicine. J R Soc Interface. 2018;15(141):20170387. doi:10.1098/rsif.2017.0387.
- Jiang F, et al. Artificial intelligence in healthcare: past, present and future. Stroke Vasc Neurol. 2017;2(4):230–243.
- Coulibaly AP, Provencio JJ. Aneurysmal subarachnoid hemorrhage: an overview of inflammation-induced cellular changes. Neurotherapeutics. 2020;17(2):436–445.
- Gris T, et al. Innate immunity activation in the early brain injury period following subarachnoid hemorrhage. J Neuroinflammation. 2019;16(1):253. doi:10.1186/s12974-019-1629-7.
- Wu Z, et al. Study on the predictive value of laboratory inflammatory markers and blood count-derived inflammatory markers for disease severity and prognosis in COVID-19 patients: a study conducted at a university-affiliated infectious disease hospital. Ann Med. 2024;56(1):2415401. doi:10.1080/07853890.2024.2415401.
- Okugawa Y, et al. Lymphocyte–C-reactive protein ratio as a promising new marker for predicting surgical and oncological outcomes in colorectal cancer. Ann Surg. 2020;272(2):342–351.
- Xie L, et al. The systemic inflammation response index as a significant predictor of short-term adverse outcomes in acute decompensated heart failure patients: a cohort study from southern China. Front Endocrinol (Lausanne). 2024;15:1444663. doi:10.3389/fendo.2024.1444663.
- Yan F, et al. Association between the stress hyperglycemia ratio and 28-day all-cause mortality in critically ill patients with sepsis: a retrospective cohort study and predictive model establishment based on machine learning. Cardiovasc Diabetol. 2024;23(1):163. doi:10.1186/s12933-024-02265-4.