This study presents an integrated visualization workflow combining standardized bronchoalveolar lavage fluid collection and processing, a seven-marker flow cytometry panel, a 13-analyte multiplex cytokine assay, and a unified analysis pipeline.
Research Article
Integrated Visualization of Neutrophil Recruitment and Inflammatory Cytokine Profiling in Bronchoalveolar Lavage Fluid
In This Article
Summary
Abstract
Bronchoalveolar lavage fluid (BALF) is the most directly accessible sampling matrix for studying lower airway inflammation, yet conventional analyses rely on single-marker flow cytometry combined with analyte-by-analyte enzyme-linked immunosorbent assay (ELISA), an approach that limits information density and obscures cell–factor coupling. This study presents an integrated visualization workflow that couples standardized collection and preprocessing with a seven-marker neutrophil and monocyte flow cytometry panel, a 13-analyte multiplex cytokine assay, and a unified analysis pipeline based on uniform manifold approximation and projection (UMAP), FlowSOM metaclustering, hierarchical clustering, Spearman correlation networks, and principal component analysis (PCA).
The workflow was applied to a single-center prospective cohort of 112 adults undergoing bronchoscopy, comprising 64 patients with microbiologically confirmed pulmonary infection and 48 non-infection controls. Cytological and flow cytometric readouts revealed a pronounced shift from a macrophage-dominant to a neutrophil-dominant alveolar profile during infection, with the neutrophil percentage rising from a median of 3.2% to 68.4% and the absolute neutrophil concentration increasing approximately 50-fold. Multiplex profiling resolved a coordinated three-module cytokine response, with chemokine, proinflammatory, and regulatory modules all upregulated and CXCL8/IL-8, IL-1β, IL-6, CXCL1/GRO-α, and G-CSF showing the strongest single-marker discrimination within the study cohort (area under the curve [AUC] 0.89 to 0.94). Integrative visualization using PCA, a correlation matrix, and a network graph revealed a tightly coupled neutrophil–chemokine axis at the participant level, with BALF neutrophil count emerging as the central network hub.
The workflow uses only material routinely obtained from clinically indicated BAL, requires no additional sample volume, and provides an information-dense framework for resolving airway inflammation in respiratory infection that may be feasible in tertiary-care laboratories equipped with multiparameter flow cytometry and multiplex bead-array platforms, extending into longitudinal, single-cell, and therapeutic-evaluation studies. Broader clinical adoption of individual analytes as biomarkers will require prospective validation in independent multicenter cohorts.
Introduction
Infectious deaths from lower respiratory tract infections remain a significant cause of global mortality, although advancements in vaccine strategies and treatment modalities have been made; nevertheless, this remains especially true among the pediatric and elderly populations1. Neutrophils are the primary cells reported in the early stages of an innate immune response in the affected respiratory system, a process that is vital for eliminating the invading pathogen; however, uncontrolled neutrophilic inflammation results in the breakdown of the alveolar capillary barrier, oxidative damage to tissue, and the development of acute respiratory distress syndrome (ARDS)2,3. Neutrophils in the lung airspace also exhibit recruitment kinetics, retention patterns, and effector behavior that differ from other tissues, and these differences influence whether the infection resolves or progresses to severe pneumonia4.
The bronchoalveolar lavage fluid (BALF) is an important source of information on the alveolar microenvironment and offers the closest representation of clinical immunity at this site5. The chemokine CXCL8 plays an essential role in recruiting neutrophils to the lungs via its receptors, CXCR1 and CXCR2, alongside other chemokines, including CXCL1, CXCL2, and CXCL56. The cytokines IL-1β, IL-6, and TNF-α further enhance this process, whereas IL-10 acts as a counteracting cytokine. Their levels in BALF have been shown to correlate with the severity of lung infections and the development of lung complications due to bacterial, viral, and atypical pneumonia7, and multiplex BALF biomarker profiles are being adopted for earlier diagnosis and pathogen discrimination in lower respiratory tract infection8.
Routine BALF testing usually fails to fully encompass the biology underlying the test. Cell counts can be estimated by manually differentiating cells in cytospin samples, whereas soluble mediators are measured using individual enzyme-linked immunosorbent assays (ELISAs) and presented as a bar chart. Chemokines, cytokines, and each cell type are evaluated separately, with no correlation established between a particular chemokine concentration gradient and the cell populations that it affects in the sample. The combination of cytokine modules, chemokine-neutrophil dose-response relationships, and patient subpopulations with their own inflammation signatures is often overlooked in the absence of multivariate analysis9.
Advances in computation make such a holistic approach progressively realistic. Combining multiparameter flow cytometry and spectral flow cytometry with approaches for dimensionality reduction, such as t-distributed stochastic neighbor embedding (t-SNE) or uniform manifold approximation and projection (UMAP), allows the mapping of high-dimensional immune phenotypes into two-dimensional space, with UMAP proving to have better retention of global topology and reproducibility when applied to cytometry data10. Multi-analyte panels of cytokines, followed by hierarchical clustering and correlation networks, help identify severity-correlated signatures not discernible with single-cytokine approaches11. Despite progress in the field, no workflow yet brings these methods together to study neutrophil recruitment and cytokine signatures from the same BALF specimens in respiratory infection. This study describes an integrated visualization workflow to investigate neutrophil recruitment using cytology and multiparameter flow cytometry, followed by UMAP and cytokine signature analyses via multiplex immunoassay, with hierarchical clustering, correlation matrices, and principal component analysis. The workflow yields an integrated visualization that encompasses cellular and soluble immune readouts of the airways in a single graph, using BALF samples routinely obtained during clinically indicated bronchoscopy in lower respiratory tract infection.
Protocol
Study population and ethics
This was a single-center prospective observational study conducted at a tertiary teaching hospital between January 2026 and April 2026. The protocol was approved under approval number 2026HL-038, and written informed consent was obtained from every participant before any study procedure.
Adults aged 18 to 75 years undergoing diagnostic flexible bronchoscopy with bronchoalveolar lavage (BAL) as part of routine clinical care were recruited consecutively and assigned to an infection group or a non-infection control group based on their final clinical and microbiological diagnoses. An overview of the integrated visualization workflow, from patient recruitment through to the integrated visual outputs, is shown in Figure 1.
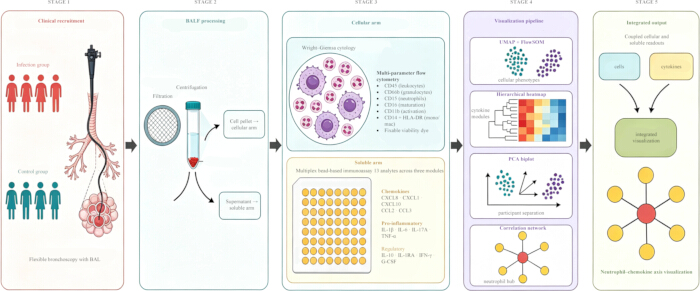
Figure 1: Overview of the integrated visualization workflow for BALF-based profiling of neutrophil recruitment and inflammatory cytokine responses. The five stages summarize, from left to right, prospective recruitment of the infection and control groups with bronchoscopy and BAL, BALF preprocessing into a cell pellet and a supernatant fraction, parallel cellular (Wright–Giemsa cytology and multiparameter flow cytometry) and soluble (13-plex bead-based immunoassay) measurements, the unified visualization pipeline (UMAP with FlowSOM meta-clustering, hierarchical heatmap, principal component analysis, and Spearman correlation network), and the integrated visual output. Abbreviations: BAL = bronchoalveolar lavage; BALF = BAL fluid; UMAP = uniform manifold approximation and projection. Please click here to view a larger version of this figure.
Infection group inclusion criteria were as follows: (1) patients diagnosed with either community-acquired pneumonia (CAP), hospital-acquired pneumonia (HAP) or ventilator-associated pneumonia (VAP) as per Infectious Diseases Society of America (IDSA) and American Thoracic Society (ATS) guidelines; (2) detection of one or more pathogens through BALF culture ≥104 colony-forming units (CFU)/mL, respiratory multiplex polymerase chain reaction (PCR), metagenomic next-generation sequencing of BALF, or specific antigen/antibody testing from paired respiratory/serum specimens.
Control group criteria were as follows: (1) noninfectious reasons for bronchoscopy, consisting of the assessment of an indeterminate lung nodule, abnormal radiology results not suggestive of infection, or examination for chronic cough; (2) no acute pulmonary infection demonstrated by negative results from microbiological testing and lack of any signs of inflammation or systemic infection at the time of bronchoscopy; and (3) no use of antibiotics in the 30 days prior to participation. Controls were recruited from patients undergoing bronchoscopy for other clinically indicated pulmonary conditions rather than from healthy volunteers, reflecting the population from which clinically indicated BAL is routinely obtained at the study center.
Exclusion criteria included: (1) malignancy and/or cytotoxic chemotherapy in the preceding six months; (2) HIV seropositivity; (3) solid organ or hematopoietic stem cell transplantation; (4) sustained immunosuppressive therapy involving a daily equivalent prednisone dosage > 0.3 mg/kg for more than 3 weeks; (5) pregnant/lactating females; (6) history of bleeding diathesis or any contraindications to flexible bronchoscopy; (7) pre-existing severe chronic respiratory disease (chronic obstructive pulmonary disease [COPD] Global Initiative for Chronic Obstructive Lung Disease [GOLD] stage III/IV, idiopathic pulmonary fibrosis, severe persistent asthma, or clinically significant bronchiectasis); (8) active tuberculosis; (9) involvement in another interventional study within the last 30 days. BAL was performed during the first bronchoscopy, within 72 h of admission for infections, and within 48 h of intubation in mechanically ventilated patients with infections.
Sample size calculations were focused on the primary cellular outcome: the number of neutrophils in BALF among groups. With respect to the anticipated effect size of 0.6 SD between infected and non-infected airways, and considering a 15% dropout allowance, a minimum sample size of 45 subjects per group was needed for two-sided α = 0.05 with 80% statistical power. Out of 156 eligible candidates, 27 did not satisfy the eligibility requirements (18 failed to fulfill the inclusion criteria mainly due to inability to identify a pathogenic agent responsible for their disease within the stipulated period or lack of agreement with the procedure itself; 9 breached exclusion criteria primarily owing to active malignancy or history of chemotherapeutic administration, chronic corticosteroid use, severe pre-existing chronic lung disease, or bleeding diathesis). The remaining 129 participants underwent bronchoscopy. Subsequently, 17 subjects were withdrawn from the study (7 because of inadequate BALF yield < 40%; 4 because of consent withdrawal while hospitalized; and 6 because of reclassification of subjects after final microbiologic evaluation – 4 control candidates diagnosed with occult infection based on culture results; and 2 infection candidates who lacked evidence of infection after culture analysis). The final pool of study subjects comprised 112 participants: 64 with infection and 48 without.
BALF collection and preprocessing
Bronchoscopy was performed by skilled operators using the standard institutional protocol, consistent with published technical recommendations for bronchoalveolar lavage12. Lidocaine was used topically, and patients received moderate intravenous sedation while supplemental oxygen was provided to keep oxygen saturation (SpO₂) >92%. The flexible bronchoscope was inserted and positioned into the bronchopulmonary segment with radiological abnormalities. In cases where the radiological abnormalities were diffuse or unlocalizable, right middle lobe or left lingular segments were chosen. After each instillation, gentle manual suction with negative pressure < 100 mmHg was performed. A total of three to five instillations of sterile saline at 37 °C, 20–40 mL each, for a total volume of 100–150 mL, were administered. The recovery ratio was estimated as the recovered volume relative to the instilled volume, and only samples with a recovery ≥40% were considered for analysis.
The collected samples from the second and subsequent washes were pooled to reduce bronchial contamination and obtain an alveolar-enriched sample. The bronchoalveolar lavage fluid (BALF) pool was kept on ice and processed within 2 h of collection, taking into account recent findings on changes in the cellular composition and differential counts after prolonged storage and warming of human BALF samples13. After filtration using a sterile nylon mesh with a pore size of 70 microns to filter out the mucus, performed by mechanical passage alone without an added mucolytic or anticlumping agent such as dithiothreitol, since pilot testing showed this was sufficient to remove mucus clumps without measurable loss of downstream surface-epitope integrity, the fluid was subjected to centrifugation at 400 × g for 10 min at 4 °C. The supernatant was decanted and aliquoted into low-protein-binding cryovials for cytokine analysis, and the cells were suspended in phosphate-buffered saline (PBS) with 0.5% bovine serum albumin and 2 mM ethylenediaminetetraacetic acid (EDTA), with part of them kept for cytology and flow cytometry. Cytokine samples were frozen in liquid nitrogen, kept at –80 °C, and subjected to no more than one freeze-thaw cycle before use.
Neutrophil cytology and flow cytometric quantification
In terms of cytopathology, 100 µL of the BALF cell suspension was applied to the glass slide using a cytocentrifuge (see Table of Materials) at 300 × g for 5 min, air-dried, and stained with Wright-Giemsa. Differential counts were performed by a hematology technologist without knowledge of the patient's medical background, who counted a minimum of 400 cells per slide and calculated percentages of macrophages, lymphocytes, neutrophils, and eosinophils. BALF neutrophil percentages were considered the primary outcome measure for cytopathology, given current evidence suggesting their usefulness in distinguishing infectious from noninfectious lung diseases in patients with pulmonary infiltrates14.
The flow cytometry quantification protocol was based on a recent validation of the four-color bronchoalveolar lavage fluid (BALF) leukocyte differentiation protocol15 and included additional markers to identify neutrophils. Specifically, around 5 × 10⁵ cells isolated from BALF were blocked with a human Fc receptor-blocking reagent (see Table of Materials) for 10 min at 4 °C, and then stained for 20 min at 4 °C with antibodies against CD45 (clone HI30), CD66b (clone G10F5), CD15 (clone HI98), CD16 (clone 3G8), CD11b (clone ICRF44), CD14 (clone M5E2), and HLA-DR (clone L243), in addition to a fixable viability dye (see Table of Materials). For erythrocyte lysis, a commercial erythrocyte lysing solution (see Table of Materials) was used for 10 min at room temperature. After erythrocyte lysis, cells were washed twice with PBS supplemented with 2% fetal calf serum and resuspended in flow buffer, then analyzed with a multicolor flow cytometer (see Table of Materials). Compensation was performed using single-stained compensation beads (see Table of Materials), and fluorescence-minus-one and unstained tubes were included for each panel.
At least 1 × 10⁵ CD45⁺ events were acquired for each sample. Singlets on the FSC-A/FSC-H plot were gated first, followed by live (viability dye⁻) CD45⁺ leukocytes, after which exclusion of CD14⁺HLA-DR⁺ monocyte-macrophages was performed to select high-side scatter CD66b⁺ granulocytes. Neutrophils were then defined within the granulocyte population as CD15⁺CD16⁺CD11b⁺ events. This primary CD66b⁺ granulocyte gate was drawn broadly around all high-side-scatter events rather than being restricted to the CD15⁺CD16⁺CD11b⁺ boundary, so that CD16-dim, CD11b-high activated neutrophils and other less mature granulocyte forms remained within the total automated neutrophil count; the stricter CD15⁺CD16⁺CD11b⁺ definition was applied only to characterize the mature-neutrophil subset reported separately in the downstream clustering analyses. The neutrophil count in BALF (cells/µL) was estimated based on neutrophil percentage and the total nucleated cell count determined using an automated hematology analyzer (see Table of Materials). Compensation matrices, gating strategy, and individual sample quality-control reports were archived, and analysts remained blind to participant group assignments throughout acquisition and analysis.
Multiplex inflammatory cytokine profiling
BALF supernatants were thawed once on wet ice, followed by brief vortexing and clarification by centrifugation at 10,000 × g for 5 min at 4 °C directly prior to assay. Measurement of 13 analytes in three functional categories was achieved using a multiplex bead-based immunoassay platform with a custom magnetic bead panel (see Table of Materials). The pro-inflammatory group comprised IL-1β, IL-6, IL-17A and TNF-α; the chemokine group comprised CXCL8/IL-8, CXCL1/GRO-α, CXCL10/IP-10, CCL2/MCP-1 and CCL3/MIP-1α; and the regulatory group comprised IL-10, IFN-γ, IL-1RA and G-CSF. The choice of analytes was based on those most commonly reported as informative in multiplex analyses of BALF or serum cytokines in pneumonia/severe respiratory infection studies7,11. The dilution factor (1:2 in assay buffer) was determined from a pilot experiment conducted on a representative subset of both infected and control samples to ensure that >90% of measurements fell within the standard curve.
The standard curves were determined using seven-point serial dilutions of the manufacturer's recombinant standards, prepared in duplicate on every plate, including one blank well to subtract the background. The curve fitting was conducted via five-parameter logistic (5PL) regression by the instrument's proprietary acquisition and analysis software (see Table of Materials). The lower limit of quantification (LLOQ) was calculated as the smallest amount of standard yielding a back-fit recovery between 80% and 120% and an intrarun coefficient of variation (CV) ≤ 20%. The values that fell below the LLOQ were substituted by LLOQ/√2. Two pooled bronchoalveolar lavage fluid (BALF) quality-control samples, each from a representative infected patient and an unaffected subject, were aliquoted and added to each plate to track the long-term performance. Quality assurance standards were based on best-practice recommendations derived from a 12 year multisite multiplex bead-based assay proficiency program16, including requirements for intra-assay CV ≤ 10% in duplicate wells, inter-plate CV ≤ 20% for quality control, and a minimum bead count of ≥ 50 per analyte per well. Plates that failed to meet the above criteria were rerun. Analysis was performed in a single batch within four weeks, using a single kit lot, with random interleaving of the infection and control samples.
Visualization analysis pipeline
The Flow Cytometry Standard (FCS) files were first analyzed using commercial flow cytometry software (see Table of Materials) to compensate and gate live CD45⁺ singlets, and then exported for unbiased analysis in R v4.4. For each sample, 10,000 CD45⁺ events were downsampled and concatenated, and signal intensities were transformed using the arcsinh function with a cofactor of 150. Dimension reduction and UMAP projections were conducted using the uwot package at 15 nearest neighbors and a minimum distance of 0.1, along with parallel t-SNE embeddings using the Rtsne package with perplexity 3010. Phenotype clusters were identified using FlowSOM with 100 self-organizing map nodes and further divided into 12–15 clusters via meta-clustering, using an optimization-based approach that has recently been validated for high-dimensional cytometry data17. Each cluster was annotated based on its median expression of lineage and activation markers and reviewed against the manual gates.
For the analysis of multiplex cytokine data, raw values were first log₁₀ transformed and then standardized between analytes via z-scoring before additional analyses. Both analytes and patients underwent hierarchical clustering using Euclidean distance and Ward.D2 linkage; the results were displayed in a row- and column-clustered heatmap. Such an approach was used to detect co-expressed cytokine modules and classify patient subsets in multiplex inflammatory cohorts9. Correlation matrices were generated for all cellular and soluble biomarkers using pairwise Spearman rank correlations. Heatmaps of the correlation matrices were plotted alongside a network in which nodes correspond to biomarkers and edges indicate correlations that survived multiple-testing correction using the Benjamini–Hochberg (BH) method. Edge width was scaled according to the correlation coefficient magnitude |ρ|, and edges were included only if |ρ| ≥ 0.30 and p < 0.05 after correction. Principal component analysis (PCA) was performed on the standardized matrix containing cells and cytokines using the prcomp() function with unit variance scaling. Participants were projected onto the first two principal components with infection and control groups overlaid. Consistent downsampling and standardization of all analyses ensured comparability between cellular and soluble biomarker readouts across all visualizations.
Statistical analysis
Continuous variables were described using the median (interquartile range, IQR) when non-normal according to Shapiro–Wilk tests, and mean (standard deviation, SD) otherwise. Categorical variables were described using frequencies and proportions. Comparisons between groups were performed using the Mann–Whitney U test when continuous variables had non-normal distributions, the Welch t-test when continuous variables were normally distributed, and the chi-squared test/Fisher's exact test when applicable for categorical variables. The associations between continuous variables were assessed through Spearman's rank correlation coefficient. To account for the false discovery rate (FDR) in multiplex cytokine and correlation analyses, p-values were adjusted using the Benjamini–Hochberg method with a cutoff of q < 0.05. Two-sided p < 0.05 was considered statistically significant in all primary analyses. Where possible, cases with missing data on individual variables were retained and analyzed by complete-case analysis for the affected variable, while multiple imputations using chained equations (m = 20) were performed to conduct sensitivity analyses. Receiver operating characteristic curves and the corresponding area under the curve (AUC) were generated for individual cytokines using the pROC package within the full study cohort; a separate external validation cohort was not used. Pre-specified sensitivity analyses repeated the primary group comparisons after excluding participants who had received antibiotics within 72 h before bronchoscopy, and after stratifying the infection group by mechanical ventilation status and by pneumonia subtype (community-acquired, hospital-acquired, or ventilator-associated). Analyses were performed using the rstatix, FlowSOM, uwot, ComplexHeatmap, igraph, pROC, and mice packages in R v4.4. Figures were generated using commercial scientific graphing software (see Table of Materials).
Results
Study population and sample characteristics
There were 112 subjects in the final analysis cohort, with 64 subjects in the infection group and 48 subjects in the non-infection control group. Baseline demographics were similar between groups, while laboratory parameters related to infection were higher in the infection group, as shown in Table 1. Infections were primarily caused by Gram-negative bacteria, with the main bacterial pathogens being Klebsiella pneumoniae, Pseudomonas aeruginosa, and Acinetobacter baumannii. Other pathogens were Streptococcus pneumoniae, Staphylococcus aureus, atypical agents, viruses, and mixed infections.
The BALF recovery rates met the prespecified threshold of ≥40% for all retained samples, with slightly lower rates in the infection group compared to the control group (median 48.3% vs 53.3%, p = 0.03), consistent with increased airway inflammation and mucosal congestion in the infected airways. Because the recovered volume also differed between groups (58 mL vs 64 mL, p = 0.04), all reported cytokine concentrations may be subject to a modest between-group difference in dilution factor; a pre-specified sensitivity analysis restricted to samples with recovery rate ≥50% (n = 42 infection, n = 34 control) reproduced the direction and magnitude of every between-group comparison (largest change in effect size < 8%), indicating that dilutional bias is unlikely to account for the observed differences. The time between collection and processing was 65 min for the infection group and 62 min for the control group, staying within the 2 h window. Quality-control (QC) criteria at the sample level indicated high-quality results. Cytological differential counts were obtained based on ≥400 counted cells in all 112/112 samples (100%). The flow cytometry acquisitions met the prespecified criterion of ≥1 × 10⁵ CD45⁺ events in all 112/112 samples (100%), with a median live-cell viability of 89.4% (IQR 85.6–92.8%). All multiplex cytokine plates met the QC criteria after a single re-run. For all 13 analytes, the intra-assay coefficient of variation (CV) was 4.7% (2.1–9.3%, all <10%), the inter-plate CV of pooled QC samples was 11.2% (6.8–18.4%, all <20%), and the median number of beads was 78 events/analyte/well (53–142, all ≥ 50).
| Variable | Infection (n = 64) | Control (n = 48) | p value |
| Age, years, median [IQR] | 62 [54–71] | 60 [52–68] | 0.41 |
| Male, n (%) | 38 (59.4) | 26 (54.2) | 0.59 |
| BMI, kg/m2, median [IQR] | 23.8 [21.4–26.2] | 23.5 [21.6–25.7] | 0.66 |
| Smoking history, n (%) | 0.52 | ||
| Never | 28 (43.8) | 25 (52.1) | |
| Former | 22 (34.4) | 16 (33.3) | |
| Current | 14 (21.9) | 7 (14.6) | |
| Hypertension, n (%) | 27 (42.2) | 18 (37.5) | 0.62 |
| Diabetes mellitus, n (%) | 17 (26.6) | 10 (20.8) | 0.49 |
| Coronary heart disease, n (%) | 11 (17.2) | 6 (12.5) | 0.51 |
| Chronic kidney disease, n (%) | 5 (7.8) | 3 (6.3) | 0.76 |
| Bronchoscopy indication, n (%) | — | ||
| Community-acquired pneumonia | 35 (54.7) | — | |
| Hospital-acquired pneumonia | 19 (29.7) | — | |
| Ventilator-associated pneumonia | 10 (15.6) | — | |
| Indeterminate pulmonary nodule | — | 23 (47.9) | |
| Persistent radiographic abnormality | — | 15 (31.3) | |
| Chronic cough evaluation | — | 10 (20.8) | |
| Causative pathogen, n (%) | — | ||
| Gram-negative bacteria | 28 (43.8) | ||
| Gram-positive bacteria | 16 (25.0) | ||
| Atypical pathogens | 7 (10.9) | ||
| Respiratory viruses | 8 (12.5) | ||
| Mixed infection | 5 (7.8) | ||
| Mechanical ventilation at BAL, n (%) | 14 (21.9) | 0 (0) | <0.001 |
| Antibiotic exposure within 72 h before BAL, n (%) | 41 (64.1) | 0 (0) | <0.001 |
| Volume instilled, mL, median [IQR] | 120 [120–140] | 120 [120–140] | 0.84 |
| Volume recovered, mL, median [IQR] | 58 [49–68] | 64 [55–73] | 0.04 |
| BALF recovery rate, %, median [IQR] | 48.3 [42.5–55.6] | 53.3 [46.2–60.5] | 0.03 |
| Time to processing, min, median [IQR] | 65 [50–85] | 62 [48–80] | 0.55 |
| Blood WBC, × 10⁹/L, median [IQR] | 11.8 [8.6–14.5] | 6.4 [5.3–7.8] | <0.001 |
| Blood neutrophils, %, median [IQR] | 78.5 [70.2–86.4] | 60.3 [54.6–66.8] | <0.001 |
| C-reactive protein, mg/L, median [IQR] | 78.5 [42.6–128.4] | 4.2 [1.8–8.6] | <0.001 |
| Procalcitonin, ng/mL, median [IQR] | 0.86 [0.32–2.45] | 0.05 [0.03–0.08] | <0.001 |
Table 1: Demographic, clinical, and BALF processing characteristics of the study cohort. Baseline demographic characteristics, comorbidities, bronchoscopy indications, causative pathogens, procedural parameters, and peripheral blood laboratory values are compared between the 64 participants in the infection group and the 48 in the non-infection control group. Continuous variables are reported as median [interquartile range] and compared using the Mann–Whitney U test; categorical variables are reported as n (%) and compared using the chi-squared test or Fisher's exact test where applicable. Abbreviations: BAL = bronchoalveolar lavage; BALF = bronchoalveolar lavage fluid; BMI = body mass index; IQR = interquartile range; WBC = white blood cell count.
Visualization of BALF neutrophil recruitment
A clear shift in the ratio from a macrophage-dominated population to a neutrophil-dominated one was observed among the infected subjects, as shown in Figure 2. The cytocentrifuge preparations were stained using the Wright–Giemsa technique, and the staining showed a clear distinction between the two groups, where the control group had more alveolar macrophages, some lymphocytes, and a few neutrophils, while the infected group was dominated by neutrophils with frequent intracellular bacteria, degenerated nuclei, and toxic granulations. Differential counts based on at least 400 enumerated cells were used to verify the differences, whereby the neutrophil ratio increased from a median value of 3.2% (IQR: 1.8–5.6%) in the control group to 68.4% (IQR: 49.2–82.5%) in the infected group (p < 0.001), while that of the alveolar macrophages decreased from 88.2% (IQR: 82.4–92.5%) to 22.6% (IQR: 12.3–38.5%) (p < 0.001). Lymphocyte percentages were similar between groups (7.4% [4.8–11.3%] vs 6.5% [3.4–11.2%], p = 0.42).
The gating and dimensionality-reduction analyses confirmed and expanded the cellular phenotypes observed by microscopy. After excluding debris, doublets, and dead cells, CD45⁺CD66b⁺ granulocytes accounted for a median of 65.8% (IQR: 46.2–79.4%) of CD45⁺ leukocytes in the infection group versus 4.1% (IQR: 2.3–6.8%) in the control group (p < 0.001). Within the granulocyte population, CD15⁺CD16⁺CD11b⁺ mature neutrophils accounted for 92.4% (IQR: 87.5–95.8%) of all granulocytes in the infection group versus 88.6% (IQR: 82.3–93.5%) in the control group, indicating that the recruited neutrophil pool was largely composed of mature, fully differentiated cells rather than early precursors. The UMAP and t-SNE projections based on the arcsinh-transformed surface protein matrix showed nearly identical topologies in which infection cases occupied a prominent island of CD15⁺CD16⁺CD11b⁺ mature neutrophils that was sparsely populated in control samples, while the HLA-DR⁺CD14⁺ alveolar macrophage island showed the opposite pattern, densely populated in controls and sparsely populated in infection. Meta-clustering by FlowSOM identified 13 subpopulations, among which a mature neutrophil subpopulation (38.4% [22.6–56.2%] vs 2.8% [1.5–4.6%], p < 0.001) and an activated CD16-dim CD11b-high neutrophil cluster (22.6% [11.4–32.5%] vs 0.4% [0.1–1.2%], p < 0.001) showed the largest between-group expansions.
In terms of the absolute neutrophil count, there was an approximately 50-fold increase in BALF neutrophils in the infection group compared to the control group. The total number of nucleated cells per µL of BALF rose from 156 cells/µL (IQR 88–232) in the control group to 384 cells/µL (IQR 180–712) in the infection group (p < 0.001), and neutrophil counts rose from 5 cells/µL (IQR 2–13) in the control group to 262 cells/µL (IQR 89–578) in the infection group (p < 0.001). Pairwise differences in neutrophil percentage and absolute count between groups remained highly significant after Benjamini–Hochberg (BH) adjustment (q < 0.001).
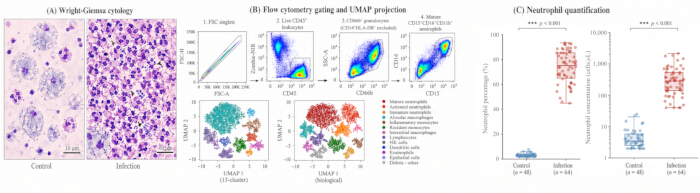
Figure 2: Visualization of BALF neutrophil recruitment. Representative Wright–Giemsa-stained cytospin fields from a control participant and an infected participant illustrate the shift from a macrophage-predominant to a neutrophil-predominant BALF cellular profile. A four-step flow cytometry gating strategy (FSC singlets → live CD45⁺ leukocytes → CD66b⁺ granulocytes after CD14⁺HLA-DR⁺ exclusion → CD15⁺CD16⁺CD11b⁺ mature neutrophils), a UMAP embedding of arcsinh-transformed flow cytometry data with FlowSOM 13-metacluster overlay colored by biological annotation, and box plots of BALF neutrophil percentage and absolute neutrophil concentration (cells/µL, log scale) are shown side by side to allow direct comparison of the cellular phenotypes identified in the infection and control groups. Abbreviations: BALF = bronchoalveolar lavage fluid; FSC = forward scatter; UMAP = uniform manifold approximation and projection. Please click here to view a larger version of this figure.
Visualization of BALF inflammatory cytokine profiles
A pattern of coordinated responses across multiple cytokine axes distinguished the infection group from the control group, and the cytokines were grouped into three consistent functional modules, as shown in Figure 3. Clustering of log₁₀-transformed and normalized cytokine concentrations using the Ward.D2 method produced a clear two-group dendrogram of samples, where infection samples and controls occupied opposite ends of the dendrogram, and only seven misclassified participants were observed (six controls clustered with infection samples, mostly chronic-cough cases with mild neutrophilic airway inflammation, and one infection sample clustered with controls, which represented early atypical pneumonia). The dendrogram of the analytes defined three cytokine clusters. The chemokine cluster, comprising CXCL8, CXCL1, CXCL10, CCL2, and CCL3, showed the greatest fold change between infection and control groups and the highest intra-module correlation. The pro-inflammatory cluster, containing IL-1β, IL-6, IL-17A, and TNF-α, showed similar directional elevations, though somewhat less pronounced. The regulatory cluster, including IL-10, IL-1RA, IFN-γ, and G-CSF, was also elevated in infection samples, indicating that the response was not purely pro-inflammatory but engaged counter-regulatory and antiviral arms in parallel.
Medians (IQRs) of all tested analytes were higher in the infection group compared to the control group, and the adjusted p value was less than 0.001 for all 13 analytes after BH-based false-discovery-rate (BH-FDR) correction. Among the analytes, CXCL8/IL-8 had the highest concentration and the steepest fold change (from 68 [32–142] pg/mL in the control group to 2,485 [842–6,520] pg/mL in the infection group, an approximately 36-fold increase). A parallel pattern was shown for CXCL1/GRO-α, with an approximately 21-fold increase (78 [36–148] vs 1,672 [524–3,890] pg/mL). IL-1β showed an approximately 13-fold increase (5.8 [2.6–11.4] vs 78 [29–184] pg/mL). IL-6, IL-1RA, and G-CSF showed 13- to 16-fold increases (16.4 [7.8–30.5] vs 248 [82–612] pg/mL; 112 [48–258] vs 1,748 [658–3,964] pg/mL; 24 [10–52] vs 384 [125–912] pg/mL, respectively). Other smaller increases included TNF-α (~8-fold), CXCL10/IP-10 (~9-fold), CCL2/MCP-1 (~8-fold), CCL3/MIP-1α (~10-fold), IL-10 (~10-fold), IFN-γ (~6-fold), and IL-17A (~4-fold).
Within-cohort receiver operating characteristic analysis identified IL-8 (AUC 0.94), IL-1β (AUC 0.92), IL-6 (AUC 0.91), CXCL1 (AUC 0.91), and G-CSF (AUC 0.89) as the analytes with the strongest single-marker discrimination between the infection and control groups; these AUC values summarize discrimination within the analysis cohort in the absence of a separate external validation set. Sensitivity analysis under multiple imputation by chained equations (m = 20) yielded estimates within 5% of the complete-case medians for every analyte and did not change the rank order of effect sizes.
Pre-specified sensitivity analyses were used to assess the influence of prior antibiotic exposure and pneumonia subtype on the observed cytokine differences. When the primary group comparisons were repeated after excluding the 41 infection-group participants (64.1%) who had received antibiotics within 72 h before BAL, all 13 analytes remained significantly higher in the remaining 23 infection cases than in controls after BH-FDR correction (adjusted p < 0.001 for the five leading discriminators), with point estimates that were slightly higher rather than lower than the whole-cohort medians (for example, CXCL8/IL-8 2,860 [980–7,110] pg/mL and IL-1β 92 [34–210] pg/mL), consistent with partial dampening of airway cytokines by pre-BAL antibiotic exposure. Stratification of the infection group by pneumonia subtype showed the same rank order of chemokine and pro-inflammatory cytokines across community-acquired pneumonia (n = 35), hospital-acquired pneumonia (n = 19), and ventilator-associated pneumonia (n = 10), with the ventilator-associated pneumonia subgroup showing the highest median levels for CXCL8, CXCL1, IL-6, and G-CSF, and mechanical ventilation status did not alter the direction of any between-group comparison.
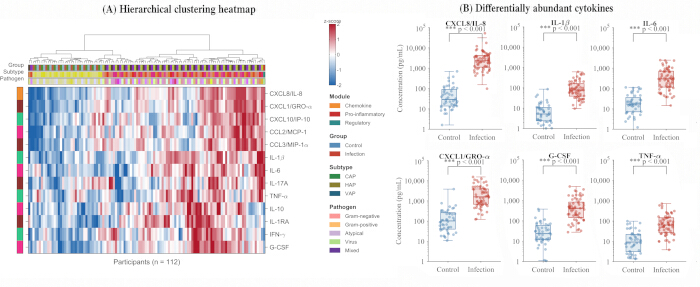
Figure 3: Visualization of BALF inflammatory cytokine profiles. Hierarchical clustering heatmap of log₁₀-transformed and z-scored concentrations of the 13 measured analytes across all 112 participants, with colored annotation bars above the heatmap indicating group assignment (control, infection), pneumonia subtype (CAP, HAP, or VAP pneumonia), and causative pathogen category (Gram-negative, Gram-positive, atypical, viral, or mixed infection). Box plots of the leading differentially abundant cytokines (CXCL8/IL-8, IL-1β, IL-6, CXCL1/GRO-α, G-CSF, and TNF-α; log₁₀ scale, pg/mL) compare the infection and control groups. *** p < 0.001 after BH false-discovery-rate correction. Abbreviations: BALF = bronchoalveolar lavage fluid; BH = Benjamini–Hochberg; CAP = community-acquired pneumonia; HAP = hospital-acquired pneumonia; VAP = ventilator-associated pneumonia. Please click here to view a larger version of this figure.
Coupled visualization of neutrophil recruitment and cytokine profiles
Coupling the cellular and soluble compartments revealed a strong biological connection between neutrophil recruitment and the chemokine system, as shown in Figure 4. A two-dimensional depiction was derived from principal component analysis (PCA) of the standardized cellular and cytokine matrix, with PC1 accounting for 51.1% of the total variance and PC2 for a further 12.7%, for a cumulative 63.8%. PC1 separated the infection group from controls, characterized by high positive loadings on BALF neutrophils, CXCL8, CXCL1, IL-6, IL-1β, and G-CSF, and high negative loadings on macrophages. PC2 segregated between a chemokine-rich trajectory (high positive loadings on CXCL8 and CXCL1) and a regulatory-rich trajectory (positive loadings on IL-10, IL-1RA, and IFN-γ), so that within the infection group, participants tended to separate according to severity, with mechanically ventilated ventilator-associated pneumonia cases falling into the high-chemokine quadrant.
Pairwise Spearman rank correlations between 17 cellular and soluble traits revealed a strong positive correlation between the BALF neutrophil count and the overall chemokine axis (CXCL8 ρ = 0.78; CXCL1 ρ = 0.74; CCL3 ρ = 0.69; CCL2 ρ = 0.61; CXCL10 ρ = 0.54; all adjusted p < 0.001). The second level of significant correlations was detected between neutrophil counts and the pro-inflammatory axis (G-CSF ρ = 0.65; IL-1β ρ = 0.62; IL-6 ρ = 0.58; TNF-α ρ = 0.51), followed by moderate positive correlations with the regulatory axis (IL-10 ρ = 0.45; IL-1RA ρ = 0.48). The percentage of macrophages showed a mirrored negative correlation with both the chemokine and pro-inflammatory axes of similar strength. Within-axis correlations were substantially stronger than between-axis correlations (median |ρ| within-axis = 0.68 vs. median |ρ| between-axis = 0.33), supporting the concept of common upstream regulatory pathways that control the chemokine, pro-inflammatory, and regulatory axes.
The correlation network mapped this coupling onto a graph in which BALF neutrophils were the most central hub node, with all 13 edges to cytokines surviving BH correction for multiple testing. Of the 136 possible pairwise connections between the 17 features, 99 met the joint criterion of |ρ| ≥ 0.30 and BH-adjusted p < 0.05 and were retained. The correlation network graph displayed a clear three-block modular architecture that recapitulated the clusters obtained from hierarchical clustering: the densest and strongest connections were between the chemokine module and the BALF neutrophil count and percentage, intermediate-weight connections linked the pro-inflammatory module to both neutrophils and the chemokine module, and thin connections from the regulatory module bridged the chemokine and pro-inflammatory blocks. The macrophage percentage node sat opposite the neutrophil–chemokine block and was linked to it via a fan of negatively weighted edges. Collectively, PCA, the correlation matrix, and the network graph revealed a coherent pattern in which BALF neutrophil infiltration and the chemokine response are strongly associated at the individual-participant level, and the pro-inflammatory and regulatory pathways serve as well-defined but interconnected modules around this neutrophil–chemokine axis.
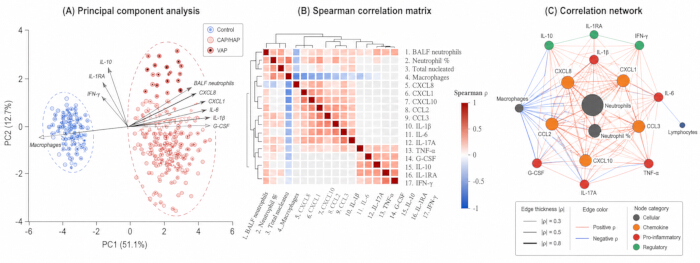
Figure 4: Coupled visualization of neutrophil recruitment and inflammatory cytokine profiles. Principal component analysis biplot of the standardized cellular and cytokine matrix with participants colored by group, Spearman correlation heatmap, and network graph of all 17 cellular and soluble features (nodes sized by degree, edges scaled by |ρ| and filtered by BH-adjusted p < 0.05 and |ρ| ≥ 0.30), highlighting the neutrophil–chemokine hub. Abbreviations: BH = Benjamini–Hochberg; PC = principal component. Please click here to view a larger version of this figure.
DATA AVAILABILITY:
The de-identified participant-level dataset and the R analysis code used in this study are provided as Supplemental Table S1 and Supplemental File 1. Other data supporting the findings of this study are available from the corresponding author upon reasonable request.
Supplemental Table S1: BALF dataset. Please click here to download this file.
Supplemental File 1: A ZIP file containing analysis codes. Please click here to download this file.
Discussion
The robustness of this protocol depends on a few decisions made before and during analysis. Setting the lower-bound recovery rate at 40% and combining the second and subsequent aliquots was an intentional decision, as the first aliquot contains a higher enrichment of bronchial airway materials, while the recovery rate systematically varies with age, sex, smoking history, and the target bronchus18. Blocking Fc receptors and titrating antibodies against individual clones to ensure correct gating boundaries between mature CD15⁺CD16⁺CD11b⁺ neutrophils and CD14⁺HLA-DR⁺ alveolar macrophages (the dominant cells in the BALF sample with the highest non-specific staining and autofluorescence background) is vital to maintain consistency between the two groups19,20. The freeze–thaw limitation and 2-h timeframe for the multiplex analysis are not random either. Data on human BALF showed a significant reduction in neutrophil percentages from 6 to 24 h, even when stored at 4 °C, while macrophage and lymphocyte percentages remained consistent13. Parameters for t-SNE and UMAP algorithms, as well as parameters for the FlowSOM 100-node grid and for 12–15 metaclusters, were determined in advance of analyzing groups to prevent post hoc tuning, which is one of the known reasons for the irreproducibility of cytometry pipelines16. Operators and plate/run identification can still be retained per cell event to apply batch-correction methods in future large-scale analyses21.
There are several common failure modes that do not require changes to the protocol. Low recovery (<40%) is typically due to insufficient wedge positioning or excessive suction; this issue should be remedied by adjusting the bronchoscope position and reducing suction to <100 mmHg before aspirating another aliquot. Excessive autofluorescence from alveolar macrophages, the major confounder in lung cell flow cytometry analysis, can be mitigated by including unstained lung cell controls in every batch and clearly defining the high-side-scatter macrophage gate rather than relying solely on viability dyes19. Multiplex panels are commonly compromised by low bead counts and outlying high values. Running a preliminary dilution curve for a subset of infected and control samples prior to fixing a 1:2 dilution ensures avoidance of signal saturation of CXCL8, CXCL1, and G-CSF, located at the highest part of the standard curve for pneumonia samples, due to their previously discovered matrix effect in BALF samples22. The protocol can be further adjusted depending on cohort specifics. When samples predominantly contain a single pathogen type, reducing the core panel to include only chemokines and pro-inflammatory mediators would preserve sufficient statistical power. In the case of a mixed population containing bacteria, viruses, and atypical pathogens, it will still be beneficial to measure regulatory mediators as well, since the pathogen-specific signature in alveolar neutrophils and macrophages was recently proven to exist23, and a combination of pro- and regulatory BALF cytokines was shown to reflect disease severity in community-acquired pneumonia24.
The contribution of the present workflow is not the individual observation of neutrophilic influx or of chemokine and pro-inflammatory cytokine elevation in respiratory infection, both of which are extensively documented, but the coupling of a seven-marker neutrophil–monocyte flow cytometry panel and a 13-analyte multiplex immunoassay to a shared visualization pipeline applied to the same BALF specimen. The implementation of a seven-marker panel targeting neutrophils and monocytes, along with a 13-analyte multiplex immunoassay, captures phenotypic and cytokine complexity; without this, the analysis would require several independent tests with a far larger volume of BALF than is obtainable from a normal bronchoscopy sample. The former aligns well with previous work showing that multicolor flow cytometry is as reliable as manual microscopy for cell type identification in BALF samples15, while the acceptance criteria for the latter reflect best practices from a recognized multicenter multiplex bead-based assay proficiency program16. In particular, the combined heatmap, network plot, and PCA built using identical standardized inputs reveal relationships between cell types and their associated factors that could previously only be inferred by summing independent bar charts. This matters because BALF-derived chemokines CXCL8, CCL2, and CCL3 work together to recruit neutrophils and monocytes from a shared circulatory bed, and their joint structure carries information that cannot be gleaned from independent single-analyte readouts9,10. BALF is already routinely obtained for clinical purposes and requires no additional volume, so the workflow can be positioned as a translational add-on to existing bronchoscopy services rather than as a stand-alone diagnostic procedure.
The practical turnaround time of the full workflow, comprising sample transport, staining, flow cytometry acquisition, multiplex assay incubation and readout, and the downstream computational pipeline, is on the order of 24 h under research-laboratory conditions. The workflow is therefore positioned as a deep phenotyping tool for mechanistic characterization and treatment-response monitoring rather than as an acute bedside triage assay for time-critical decisions such as immediate distinction between ventilator-associated pneumonia and sterile acute respiratory distress syndrome, for which faster microbiological and single-marker biomarker assays remain the standard of care.
There are several limitations that need to be mentioned. BALF is collected from the airspace and represents the immediate surface interactions of the airspace, yet it does not contain cells located within the alveolar wall and septum, where many activated macrophages and tissue-resident lymphocytes localize. Hence, there is no one-to-one ratio between the immune statuses of the airspace and parenchyma, consistent with previously published data25. Multiplex bead-based detection suffers from antibody cross-reactivity, as well as matrix effects, that are especially prevalent in the mucin- and surfactant-containing environment of BALF compared to that of blood serum; in addition, the process of dilution of the epithelial lining fluid with saline cannot be overcome by any of the endogenous markers, such as urea, in agreement with recently published critiques26. The recovered lavage volume was, on average, 6 mL lower in the infection group than in controls, so the absolute concentrations reported here are subject to a modest between-group difference in dilution factor, and no endogenous dilution marker was applied. Prior antibiotic exposure in 41 of the 64 infection-group participants (64.1%) may attenuate airway cytokine concentrations and pathogen recovery. Importantly, the protocol only represents a snapshot at a single time point during clinically indicated bronchoscopy, thereby precluding analysis of the kinetics of neutrophil recruitment, maximal chemokine secretion, and their resolution in individual patients. Single-analyte AUC values were derived from the same cohort used for biomarker identification, in the absence of an independent validation cohort, and should be interpreted as measures of within-cohort discrimination rather than as externally validated diagnostic performance; adoption of any single-marker cutoff in clinical practice would require prospective validation in an independent multicenter cohort. Prespecified sensitivity analyses restricted to specimens with higher recovery, to antibiotic-naïve participants, and stratified by mechanical ventilation status and by pneumonia subtype (community-acquired, hospital-acquired, or ventilator-associated) did not alter the direction of the between-group comparisons.
In the future, these limitations can be addressed by adding single-cell RNA sequencing or CITE-seq to the same BALF pellets used for protein and cell quantification, which have been successfully applied in large cohorts of bacterial pneumonia and pediatric Mycoplasma pneumoniae pneumonia, to reveal alveolar neutrophils and macrophage subsets not distinguishable by traditional flow cytometry27,28. Adding the information obtained via airspace analyses to that provided by imaging mass cytometry or spatial transcriptomics of matching biopsies or even autopsy material would contextualize this information29. Linking longitudinal BALF sampling to the evaluation of CXCR1/CXCR2 antagonists and IL-6-receptor blockade, both of which have shown survival or organ-support benefit in severe pneumonia and acute respiratory distress syndrome (ARDS), would also allow the neutrophil–chemokine axis foregrounded by this workflow to be tested as a therapeutic decision aid30,31.
In conclusion, this study describes an integrated visualization workflow consisting of standardized BALF collection and preparation procedures, a seven-marker flow cytometry panel quantifying neutrophil–monocyte composition, a multiplex cytokine assay measuring 13 cytokines, and a common visualization platform comprising UMAP, hierarchical clustering, correlation network, and PCA analyses. By applying the workflow to a prospective cohort of 112 adults undergoing clinically indicated bronchoscopy, the analysis identified a striking transition in alveolar immune cell composition from macrophages to neutrophils in patients with infection, detected a three-module cytokine response pattern, and uncovered a strongly coupled neutrophil–chemokine axis that is not observable using any single-marker measurements. The procedure relies exclusively on material collected during clinical diagnosis, does not require additional sample volume, and may be feasible in tertiary-care laboratories equipped for multiparameter flow cytometry and multiplex bead-array analysis. Broader adoption and any use of individual analytes as diagnostic biomarkers will require prospective validation in independent multicenter cohorts. The study thus presents a reproducible and data-rich methodology for characterizing airway inflammation in respiratory infections and provides a basis for its further development into longitudinal studies, single-cell and spatial analysis, and therapeutic assessment of immunomodulation targeting the neutrophil–chemokine axis.
Disclosures
The authors have no conflicts of interest to declare.
Acknowledgements
We sincerely thank all patients and volunteers who participated in this study for their valuable cooperation. We gratefully acknowledge the Ethics Committee for the ethical approval (Approval No. 2026HL-038) and normative guidance during the whole research process.
We thank the medical staff of the Respiratory Department, Bronchoscopy Center and Clinical Laboratory for their support in clinical specimen collection, bronchoalveolar lavage fluid processing and microbiological detection. We also appreciate the technical platform support from the hospital central laboratory for high-dimensional flow cytometry and multiplex cytokine profiling experiments.
This research did not receive any specific grant from funding agencies in the public, commercial, or not-for-profit sectors.
We thank all researchers, technicians, and nursing staff involved in this project for their efforts in patient screening, sample management, experimental operation, and data arrangement.
Materials
| Name | Company | Catalog Number | Comments |
|---|---|---|---|
| Anti-human CD11b antibody, Brilliant Violet 421, clone ICRF44 | BioLegend | Cat. No. 301323 | Neutrophil activation marker; violet laser channel URL: https://www.biolegend.com |
| Anti-human CD14 antibody, APC/Cyanine7, clone M5E2 | BioLegend | Cat. No. 301820 | Monocyte-macrophage exclusion marker; red laser channel URL: https://www.biolegend.com |
| Anti-human CD15 antibody, PE, clone HI98 | BioLegend | Cat. No. 301906 | Neutrophil lineage marker; blue laser channel URL: https://www.biolegend.com |
| Anti-human CD16 antibody, Brilliant Violet 510, clone 3G8 | BioLegend | Cat. No. 302048 | Neutrophil maturation and NK cell marker; violet laser channel URL: https://www.biolegend.com |
| Anti-human CD45 antibody, PerCP, clone HI30 | BioLegend | Cat. No. 304026 / RRID: AB_893338 | Pan-leukocyte marker; blue laser channel URL: https://antibodyregistry.org/AB_893338 |
| Anti-human CD66b antibody, FITC, clone G10F5 | BioLegend | Cat. No. 305103 | Granulocyte marker; blue laser channel URL: https://www.biolegend.com |
| Anti-human HLA-DR antibody, PerCP/Cyanine5.5, clone L243 | BioLegend | Cat. No. 307629 | Antigen-presenting cell marker; blue laser channel URL: https://www.biolegend.com |
| Automated haematology analyser (Sysmex XN-1000) | Sysmex Corporation | Instrument (model XN-1000) | Used to determine total nucleated cell count for absolute neutrophil calculation URL: https://www.sysmex.com |
| Bovine serum albumin | Sigma-Aldrich (MilliporeSigma) | Cat. No. A7906 | Used in flow cytometry staining buffer (0.5% w/v in PBS with 2 mM EDTA) URL: https://www.sigmaaldrich.com/US/en/product/sigma/a7906 |
| ComplexHeatmap package (R/Bioconductor) | Bioconductor Project | v2.20 (open-source) | Used for hierarchical clustering heatmaps of multiplex cytokine data URL: https://bioconductor.org/packages/ComplexHeatmap |
| Cytocentrifuge (Cytospin 4) | Thermo Fisher Scientific | Cat. No. A78300003 | Used to prepare cytology slides from BALF cell suspension URL: https://www.thermofisher.com/order/catalog/product/A78300003 |
| Erythrocyte lysing solution (BD FACS Lysing Solution, 10X concentrate) | BD Biosciences | Cat. No. 349202 | Used for erythrocyte lysis after surface staining URL: https://www.bdbiosciences.com |
| Ethylenediaminetetraacetic acid (EDTA), 0.5 M pH 8.0 | Thermo Fisher Scientific (Invitrogen) | Cat. No. AM9260G | Used in flow cytometry staining buffer at 2 mM URL: https://www.thermofisher.com/order/catalog/product/AM9260G |
| Fixable viability dye (Zombie NIR Fixable Viability Kit) | BioLegend | Cat. No. 423105 | Live-dead exclusion prior to gating; red laser channel URL: https://www.biolegend.com |
| Flexible video bronchoscope | Olympus Corporation (BF-1TQ290) | Instrument (model BF-1TQ290) | Used for BAL under moderate sedation URL: https://www.olympus-global.com |
| Flow cytometer, multicolour (CytoFLEX LX) | Beckman Coulter Life Sciences | Instrument (model CytoFLEX LX, six-laser configuration) | Used for acquisition of the seven-marker neutrophil/monocyte flow panel URL: https://www.beckman.com |
| Flow cytometry analysis software (FlowJo) | BD Biosciences (FlowJo LLC) | v10.10 | Used for compensation and manual gating of FCS files URL: https://www.flowjo.com |
| FlowSOM package (R/Bioconductor) | Bioconductor Project | v2.12 (open-source) | Used for self-organising-map clustering and meta-clustering of flow cytometry data URL: https://bioconductor.org/packages/FlowSOM |
| GraphPad Prism (statistical graphing software) | GraphPad Software (Dotmatics) | v10 | Used to generate final figures URL: https://www.graphpad.com |
| Human Fc receptor-blocking reagent (Human TruStain FcX) | BioLegend | Cat. No. 422301 / RRID: AB_2818986 | Fc receptor block prior to antibody staining URL: https://antibodyregistry.org/AB_2818986 |
| igraph package (R) | CRAN | v2.0 (open-source) | Used to construct and visualise the correlation network graph URL: https://cran.r-project.org/package=igraph |
| Low-protein-binding cryogenic vials, 2.0 mL | Thermo Fisher Scientific (Nunc) | Cat. No. 375418 | Used for BALF supernatant aliquots for cytokine analysis URL: https://www.thermofisher.com/order/catalog/product/375418 |
| Luminex multiplex bead-based immunoassay platform (MAGPIX) | Luminex Corporation (DiaSorin) | Instrument (model MAGPIX) | Used for acquisition of the multiplex cytokine assay URL: https://www.luminexcorp.com |
| May-Grünwald-Giemsa stain solution | Sigma-Aldrich (MilliporeSigma) | Cat. No. GS500 | Used for cytospin differential cell count URL: https://www.sigmaaldrich.com/US/en/product/sigma/gs500 |
| mice package (R) | CRAN | v3.16 (open-source) | Used for multiple imputation by chained equations in sensitivity analysis URL: https://cran.r-project.org/package=mice |
| Multiplex magnetic bead cytokine/chemokine panel (13-plex, custom; MILLIPLEX MAP Human Cytokine/Chemokine) | Merck / MilliporeSigma | Cat. No. HCYTOMAG-60K | Custom panel measuring the 13 analytes described in Section 2.4 URL: https://www.merckmillipore.com |
| Nylon mesh cell strainer, 70 µm | Corning (Falcon) | Cat. No. 352350 | Used for mechanical filtration of BALF to remove mucus clumps URL: https://www.corning.com |
| Phosphate-buffered saline (PBS), pH 7.4 | Thermo Fisher Scientific (Gibco) | Cat. No. 10010023 | Base buffer for cell resuspension and staining URL: https://www.thermofisher.com/order/catalog/product/10010023 |
| pROC package (R) | CRAN | v1.18 (open-source) | Used to generate ROC curves and AUC values URL: https://cran.r-project.org/package=pROC |
| R (statistical computing environment) | R Core Team | v4.4 (open-source) | Platform for statistical analyses and visualisation URL: https://www.r-project.org |
| rstatix package (R) | CRAN | v0.7 (open-source) | Used for group comparisons and correlation statistics URL: https://cran.r-project.org/package=rstatix |
| Rtsne package (R) | CRAN | v0.17 (open-source) | Used for t-SNE embeddings URL: https://cran.r-project.org/package=Rtsne |
| Single-stained compensation beads (UltraComp eBeads Compensation Beads) | Thermo Fisher Scientific (Invitrogen) | Cat. No. 01-2222-42 | Used for single-colour compensation controls URL: https://www.thermofisher.com/order/catalog/product/01-2222-42 |
| Sodium chloride solution for injection, 0.9% (sterile saline) | Baxter International | Cat. No. 2B1324 | Used for BAL instillation (100–150 mL, 20–40 mL aliquots at 37 °C) URL: https://www.baxter.com |
| uwot package (R) | CRAN | v0.2 (open-source) | Used for UMAP dimensionality reduction URL: https://cran.r-project.org/package=uwot |
| xPONENT (multiplex assay acquisition and curve fitting software) | Luminex Corporation (DiaSorin) | v4.3 | Instrument-proprietary software for 5PL standard curve fitting URL: https://www.luminexcorp.com |
References
- Yu X, et al. Estimating the global and regional burden of lower respiratory infections attributable to leading pathogens and the protective effectiveness of immunization programs. Int J Infect Dis. 2024;149:107268.
- Rizo-Téllez SA, Filep JG. Beyond host defense and tissue injury: the emerging role of neutrophils in tissue repair. Am J Physiol Cell Physiol. 2024;326(3):C661-83.
- Zhou X, Jin J, Lv T, Song Y. A narrative review: the role of NETs in acute respiratory distress syndrome/acute lung injury. Int J Mol Sci. 2024;25(3):1464.
- Haynes ME, Sullivan DP, Muller WA. Neutrophil infiltration and function in the pathogenesis of inflammatory airspace disease. Am J Pathol. 2024;194(5):628-36.
- Davidson KR, Ha DM, Schwarz MI, Chan ED. Bronchoalveolar lavage as a diagnostic procedure: a review of known cellular and molecular findings in various lung diseases. J Thorac Dis. 2020;12(9):4991-5019.
- Cambier S, Gouwy M, Proost P. The chemokines CXCL8 and CXCL12: molecular and functional properties, role in disease and efforts towards pharmacological intervention. Cell Mol Immunol. 2023;20(3):217-51.
- Lin J, et al. Local and systemic cytokine profiles in children with pneumonia-associated lung consolidation. Front Immunol. 2025;16:1546730.
- Huang C, et al. Heparin-binding protein in bronchoalveolar lavage fluid as a biomarker for discriminating severe bacterial and viral pneumonia in critically ill children. Mediators Inflamm. 2023;2023:6123911.
- Polley DJ, et al. Identification of novel clusters of co-expressing cytokines in a diagnostic cytokine multiplex test. Front Immunol. 2023;14:1223817.
- Roca CP, et al. A cross entropy test allows quantitative statistical comparison of t-SNE and UMAP representations. Cell Rep Methods. 2023;3(1):100389.
- Hawerkamp HC, et al. Characterisation of the pro-inflammatory cytokine signature in severe COVID-19. Front Immunol. 2023;14:1170012.
- Meyer KC, et al. An official American Thoracic Society clinical practice guideline: the clinical utility of bronchoalveolar lavage cellular analysis in interstitial lung disease. Am J Respir Crit Care Med. 2012;185(9):1004-14.
- Shionoya Y, et al. Impact of storage conditions on bronchoalveolar lavage fluid analysis: a human study. Diagnostics (Basel). 2025;15(11):1386.
- Li J, et al. Diagnostic test accuracy of cellular analysis of bronchoalveolar lavage fluid in distinguishing pulmonary infectious and non-infectious diseases in patients with pulmonary shadow. Front Med (Lausanne). 2024;11:1496088.
- Bratke K, Weise M, Stoll P, Virchow JC, Lommatzsch M. Flow cytometry as an alternative to microscopy for the differentiation of BAL fluid leukocytes. Chest. 2024;166(4):793-801.
- Rountree W, et al. Sources of variability in Luminex bead-based cytokine assays: evidence from twelve years of multi-site proficiency testing. J Immunol Methods. 2024;531:113699.
- Tao W, Sinha A, Raddassi K, Pandit A. Parameter optimization for stable clustering using FlowSOM: a case study from CyTOF. Front Immunol. 2024;15:1414400.
- Shikano K, et al. What are the factors affecting the recovery rate of bronchoalveolar lavage fluid? Clin Respir J. 2022;16(2):142-51.
- Baumann Z, et al. Optimized full-spectrum flow cytometry panel for deep immunophenotyping of murine lungs. Cell Rep Methods. 2024;4(11):100885.
- Bonilla DL, et al. The power of reagent titration in flow cytometry. Cells. 2024;13(20):1677.
- Ogishi M, et al. Multibatch cytometry data integration for optimal immunophenotyping. J Immunol. 2021;206(1):206-13.
- Sudo K, et al. Case study observational research: inflammatory cytokines in the bronchial epithelial lining fluid of COVID-19 patients with acute hypoxemic respiratory failure. Crit Care. 2024;28(1):134.
- Williams JE, et al. Epigenetic regulation of neutrophils in ARDS. Cells. 2025;14(15):1151.
- Zhang Y, et al. Interleukin-6 in blood and bronchoalveolar lavage fluid of hospitalized children with community-acquired pneumonia. Front Pediatr. 2022;10:922143.
- Bailey JI, et al. Profibrotic monocyte-derived alveolar macrophages are expanded in patients with persistent respiratory symptoms and radiographic abnormalities after COVID-19. Nat Immunol. 2024;25(11):2097-109.
- Haeger S, et al. The bronchoalveolar lavage dilution conundrum: an updated view on a long-standing problem. Am J Physiol Lung Cell Mol Physiol. 2024;327(5):L807-13.
- Xiao K, et al. A pan-immune panorama of bacterial pneumonia revealed by a large-scale single-cell transcriptome atlas. Signal Transduct Target Ther. 2025;10(1):5.
- Shen X, et al. Single-cell transcriptome atlas revealed bronchoalveolar immune features related to disease severity in pediatric Mycoplasma pneumoniae pneumonia. MedComm (2020). 2024;5(10):e748.
- Megas S, Wilbrey-Clark A, Maartens A, Teichmann SA, Meyer KB. Spatial transcriptomics of the respiratory system. Annu Rev Physiol. 2025;87(1):447-70.
- Landoni G, et al. A multicenter phase 2 randomized controlled study on the efficacy and safety of reparixin in the treatment of hospitalized patients with COVID-19 pneumonia. Infect Dis Ther. 2022;11(4):1559-74.
- Sellarès-Nadal J, et al. Efficacy of tocilizumab for hospitalized patients with COVID-19 pneumonia and high IL-6 levels: a randomized controlled trial. Infection. 2025;53(5):1851-61.