Using bioinformatics, machine learning, and qPCR validation, this study identified five candidate biomarkers associated with SUMOylation and mitochondrial dysfunction in heart failure. These findings improve understanding of heart failure mechanisms and suggest potential directions for future diagnostic research.
Research Article
Identification of Candidate Biomarkers Associated with Mitochondrial Dysfunction and SUMOylation in Heart Failure Based on Bioinformatics Approaches
Opens in a new tab
In This Article
Summary
Loading...
$$\rightleftharpoonup{xx}$$
$$\longleftharp{xx}$$,
$$\longrightharp{xx}$$,
Abstract
Loading...
$$\rightleftharpoonup{xx}$$
$$\longleftharp{xx}$$,
$$\longrightharp{xx}$$,
Heart failure (HF) presents a persistent clinical challenge. While SUMOylation and mitochondrial function are vital for cardiomyocyte health, their combined influence on HF remains elusive. Two HF-related datasets were downloaded from GEO. The overlapping genes were obtained from all genes in the training set, SUMO-related genes, and mitochondrial-related genes. Three machine learning algorithms were applied to identify diagnostic key genes. Subsequently, diagnostic models were constructed and evaluated based on these genes. Besides, the immune microenvironment in HF versus healthy controls was assessed using CIBERSORT, MCP-counter, and ssGSEA. The differences in immune infiltration between HF and healthy controls were analyzed. Drug prediction and molecular docking were performed to identify potential drug candidates targeting these genes. Finally, qPCR was employed to validate gene expression levels in clinical samples. A total of 113 common genes with notable enrichment in mitochondrial regulation were identified. Five key genes, namely NFKB1, MYEF2, NSUN2, SQSTM1, and FKBP4, were identified by three machine learning algorithms. Functional enrichment analyses linked these genes to immune response, RNA processing, and cell cycle regulation. Moreover, immune infiltration profiling revealed that neutrophil infiltration contributes to dysregulated immune responses in HF. Molecular docking revealed that the small-molecule drug IMX-942 has a favorable binding affinity with SQSTM1 (-5.8 kcal/mol). qPCR validation supported the bioinformatics results. NFKB1, MYEF2, NSUN2, SQSTM1, and FKBP4 were identified as key genes linking SUMOylation and mitochondrial function in HF. These findings provide new insights into HF pathophysiology and may contribute to the development of novel diagnostic and therapeutic strategies.
Introduction
Loading...
$$\rightleftharpoonup{xx}$$
$$\longleftharp{xx}$$,
$$\longrightharp{xx}$$,
Heart failure (HF), the end-stage of various cardiovascular diseases, is characterized by impaired cardiac function that fails to meet the body's metabolic demands1. This debilitating condition poses significant threats to patient health, leading to decreased quality of life and elevated mortality rates2. Current diagnostic modalities for HF primarily include biochemical marker detection3,4, echocardiography, and radiological imaging5. Although available treatments encompass pharmacological agents, device-based interventions, and surgical procedures, clinical outcomes remain unsatisfactory6. Limitations such as adverse drug reactions, limited applicability of devices, immune rejection, and other complications frequently hinder therapeutic efficacy7,8,9,10,11. Therefore, there is an urgent need to elucidate the underlying mechanisms of HF, identify early and precise diagnostic biomarkers, and develop more effective and safer therapeutic strategies.
Small ubiquitin-like modifier (SUMO) proteins are covalently conjugated to the lysine residues of substrate proteins through a dynamic and reversible process, regulating the structure and function of substrate proteins12. SUMOylation, a critical post-translational modification, serves as a key regulator of various cellular processes13,14. Mitochondria, as the energy-metabolism center of cells, are critically involved in the pathogenesis of HF. In the pathological process of HF, mitochondrial dysfunction, such as insufficient ATP production, reactive oxygen species (ROS) burst, and Ca2+ homeostasis imbalance, contributes significantly to progression15,16,17,18. Notably, emerging evidence suggests a potential interplay between SUMOylation and mitochondrial function. Mitochondrial stress can trigger SUMOylation-related pathways, while SUMO proteins and their specific proteases are essential for maintaining mitochondrial homeostasis19,20,21. Recent studies have further highlighted the importance of mitochondrial quality control and mitochondrial dynamics in cardiovascular diseases and HF progression22,23. However, the synergistic effect of SUMOylation and mitochondrial regulation on HF development remains unclear, particularly at the gene level.
In this study, we systematically investigated genes at the intersection of SUMOylation and mitochondrial dysfunction in HF, two key biological processes that have been individually implicated in HF but not yet comprehensively integrated. Overlapping genes were identified by intersecting HF-related differentially expressed genes, SUMOylation-related genes, and mitochondria-related genes. Key genes were then screened using machine learning algorithms and used to construct a diagnostic model. Functional enrichment and immune infiltration analyses were further performed to explore their potential biological roles in HF. This integrated approach may provide a systematic framework for exploring the crosstalk between SUMOylation and mitochondrial dysfunction in HF.
Protocol
Loading...
$$\rightleftharpoonup{xx}$$
$$\longleftharp{xx}$$,
$$\longrightharp{xx}$$,
The study was conducted in accordance with the Declaration of Helsinki, and the protocol was approved by the Ethics Committee of the Third Hospital of Hebei Medical University (W2025-065-1) in November 2024. Informed consent was obtained from all subjects involved in the study.
Data source and preprocessing
RNA-seq data associated with HF were obtained, including two microarray datasets from the Gene Expression Omnibus (https://www.ncbi.nlm.nih.gov/geo/). Two peripheral blood microarray datasets were selected: GSE59867 (34 HF samples and 30 controls) was used as the training dataset; GSE57338 (177 HF samples and 136 controls) was used as the validation dataset. Clinical information available for GSE57338, including age, gender, and disease status, was retrieved from GEO and is summarized in Supplementary Table 1. In addition, a total of 3,893 SUMOylation-related genes (SRGs) were obtained from the dbPTM database (https://awi.cuhk.edu.cn/dbPTM/index.php) (Supplementary Table 2), while 2,030 mitochondria-related genes (MRGs) were collected based on a previous study24 (Supplementary Table 3). Next, the R package GEOquery (v 2.72.0)25 was used to download datasets from the GEO database, extract the expression matrix, and obtain the sample phenotype information. Annotation was performed by mapping the annotation file and matching the gene IDs. Invalid gene IDs were removed, and the most highly expressed probes were retained.
Key gene selection via machine learning
A multi-step approach was used to select the genes related to the HF, SUMOylation, and mitochondria. First, the common genes between the training dataset, the SRGs, and the MRGs were identified using intersection analysis. The potential function of common genes was identified by Gene Ontology (GO) and Kyoto Encyclopedia of Genes and Genomes (KEGG) enrichment analysis using the R package ClusterProfiler (v 4.12.6)26. Then, three machine learning approaches, namely LASSO regression, XGBoost, and random forest (RF), were employed to further filter the genes. In LASSO regression, the optimal regularization parameter λ was selected via cross-validation to identify the genetic features with the greatest predictive value. The non-zero coefficient genes were selected for subsequent analysis. Then, XGBoost and RF algorithms were used to calculate the feature importance scores and screen the top 20 genes.
Construction and evaluation of diagnostic models
A diagnostic model was constructed using Logistic regression based on the GSE59867 dataset. The model was then applied to predict disease status and calculate probability scores. To validate the model, the same key genes were extracted from the GSE57338 dataset, normalized to match the training dataset, and used for external prediction. Model performance was assessed using Receiver Operating Characteristic (ROC) curves, Confusion Matrix, Calibration Curve, and Decision Curve Analysis (DCA).
Gene set enrichment analysis (GSEA) and subcellular localization
Spearman correlation analysis was used to identify correlated genes for each key gene. GSEA analysis was performed using the R package ClusterProfiler (v 4.12.6) on the key genes' related genes. Meanwhile, to determine the precise subcellular localization of the key genes within the cell, their subcellular localization was determined using the GeneCards database (https://www.genecards.org/).
Gene-disease association and drug prediction
To evaluate the clinical relevance of the identified key genes, systematic disease-association and drug-interaction analyses were performed. Disease-gene associations were interrogated using the Comparative Toxicogenomics Database (CTD; https://ctdbase.org/), with results ranked by both inference scores and reference counts (top 10 associations reported). Gene-drug interaction data for key genes were obtained from the Drug-Gene Interaction database (DGIdb), and drugs were excluded based on an interaction score < 0.5. Subsequently, we downloaded the 3D structures of proteins corresponding to key genes from the PDB database (https://www.rcsb.org/) and the molecular structures of potential drugs from PubChem (https://pubchem.ncbi.nlm.nih.gov/). Next, molecular docking analysis was performed using CB-Dock227 (https://cadd.labshare.cn/cb-dock2/php/index.php) to calculate the binding scores between the potential drugs and proteins. A lower binding free energy indicates a more stable interaction, suggesting the compound may have greater targeting potential.
Immune infiltration analysis
Immune cell infiltration was assessed using three complementary methods: Microenvironment Cell Populations-counter (MCP-counter)28, cell-type identification by estimating relative subsets of RNA transcripts (CIBERSORT)29 and single-sample enrichment analysis (ssGSEA)30. MCP-counter and CIBERSORT analysis was performed using the R package IOBR (v 0.99.0)31. MCP-counter was used to estimate immune and stromal cell abundance, while CIBERSORT was used to quantify the relative proportions of 22 immune cell types. ssGSEA was performed using the GSVA package (v1.52.3)32 to evaluate sample-level enrichment of immune cell subtypes.
Construction of the competing endogenous RNA (ceRNA) regulatory network
To investigate the potential miRNA–lncRNA regulatory roles associated with previously identified key genes, a ceRNA regulatory network was constructed. The R package multiMiR (v 1.26.0)33 was used to predict potential microRNA (miRNA)–mRNA interactions for key genes, integrating data from PITA (https://omictools.com/pita-tool/) and the miRDB database (https://mirdb.org/). miRNA–mRNA pairs with high confidence and consistency were selected. Subsequently, lncRNA–miRNA interactions were retrieved from the StarBase database (https://rnasysu.com/encori/) and filtered for interactions supported by ≥ 10 CLIP-seq experiments and categorized as lincRNAs. A ceRNA network was constructed by integrating lncRNA-miRNA-mRNA interactions.
qPCR validation
To validate the expression of key genes, Blood samples from patients with HF and healthy controls were collected from the clinical cohort (n = 6 per group) at the Third Hospital of Hebei Medical University (W2025-065-1) under approved protocols and informed consent. Total RNA was isolated using the TRIzol reagent in conjunction with chloroform and isopropanol. Following extraction, RNA was dissolved in DEPC-treated water, and its concentration and purity were assessed using a NanoDrop spectrophotometer. For transcriptional analysis, RNA was reverse transcribed into cDNA using the Fast First-Strand cDNA Synthesis Mix for RT (with dsDNase). Quantitative PCR was subsequently performed using the Fast Taq qPCR SYBR Green Mix. The specific primer sequences are detailed in the Table of Materials. Relative gene expression levels were calculated using the 2-ΔΔCT method, with appropriate normalization.
Statistical analysis
All statistical analyses were performed using R software and GraphPad Prism. Statistical comparisons between two independent groups were performed using either Student's t-test or the Mann-Whitney U test, depending on the data distribution. A p-value of less than 0.05 was considered to indicate statistical significance.
Results
Loading...
$$\rightleftharpoonup{xx}$$
$$\longleftharp{xx}$$,
$$\longrightharp{xx}$$,
Identification and functional enrichment of intersecting genes
To identify genes involved in SUMOylation and mitochondrial function in HF, quality control was first performed on the training set GSE59867 (Supplementary Figure 1A). A three-way intersection analysis was conducted among all genes in the training set, SRGs, and MRGs, identifying 113 overlapping genes (Figure 1A). To explore the potential biological functions of these genes, GO and KEGG pathway enrichment analyses were performed. As shown in Figure 1B, GO enrichment revealed that these genes were mainly involved in mitochondrial autophagy regulation, mitophagy, nucleoside triphosphate metabolism, and cell cycle-related components, including spindle and mitotic spindle structures. Key molecular functions included ubiquitin protein ligase binding and transcription factor activity. KEGG pathway analysis further highlighted significant enrichment in disease- and metabolism-related pathways, including pathways of neurodegeneration, lipid and atherosclerosis, estrogen signaling, viral infections, and mitophagy (Figure 1C). Collectively, these findings suggest that the intersecting genes may play a critical role in mitochondrial metabolic imbalance and cellular stress responses.
Screening of key genes
To robustly identify key genes associated with HF pathogenesis, three machine learning (ML) approaches were employed: LASSO regression, XGBoost, and RF. Using LASSO regression, we identified 15 genes based on optimal lambda values selected via cross-validation (Figure 2A,B). XGBoost and RF models were used to assess the importance of each gene using gain values and Gini indices, respectively, each yielding 20 top-ranking features (Figure 2C,D; Supplementary Table 4). As shown in Figure 2E, seven genes-NFKB1, SQSTM1, PGR, TFAP4, MYEF2, FKBP4, and NSUN2-were obtained after integrating the results from all three ML approaches. Differential expression analysis between HF and non-HF samples further confirmed that NFKB1, SQSTM1, MYEF2, FKBP4, and NSUN2 were significantly dysregulated in HF (Figure 2F), and these were subsequently designated as the final key genes for downstream analysis. Pearson correlation analysis indicated co-expression among the five genes (Supplementary Figure 1B), suggesting coordinated roles in the molecular pathology of HF.
Construction and evaluation of diagnostic models based on logistic regression
To assess the diagnostic value of the five key genes in distinguishing HF patients from non-HF controls, a logistic regression-based model was constructed. A risk score of HF was calculated by following the final regression equation: logit(P) = 15.438 + (12.734 × expression value of FKBP4) + (-4.575 × expression value of MYEF2) + (-15.757×expression value of NFKB1) + (4.713 × expression value of SQSTM1) + (-6.214 × expression value of NSUN2). As shown in Figure 3, the model achieved an AUC of 0.913 in GSE59867 (Figure 3A). In the independent validation dataset (GSE57338), the model retained acceptable predictive power with an AUC of 0.734 (Figure 3B), suggesting moderate generalizability. To visualize the diagnostic model, a nomogram based on the five key genes was developed (Figure 3C). To further evaluate model performance, a confusion matrix analysis yielded an overall accuracy of 0.83, sensitivity of 0.77, specificity of 0.88, and F1 score of 0.81 (Figure 3D). Additionally, DCA indicated a potential clinical benefit at certain threshold probabilities (Figure 3E), supporting the model’s utility for clinical decision-making. The calibration curve also showed acceptable agreement between predicted and observed probabilities, with minimal bias (Figure 3F).
Subcellular localization of key genes and gene-disease association
As protein function is often closely linked to its spatial context within the cell, identifying the precise subcellular localization can provide preliminary clues about potential regulatory mechanisms. To investigate the potential mechanistic roles of select genes in toxicity and disease processes, we integrated subcellular localization predictions with toxicogenomic inference analysis for five key genes: FKBP4, MYEF2, NFKB1, NSUN2, and SQSTM1. Subcellular localization analysis (Figure 4A–E) revealed that these proteins were distributed across the nucleus, cytosol, mitochondria, endoplasmic reticulum, and lysosome, suggesting their potential involvement in processes such as transcriptional regulation, cellular stress response, and autophagy. Complementary radar chart analyses (Figure 4F–J) demonstrated distinct disease and toxicity associations for each gene. FKBP4 was mainly associated with chemical and drug-induced liver injury, weight loss, and memory disorders, while MYEF2 was enriched in prenatal exposure-related effects, cell transformation, and liver injury. NFKB1 and SQSTM1 were both linked to inflammation, necrosis, and hyperplasia, whereas NSUN2 was associated with poisoning, kidney disease, and fibrosis. While several of these associations are not specific to HF, they involve biological processes such as inflammation, fibrosis, and cellular stress, which are relevant to HF pathology. Taken together, these results suggest that the identified genes may be linked to cellular stress and inflammatory responses in HF.
Gene set enrichment analysis of key genes
To further explore the potential biological functions of the five key genes, we conducted GSEA. GO BP analysis revealed that these genes are significantly enriched in pathways related to nuclear regulatory functions, RNA processing, ribonucleoprotein complex biogenesis, and macromolecule methylation (Figure 5A–E). Notably, FKBP4 and NFKB1 were also associated with protein folding and sensory perception, while MYEF2, NSUN2, and SQSTM1 exhibited strong enrichment in RNA metabolic processes and ribosomal biogenesis. Furthermore, KEGG pathway enrichment analysis (Supplementary Figure 2A–E) showed that these genes are involved in key signaling pathways, including cell cycle regulation, phagosome formation, and autophagy. These findings suggest that the identified key genes may contribute to HF pathogenesis by modulating essential cellular processes, particularly those governing transcriptional regulation, immune responses, and metabolic adaptation.
Immune microenvironment in HF
To gain insights into the immunological microenvironment in HF, three complementary immune deconvolution algorithms were employed: CIBERSORT, MCPcounter, and ssGSEA. Notably, all three algorithms consistently identified significant neutrophil upregulation in HF patients (Figure 6A,C,E). To further explore the relationship between immune cell infiltration and gene expression, correlation analyses were performed. Interestingly, MYEF2 and NSUN2 expression levels showed significant negative correlations with neutrophil abundance, whereas SQSTM1 showed a positive association (Figure 6B,D,F). These findings suggest that key genes may differentially regulate immunoinflammatory responses in HF, potentially by modulating neutrophil-mediated pathways.
Drug-gene interaction prediction and construction of the ceRNA regulatory network
To identify potential therapeutic drugs targeting the key genes, drug-gene interactions were first explored for the five key genes using the DGIdb database. Three genes-SQSTM1, NFKB1, and FKBP4-were found to interact with a total of six candidate compounds (Figure 7A). Among these, IMX-942 showed the highest interaction score with SQSTM1. For the other targets, no crystal structure has been identified, so SQSTM1 and IMX-942 were selected for molecular docking validation. As shown in Figure 7B, the docking simulation revealed a binding energy of -5.8 kcal/mol, indicating a strong binding affinity between IMX-942 and the SQSTM1-encoded protein. These drug prediction results suggest a novel therapeutic approach for HF treatment. In addition, an exploratory ceRNA network analysis was performed to identify potential post-transcriptional regulatory relationships among HF-related genes. A total of 140 and 180 potential miRNAs were predicted using the PITA and miRDB databases, respectively, with 24 miRNAs identified in both datasets (Figure 7C). Further analysis identified six lncRNAs potentially interacting with 16 of these miRNAs. By integrating miRNA–mRNA and lncRNA–miRNA interactions, a putative ceRNA network was constructed (Figure 7D). However, these interactions are based on computational prediction and require further experimental validation.
Validation of key gene expression
To substantiate the reliability of the computational findings, RT-qPCR was employed to quantify the expression profiles of the five key genes in a clinical cohort. As illustrated in Figures 8A–E, all candidate markers exhibited statistically significant differential expression between the HF and control groups (p < 0.05). Specifically, the transcriptional abundance of MYEF2 (p = 0.0043), NFKB1 (p = 0.0452), and NSUN2 (p = 0.0022) was markedly downregulated in HF samples, whereas FKBP4 (p = 0.0260) and SQSTM1 (p = 0.0157) demonstrated significant upregulation. These experimental trajectories are highly concordant with the in-silico predictions, thereby supporting the bioinformatics-based identification of these key genes.
To evaluate the potential influence of demographic factors, associations between age, sex, and the expression of the five candidate biomarkers in GSE57338 were further analyzed. Most genes exhibited weak or non-significant correlations with age, and only SQSTM1 showed a significant sex-related difference, suggesting that the identified candidate biomarkers were not substantially affected by demographic factors (Supplementary Figure 3A,B).
Data Availability:
The public datasets analyzed in this study are available from the Gene Expression Omnibus (GEO) database under accession numbers GSE59867 and GSE57338. All data generated during this study, including qPCR validation data, source data underlying the figures, and associated analysis files, have been deposited in the Zenodo repository and are publicly available at DOI: 10.5281/zenodo.20552009 (https://zenodo.org/records/20552009).
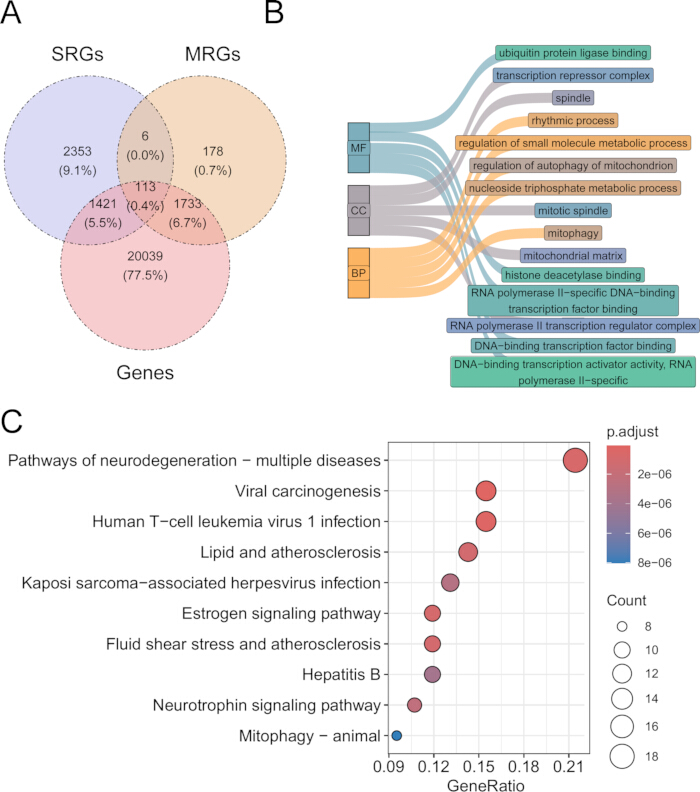
Figure 1: Identification of intersecting genes. (A) Venn diagram of intersecting genes from the training set, SRGs, and MRGs. (B) GO enrichment analysis showing significant terms in Molecular Function (MF), Biological Process (BP), and Cellular Component (CC) categories. (C) KEGG pathway enrichment analysis of intersecting genes. Please click here to view a larger version of this figure.
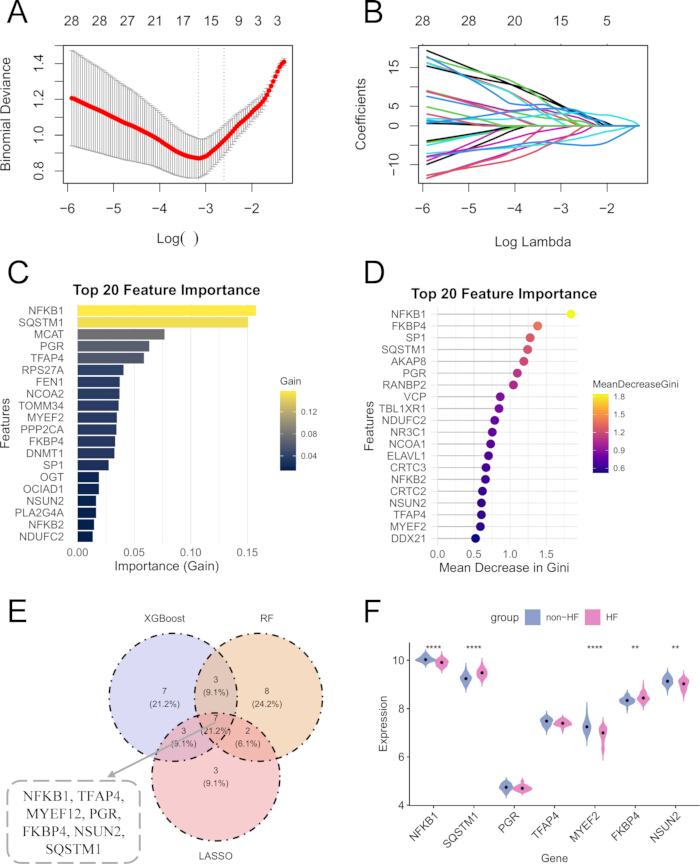
Figure 2: Screening of key genes. (A) Cross-validation curve of LASSO model. (B) Coefficient profile of genes in LASSO regression. (C) Top 20 features ranked by gain value in XGBoost. (D) Top 20 features ranked by mean Gini importance in RF. (E) Venn diagram showing overlapping genes identified by all three models. (F) Violin plots of gene expression levels in HF and control groups. * = p < 0.05, ** = p < 0.01, *** = p < 0.001, **** = p < 0.0001. Please click here to view a larger version of this figure.
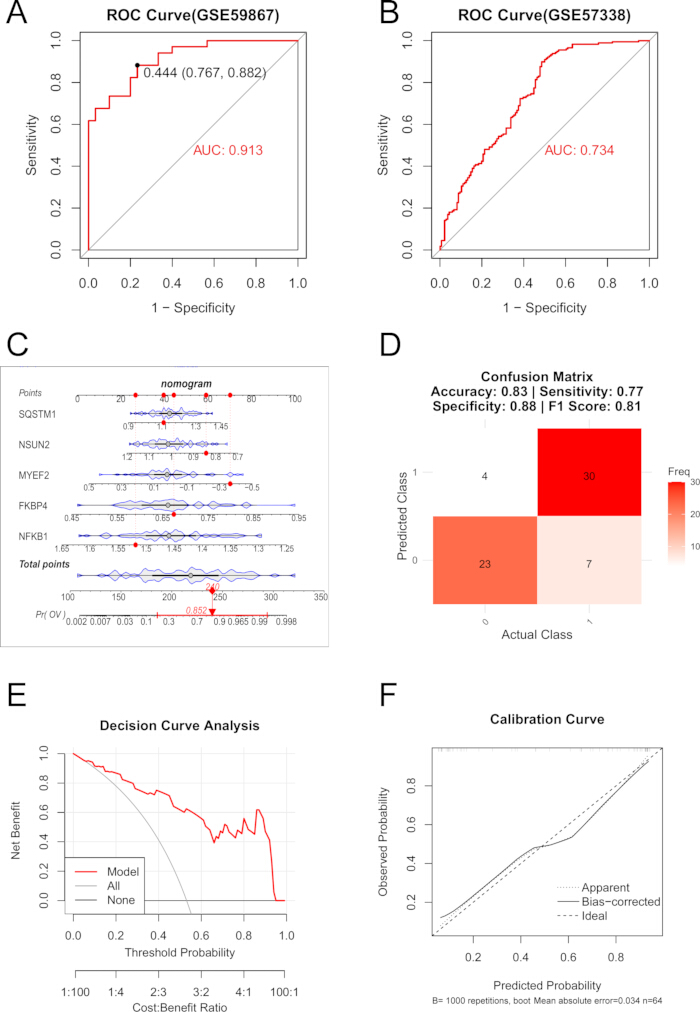
Figure 3: Construction and validation of a logistic regression-based diagnostic model for HF. (A,B) ROC curves showing model performance in the (A) training set (GSE59867) and (B) validation set (GSE57338). (C) Nomogram incorporating five key genes for individual HF risk prediction. (D) A confusion matrix illustrates classification performance. (E) Decision curve analysis (DCA) comparing net clinical benefit. (F) Calibration curve indicating consistency between predicted and actual outcomes. Please click here to view a larger version of this figure.
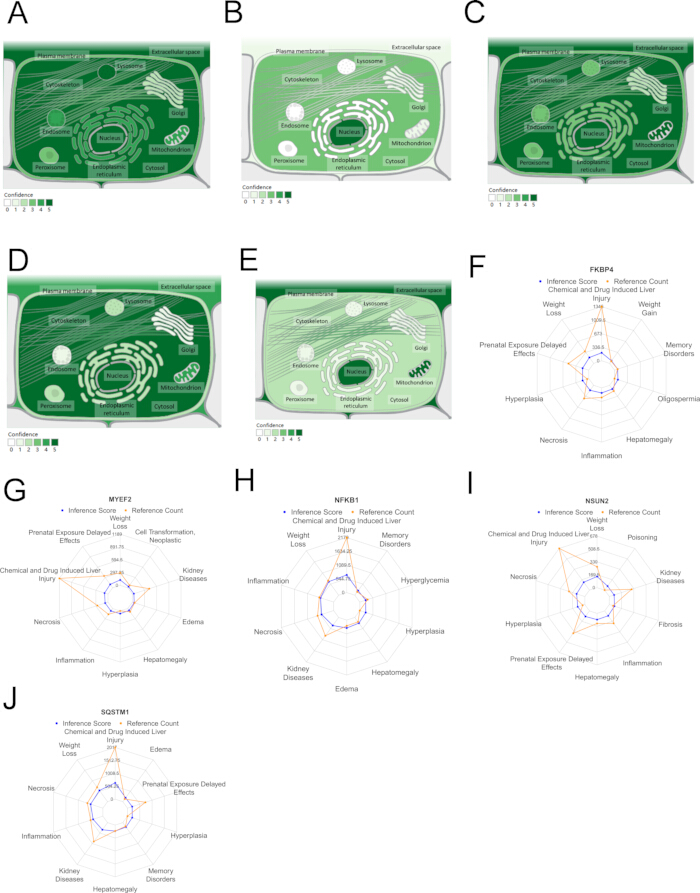
Figure 4: Subcellular localization of key genes and gene-disease association. (A–E) Subcellular localization diagrams of (A) SQSTM1, (B) MYEF2, (C) NFKB1, (D) FKBP4, and (E) NSUN2. (F–J) Radar charts for gene-associated effects of (F) FKBP4, (G) MYEF2, (H) NFKB1, (I) NSUN2, and (J) SQSTM1. Please click here to view a larger version of this figure.
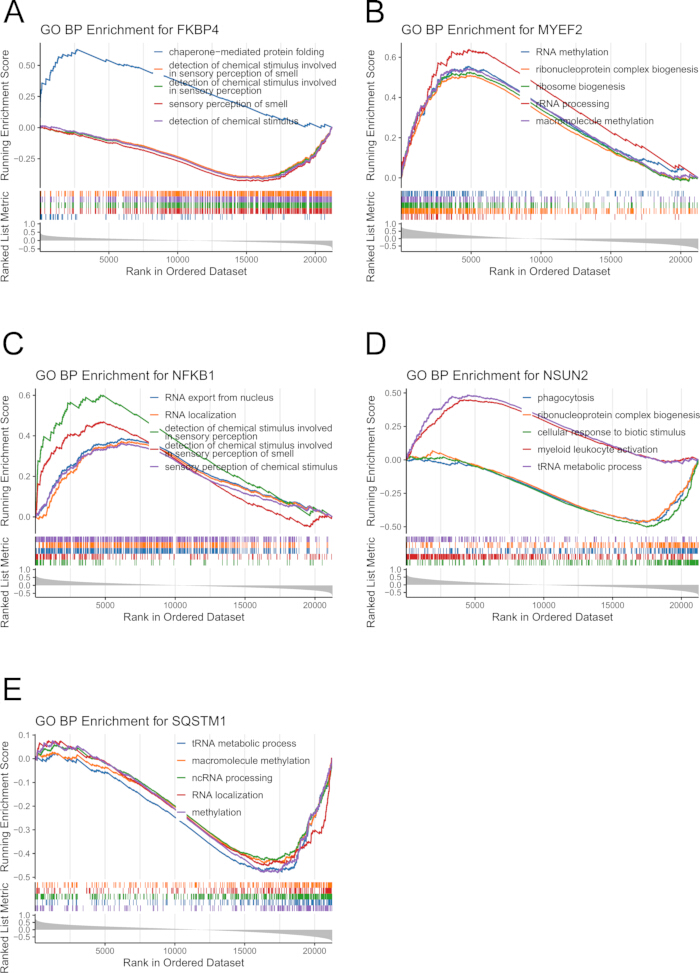
Figure 5: GO biological process enrichment analysis of key genes. (A–E) GSEA results for (A) FKBP4, (B) MYEF2, (C) NFKB1, (D) NSUN2, and (E) SQSTM1 in terms of enriched GO biological processes (BP). Please click here to view a larger version of this figure.
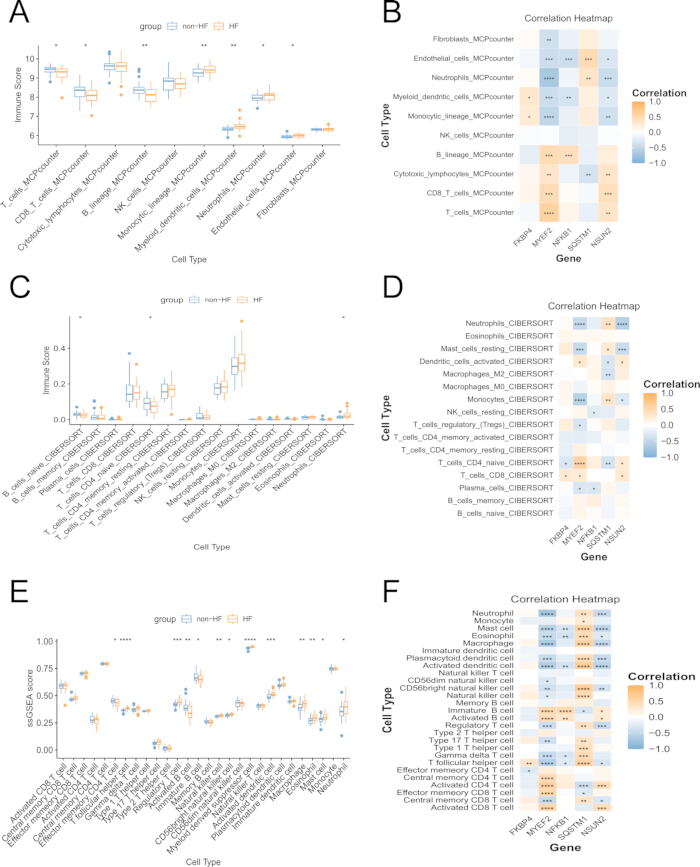
Figure 6: Immune microenvironment in HF. (A) Differences in 22 immune cell types between HF and non-HF groups were analyzed using CIBERSORT. (B) Correlation between key gene expression and immune cell infiltration derived from CIBERSORT. (C) Differences in 8 immune cell types analyzed by MCPcounter. (D) Correlation between gene expression and MCP counter-estimated immune infiltration. (E) Differences in 28 immune cell types analyzed by ssGSEA. (F) Correlation between key gene expression and immune infiltration derived from ssGSEA. * = p < 0.05, ** = p < 0.01, *** = p < 0.001, **** = p < 0.0001. Please click here to view a larger version of this figure.
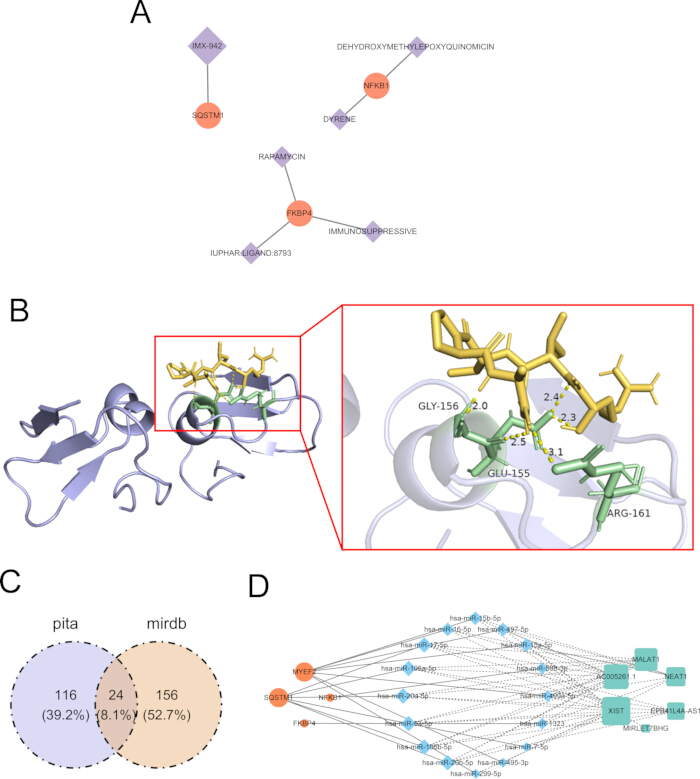
Figure 7: Drug-gene interaction prediction and ceRNA regulatory network construction. (A) Network of predicted drug-gene interactions. Orange nodes represent key genes; purple diamonds represent candidate drugs. (B) Molecular docking results showing the binding interface between IMX-942 and the SQSTM1-encoded protein. The enlarged panel shows key hydrogen bond interactions and binding residues. (C) Venn diagram of miRNA prediction from PITA and miRDB databases. (D) ceRNA regulatory network for HF. Orange circles represent mRNAs, blue circles represent miRNAs, and green squares represent lncRNAs. Solid lines indicate miRNA-mRNA regulation; dotted lines represent lncRNA-miRNA interactions. Please click here to view a larger version of this figure.
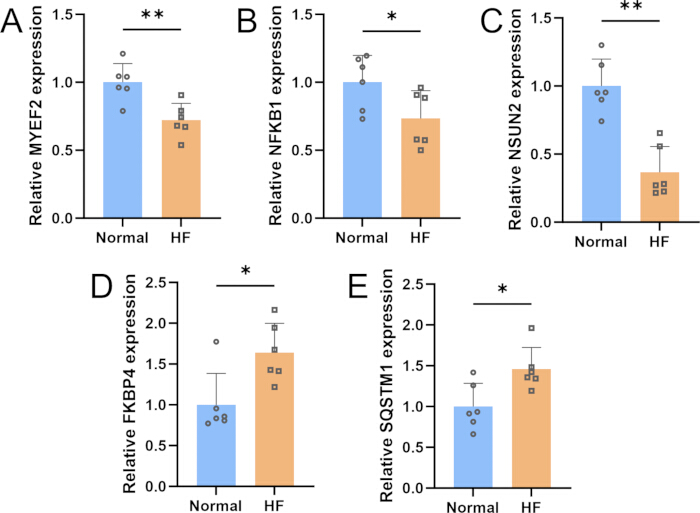
Figure 8: qPCR validation in clinical samples. Bar charts showing the mRNA expression levels of (A) MYEF2, (B) NFKB1, (C) NSUN2, (D) FKBP4, and (E) SQSTM1. Error bars represent SD. * = p < 0.05, ** = p < 0.01. Please click here to view a larger version of this figure.
Supplementary Figure 1: (A) Normalization of the GSE59867 dataset. The left represents before normalization, and the right represents after normalization. (B) Heatmap of gene correlation. Please click here to download this file.
Supplementary Figure 2: Gene set enrichment analysis of the key genes. KEGG of (A) FKBP4, (B) MYEF2, (C) NFKB1, (D) NSUN2, and (E) SQSTM1.Please click here to download this file.
Supplementary Figure 3. Associations between demographic factors and key genes expression in GSE57338. (A) Correlation between age and expression of the five key genes. (B) Comparison of gene expression between male and female subjects.Please click here to download this file.
Supplementary Table 1. Clinical characteristics of samples in GSE57338.Please click here to download this file.
Supplementary Table 2. List of SRGs. Please click here to download this file.
Supplementary Table 3. List of MRGs. Please click here to download this file.
Supplementary Table 4. Screening genes of three algorithms.Please click here to download this file.
Discussion
Loading...
$$\rightleftharpoonup{xx}$$
$$\longleftharp{xx}$$,
$$\longrightharp{xx}$$,
HF, a progressive and terminal stage of various cardiovascular diseases, is characterized by highly complex and multifactorial pathophysiological mechanisms17,34. Although both SUMOylation and mitochondrial dysfunction have been individually implicated in HF, their potential synergistic roles remain insufficiently explored, particularly at the gene level. In the present study, we identified five key genes—NFKB1, MYEF2, NSUN2, SQSTM1, and FKBP4—and established a diagnostic model for HF using multiple machine learning approaches. We further elucidated their potential biological functions through bioinformatics analyses.
Leveraging the predictive power of machine learning in clinical diagnostics, we employed LASSO regression, XGBoost, and RF algorithms to comprehensively screen for common genes among SUMOylation-related and mitochondria-related genes, as well as five key genes, namely NFKB1, MYEF2, NSUN2, SQSTM1, and FKBP4. Biological function analysis revealed that the five genes are linked to immunomodulation, transcriptional regulation, and cellular stress responses. Among these, NFKB1, a critical member of the nuclear factor kappa B (NF-κB) family, plays an essential role in mediating immune and inflammatory signaling35,36. A previous study suggests that impaired NFKB1 signaling may contribute to HF pathogenesis through dysregulated immune responses37,38. NSUN2, a well-characterized RNA methyltransferase, regulates post-transcriptional gene regulation through RNA methylation modifications and has been implicated in cardiac stress responses39,40. Notably, a recent study revealed that NSUN2 knockout in mice not only attenuated the stress-induced hypertrophy but also accelerated HF progression41,42. SQSTM1, a multifunctional scaffold protein, is essential for selective autophagy and cellular signaling integration43,44. FKBP4, an immunophilin with peptidyl-prolyl isomerase activity, is involved in protein folding and transcriptional regulation, and may play a role in cardiac apoptosis signaling45. Furthermore, MYEF2, though primarily studied in neurogenesis and myogenic differentiation, has recently emerged as a potential RNA-binding regulator46. Collectively, these genes may represent key molecular links between SUMOylation and mitochondrial-related stress responses in HF progression.
Compared with previously reported HF biomarkers, which mainly focus on inflammatory mediators47, neurohormonal factors48, or metabolism-related genes49, the five key genes identified in this study offer a different perspective by linking SUMOylation-related processes to mitochondrial dysfunction. This suggests that they may reflect a broader regulatory network underlying HF pathogenesis. However, given the heterogeneity of existing biomarker studies and differences in datasets and analytical strategies, further validation in independent cohorts is required to evaluate their robustness and clinical applicability.
GSEA indicated significant enrichment of immune-related processes, RNA metabolism, and cell cycle pathways among the five key genes. Immune cell infiltration analysis further demonstrated significant correlations between neutrophil abundance and key gene expression patterns. Neutrophils, frontline effectors of innate immunity, have a dual role in HF50,51. In the initial stage of myocardial infarction, neutrophils rapidly migrate to ischemic myocardium, initiating the inflammatory response and facilitating debris clearance52. However, excessive or prolonged neutrophil activation leads to excessive release of reactive oxygen species (ROS), proteases, and proinflammatory mediators. This, in turn, exacerbates myocardial injury, impairs tissue repair, and contributes to HF progression52,53.
Through comprehensive drug prediction and molecular docking analysis, we identified IMX-942, a synthetic immunomodulatory peptide derived from IDR-1, as a potential drug targeting SQSTM154 , supported by good molecular docking affinity. While this compound has not been specifically studied in cardiovascular contexts, it has shown promising therapeutic effects in various disease models by regulating immune homeostasis and ameliorating pathological states55. Notably, SQSTM1 is a multifunctional scaffold protein involved in selective autophagy, inflammatory signaling, and cellular stress responses56,57. Given the recognized roles of inflammation and dysregulated autophagy in HF, and the immunomodulatory properties of IMX-942, the predicted interaction between IMX-942 and SQSTM1 may suggest a link between immune regulation and SQSTM1-mediated cellular homeostasis. Therefore, these findings provide preliminary clues for further exploration of immune-related therapeutic targets in HF.
While this study provides valuable insights, certain limitations must be acknowledged. The relatively modest sample size in our dataset may affect the statistical power and generalizability of the findings, necessitating validation in larger, independent cohorts. Furthermore, although qPCR confirmed the expression trends of identified key genes in clinical samples, the sample size of six pairs limits the reliability of these results. In addition, detailed demographic and clinical information was not consistently available across all public datasets used in this study. Although exploratory analyses in the validation cohort suggested limited effects of age and sex on most candidate biomarkers, age-, sex-, and etiology-adjusted analyses could not be performed comprehensively because such information was unavailable in the training dataset. Moreover, the association between the identified genes and SUMOylation is based on bioinformatics intersection analysis rather than direct experimental evidence of SUMOylation-mediated regulation. Future investigations should incorporate both expanded clinical validation and complementary experimental approaches, including in vitro and in vivo studies, to better bridge the gap between computational predictions and biological reality.
In conclusion, this study provides a preliminary identification of candidate biomarkers associated with SUMOylation and mitochondrial dysfunction in HF using integrated bioinformatics and machine learning. These findings may offer new insights into the molecular mechanisms of HF and serve as a basis for further experimental validation.
Disclosures
Loading...
$$\rightleftharpoonup{xx}$$
$$\longleftharp{xx}$$,
$$\longrightharp{xx}$$,
This work was supported by the Medical Science Research Project of Hebei (Grant number: 20250084).
Acknowledgements
Loading...
$$\rightleftharpoonup{xx}$$
$$\longleftharp{xx}$$,
$$\longrightharp{xx}$$,
The Authors have no conflicts of interest to declare.
Materials
| Name | Company | Catalog Number | Comments |
|---|---|---|---|
| Chloroform substitute | Servicebio | G3014-02 | qPCR reagent |
| DEPC-treated water | Biosharp | BL510A | qPCR reagent |
| Fast First-Strand cDNA Synthesis Mix for RT (with dsDNase) | Albatross Biology | 500-101 | qPCR reagent |
| Fast Taq qPCR SYBR Green Mix | Albatross Biology | 500-102 | qPCR reagent |
| FKBP4 primers | Tsingke | N/A | Forward: 5’-GAAGGCGTGCTGAAGGTCAT-3’ Reverse: 5’-TGCCATCTAATAGCCAGCCAG-3’ |
| Isopropanol | Hushi | 80109218 | qPCR reagent |
| MYEF2 primers | Tsingke | N/A | Forward: 5’-CAGCTCCAATGGCGTTAAAATG-3’ Reverse: 5’-TGGCCTTCTTACTTCCTGTAGAT-3’ |
| NanoDrop spectrophotometer | Thermo Fisher Scientific | NanoDrop 2000C | qPCR reagent |
| NFKB1 primers | Tsingke | N/A | Forward: 5’-AACAGAGAGGATTTCGTTTCCG-3’ Reverse: 5’-TTTGACCTGAGGGTAAGACTTCT-3’ |
| NSUN2 primers | Tsingke | N/A | Forward: 5’-GAACTTGCCTGGCACACAAAT-3’ Reverse: 5’-TGCTAACAGCTTCTTGACGACTA-3’ |
| SQSTM1 primers | Tsingke | N/A | Forward: 5’-GCACCCCAATGTGATCTGC-3’ Reverse: 5’-CGCTACACAAGTCGTAGTCTGG-3’ |
| TRIzol reagent | Vazyme | R401-01 | qPCR reagent |
| β-actin primers | Tsingke | N/A | Forward: 5’-CATGTACGTTGCTATCCAGGC-3’ Reverse: 5’-CTCCTTAATGTCACGCACGAT-3’ |
Reprints and Permissions
Request permission to reuse the text or figures of this JoVE article
Request Permission