This review systematically compares the main experimental techniques used to assess the effects of land-use and land-cover changes and urbanization on water stress in West African watersheds, quantifying how often each technique is applied, which performance metrics are reported, and how the evidence is distributed across countries.
Review Article
Assessing Land Use, Land Cover Changes, and Urbanization Impacts on Water Stress in West African Watersheds: A Systematic Methodological Review
In This Article
Summary
Abstract
Water stress is one of the major environmental and socio-economic constraints in West Africa, where population growth, agricultural expansion, soil sealing, hydroclimatic variability, and rising pressure on surface water and groundwater rapidly transform watershed functioning. Evaluating the impacts of land use and land cover (LULC) changes and urbanization requires methodological approaches that link the spatial dynamics of landscapes to observed or simulated hydrological responses. This review provides a comparative and critical analysis of the main techniques used in the region: instrumented watersheds and in situ observations, controlled field and laboratory experiments, satellite remote sensing and multi-temporal analysis, groundwater-oriented methods, conceptual, semi-distributed, physically based, and integrated surface-subsurface hydrological modeling, statistical and machine-learning approaches, and hybrid methods coupling land-use and climate scenarios. The search and selection process followed a transparent, PRISMA-based protocol and yielded 51 included records, of which 35 are anchored in West Africa. Hydrological modeling driven by remote sensing dominates the corpus, accounting for 15 of the 35 West African records (43%), particularly with SWAT, ACRU, WaSiM, CEQUEAU, SHETRAN, HydroGeoSphere, and ParFlow-CLM; reported Nash-Sutcliffe efficiency (NSE), Kling-Gupta efficiency (KGE), and coefficient of determination generally range from about 0.6 to 0.9, which is satisfactory to very good against standard evaluation guidelines. Statistical and machine-learning studies account for 8 of 35 records, whereas urban- and groundwater-focused studies remain scarce. Moreover, 8 of 35 records originate from a single research network, so several regional conclusions rest on a narrow and partly non-independent evidence base. In situ networks remain essential for process understanding but are constrained by cost and low density; purely satellite-based approaches suffer from cloud cover and spectral confusion in subhumid zones. The most promising advances lie in multi-source, multi-scale frameworks combining targeted instrumentation, satellite time series, integrated hydrological modeling, territorial scenarios, systematic uncertainty analyses, and co-construction with water-management and planning actors.
Introduction
West Africa is experiencing increasing pressure on its water resources due to the combined effects of climate variability, population growth, agricultural expansion, accelerated urbanization, and ecosystem degradation. Regional water diagnostics highlight a decline in per capita water availability, intensifying competition between uses, and growing sensitivity to droughts, floods, and hydroclimatic extremes1,2. In the Sahel and Sudanian zones, hydrological trajectories observed over recent decades have often been paradoxical: in several basins, runoff and floods have increased even though annual rainfall has not risen at the same pace, which has renewed interest in the role of land-use change and surface-state transformations3,4. Recent work also reports a simultaneous rise in temperature and in the number of dry days in the transboundary Benue Basin, reinforcing hydroclimatic pressure on West African catchments5. In Niamey, the evolution of extreme rainfall under the combined effects of climate change and rapid population growth has further increased the vulnerability of the most flood-exposed neighborhoods6.
The term water stress is used here in a broad sense, encompassing deficits in surface- and groundwater availability, declining soil moisture available to vegetation and agriculture, increased rapid runoff at the expense of recharge, greater streamflow irregularity, and tensions in access to and sharing of water at watershed scales. This operational definition is particularly suited to West Africa, where vulnerability is linked not only to mean annual volumes but also to the strong seasonality of rainfall, the discontinuous nature of monitoring networks, the prevalence of agro-pastoral economies, and the rapid growth of urban peripheries2,3. A complementary perspective also stresses the intensity and flexibility of water uses, which vary considerably between irrigation, domestic uses, reservoir storage, and energy production7. Urban water supply and the water security of large coastal and Sahelian metropolises are therefore becoming an increasingly structural concern for territorial planning.
Land use and land cover (LULC) change affects hydrological processes through several mechanisms: removal or degradation of vegetation cover, expansion of cultivated land, soil compaction, surface crusting, development of impervious surfaces, modification of artificial drainage, fragmentation of wetlands, and disruption of surface-groundwater exchanges3,4,8,9. In urban contexts, the increase of built-up areas and roads accelerates runoff concentration, accentuates flood peaks, and modifies infiltration; in rural contexts, cropland expansion and deforestation may increase runoff, erosion, and siltation while reducing evapotranspiration or recharge depending on soils and topography3,4. A rigorous assessment of these effects cannot rely on a single family of tools: West African studies mobilize in situ observations, experimental basins, remote sensing, lumped rainfall-runoff models, distributed and integrated surface-subsurface models, satellite gravimetry and isotopic tracers for groundwater, and increasingly statistical and machine-learning methods.
Yet few syntheses explicitly compare these approaches in the West African context with a focus on their capacity to diagnose water stress induced by LULC change and urbanization, and existing regional reviews rarely report a reproducible search protocol or a quantitative description of the evidence they summarize10,11,12. The present review therefore pursues five complementary objectives: (i) identify, through a transparent PRISMA-based protocol13, the main experimental techniques used to assess the effects of LULC change and urbanization on water stress in West African watersheds; (ii) compare their principles, reported performance, data requirements and limitations, using quantitative indicators (Nash-Sutcliffe efficiency(NSE); Kling-Gupta efficiency (KGE); coefficient of determination, R2; overall classification accuracy; Cohen’s kappa); (iii) quantify the distribution of the evidence base by country, period, methodological family and research group, and state how many independent groups support each regional conclusion; (iv) discuss the relevance of each family with respect to spatial and temporal scales and to data scarcity; and (v) propose an operational decision framework and methodological orientations for future research and decision-support. The review is organized around eight methodological families, followed by a multi-criteria comparative analysis, a decision framework, and a discussion of challenges, opportunities, and research priorities.
Review and Perspective
Review methodology: search protocol, eligibility, and screening
A systematic, PRISMA-based protocol governed identification, screening, and selection13. Searches covered Scopus, Web of Science Core Collection, ScienceDirect, Wiley Online Library, MDPI, and Google Scholar (first 200 relevance-ranked hits), the repositories HAL, IRD/Horizon, WASCAL, and FAO/AQUASTAT, and regional university archives, in French and English; reference lists of included records were screened backward. Two Boolean strings were applied, one thematic and one method-oriented; both appear in full, with their platform-specific adaptations and per-source yields, in Table 1. Coverage ran from 1979 to 2026, with the initial search conducted on 12 January 2026 and the final update on 17 April 2026.
Records were eligible only if they met all four criteria: a West African watershed, or a method explicitly transferable to data-scarce West African conditions; explicit rather than incidental treatment of LULC change or urbanization; a reproducibly described method, including data sources, model, and calibration strategy; and peer-reviewed or traceable grey-literature status. Records were excluded when purely conceptual, restricted to water quality or ecology, outside the region, without transferable methodological content, or unavailable in full text. Titles and abstracts were screened independently by two authors, with a third resolving disagreements. Extraction covered catchment and country, area, period, methodological family, model or algorithm, input data, calibration and validation variables, reported metrics, hydrological changes, and treatment of uncertainty. Stage-by-stage counts appear in Figure 1 and the extracted evidence in Table 2. Studies were grouped into eight analytical categories, each assigned to the family that made the main contribution, with secondary families recorded separately so that no contribution was lost.
Quantitative characteristics of the evidence base
The corpus comprises 51 records, of which 35 are anchored in West Africa, and 16 are methodological or comparative references from other regions. Among the 35, the geographical distribution is uneven: Benin 8 records (23%), Burkina Faso and Niger 5 each (14% each), Senegal 3 (9%), Ghana and Côte d’Ivoire 2 each (6% each), the transboundary Mono and Benue basins 1 each (3% each), and 8 regional studies (23%) without a national anchor. Mali, Guinea, Sierra Leone, Liberia, Togo, and The Gambia contribute no dedicated catchment study. Publication is recent: 2 records predate 2010, 9 fall between 2010 and 2019, and 24 (69%) date from 2020 onwards (Table 3).
The distribution by methodological family, reported in Table 4, is equally uneven: statistics and machine learning 8 of 35 (23%), conceptual and semi-distributed modeling 7 (20%), distributed and integrated modeling 5 (14%), in situ observation 3 (9%), remote sensing as a primary approach 3 (9%), hybrid scenario chains 3 (9%), regional syntheses 3 (9%), and groundwater-oriented methods 2 (6%). Counting secondary contributions as well, remote sensing intervenes in 20 records (57%) and hydrological modeling in 15 (43%), the pairing that forms the methodological backbone of the field.
Two features condition how firmly regional conclusions can be stated. Controlled experimentation is almost absent as a primary approach, with 1 record built on plot-scale measurement15, so hydrodynamic parameters in distributed models are largely transferred rather than measured locally. The corpus is also not fully independent: 8 records (23%) originate from a single network centered on the University of Bonn and the WASCAL program16,17,18,19,20,21,22,23, so convergence between them partly reflects shared data, model chains, and parameterization rather than independent replication.
Applied to the main claims, the finding that cropland expansion and cover degradation increase surface runoff and water yield while reducing evapotranspiration or groundwater contribution is supported by 6 studies18,20,24,25,26,27 across 4 countries and 4 catchment systems, but only 3 mutually independent groups. The increase in Sahelian runoff associated with surface-state degradation is supported by 3 independent groups3,4,15. The claim that urbanization specifically drives water-stress change rests on 3 records6,28,29 from 3 groups, all concentrated in Niamey, and is therefore reported here as plausible but weakly replicated.
In situ observations and instrumented watersheds
Direct observation remains the most robust basis for linking landscape transformation to water stress. Long Sahelian series demonstrated the role of surface states, soil degradation, and expanding bare soil in the rapid runoff observed in several basins3,4. Pioneering measurements on Niamey urban catchments in the 1960s and late 1970s documented runoff coefficients reaching several tens of percent and response times of about an hour, linked to imperviousness, road networks, and drainage organization28. In rural and agro-pastoral basins, instrumentation mainly calibrates and validates models. Dano, Couffo, Ouémé, White Volta, and Bonsa supply rainfall, temperature, soil-moisture, streamflow, and occasionally groundwater data for water balances, recharge, and runoff16,24,25,26,30, and joint analysis of rainfall and streamflow in northern Benin separates interannual variability from longer-term trends23. Where gauges are sparse, multi-objective validation of the Soil and Water Assessment Tool (SWAT) against remotely sensed evapotranspiration, soil moisture, and GRACE-derived storage consolidates water-balance estimates and reduces equifinality21.
In situ data capture processes rather than proxies, resolving event responses, thresholds, seasonality, and lags between rainfall, runoff, and recharge. Their limits are low network density, protocol heterogeneity, interrupted series, maintenance cost, and difficult extrapolation to larger or transboundary systems. Only 3 of the 35 West African records (9%) rest primarily on in situ measurement, a narrow base for the family on which every other depends for validation.
Controlled field and laboratory experiments
Controlled experiments are less prominent than modeling but essential for understanding mechanisms. They include infiltration tests, bulk density and structural stability measurements, saturated hydraulic conductivity, runoff plots, and comparative observations across cultivated plots, fallow, savanna, bare soil, and urbanized surfaces; in the Sahel, they explain runoff increases through crusting, loss of herbaceous cover, and flow concentration3,4. Nested plot-to-catchment measurements in a small semi-arid Burkinabè catchment show runoff coefficients decreasing systematically as measurement scale increases, quantifying the scale dependence that limits the transfer of plot results to watershed models 15. In urban hydrology, West African studies remain descriptive rather than experimental, relying on episodic event-based instrumentation rather than continuous monitoring, which weakens the attribution of urbanization-specific impacts9,28. Experience from continuously monitored developing catchments elsewhere shows how much attribution improves when pre- and post-development monitoring is designed from the outset31. Such experiments isolate processes and allow realistic parameterization, but remain site-dependent and are most useful combined with continuous monitoring and modeling.
Satellite remote sensing and multi-temporal land-cover analysis
Remote sensing is the most common entry point for analyzing LULC change, intervening in 20 of the 35 West African records (57%). Landsat dominates for its temporal depth and free access; Sentinel-2 improves class discrimination, and Sentinel-1 radar, MODIS, ALOS, derived digital elevation models (DEMs), and drones complement it8,22,32. Processing chains combine atmospheric correction, seasonal compositing, spectral indices, supervised classification, accuracy assessment, and change-transition analysis33, with random forest, support vector machines, and deep networks replacing maximum-likelihood classifiers. In the Senegal Basin, Landsat with random forest and a multilayer perceptron-Markov model projected future land use in the Bafing and Falémé watersheds32; in the Ouémé, the Land Change Modeler quantified conversion toward cropland and settlements22. Cloud platforms accelerate time-series processing8,12.
A second generation of operational products is directly usable as a hydrological constraint yet remains under-exploited regionally. The FAO WaPOR portal delivers actual evapotranspiration across Africa every ten days at 250, 100, and 30 m; continental validation against fourteen eddy-covariance stations reported an overall R2 of 0.61 and a root-mean-square error of 1.04 mm d-1 34. Soil-moisture products such as SMAP and the ESA Climate Change Initiative record, and rainfall products such as CHIRPS, TAMSAT, and IMERG, supply the complementary variables needed for multi-variable validation35,36. Only 1 of the 35 records uses a satellite evapotranspiration product as a calibration constraint21, the clearest under-exploited opportunity identified here.
Known limitations include wet-season cloud cover in Guinean and subhumid zones, spectral confusion among fallow, degraded savannas, and crops, and the small footprint of secondary urban areas. Reporting is uneven: overall accuracies of 80–90% and Cohen’s kappa of about 0.75–0.90 are typical of the regional studies included here, but the corpus also contains change-detection analyses reporting no accuracy assessment, and per-class accuracies for built-up and bare soil, which matter most for urban water stress, are rarely disaggregated. These uncertainties propagate into runoff, evapotranspiration, and recharge estimates, which is why validation of gridded rainfall products is a critical regional step35,36,37.
Groundwater-oriented methods: gravimetry, tracers, and recharge mapping
Groundwater supports most rural and peri-urban supply in West Africa, yet it is the least represented compartment: only 2 of the 35 records take it as their primary object, and calibration on streamflow alone remains the norm. Three families of methods address this gap. Satellite gravimetry comes first. The Gravity Recovery and Climate Experiment (GRACE) and its follow-on mission provide monthly anomalies of total terrestrial water storage at roughly 300 km resolution, from which groundwater anomalies are isolated by removing modeled soil-moisture and surface-water components. Applied to the aquifers of southern Niger, this yielded storage-change and recharge estimates where piezometric records are sparse38; used inversely, the same signal constrains internal water-balance components that streamflow cannot identify21. The footprint-to-catchment mismatch restricts the method to large basins unless downscaling is applied.
Environmental tracers form the second family: stable isotopes, chloride mass balance, and where available tritium or radiocarbon distinguish diffuse recharge through the soil profile from focused recharge through ponds, inland valleys, and urban depressions, a distinction central to the Sahelian paradox and to assessing whether urbanization raises or lowers net recharge; integrated isotopic, remote-sensing, and modeling designs in semi-arid coastal aquifers are directly transferable to the region39. Third, recharge mapping combining remote sensing with geographic information systems is the least data-demanding option, but yields relative potential rather than volumetric recharge and requires validation against borehole yields12. Integrated surface-subsurface models simulate recharge explicitly, at much higher cost27,29.
Conceptual and semi-distributed hydrological modeling
Hydrological modeling is the most widespread route from land-use dynamics to measurable hydrological response, accounting for 15 of the 35 records (43%) when all model families are pooled. Conceptual and semi-distributed models such as UHP, SWAT, and the Agricultural Catchments Research Unit model (ACRU) balance process description, calibration feasibility, and data requirements, and allow land-use and climate scenarios to be tested16,18,20,24,25,26,30,40. Performance is reported as given by the sources and interpreted against standard guidelines, for which a monthly Nash-Sutcliffe efficiency (NSE) above 0.50 is satisfactory, above 0.65 good, and above 0.75 very good, with a percent bias within ±25% for streamflow14. Cornelissen et al. showed on a tropical Beninese basin that model choice is itself a major source of uncertainty, and that good historical performance does not guarantee robust prospective simulation16.
Case studies quantify the changes concerned. SWAT showed that reduced natural cover in the White Volta lowered surface water and baseflow while raising evapotranspiration24. ACRU in the Bonsa catchment associated a forest loss of about 39% with a streamflow increase of up to 37%25. In the Couffo between 2000 and 2011, cropland increased by 34% while savanna, agroforestry, and forest declined by 24–60%, surface water rose by 11 mm, and groundwater contribution and evapotranspiration fell by 3.2 and 10.6 mm26. Coupling a land-use model with the Water Balance Simulation Model (WaSiM) in Burkinabè inland valleys returned a climate-model spread of -44% to +95% in total runoff, wider than the land-use signal itself20. Their strength is numerical experimentation, impossible at the watershed scale. Their weakness is structural: hydrological-unit representation, parameter regionalization, DEM and soil-data quality, and calibration equifinality17,30. Scarce groundwater and soil-moisture observations frequently force calibration on streamflow alone, and of the modeling studies compiled in Table 2, only a minority calibrate against more than one variable.
Distributed, physically based, and integrated surface-subsurface modeling
Where the aim extends beyond streamflow to the coupled behavior of infiltration, soil moisture, water table, runoff, and lateral fluxes, physically based and integrated models become relevant20,27,29. In Dano, WaSiM was calibrated and validated jointly on discharge, soil moisture, and groundwater level, with R2, NSE, and Kling-Gupta efficiency (KGE) between 0.6 and 0.9 across all three variables, one of the few genuinely multi-variable validations available for the region18; SHETRAN on the same catchment reached 0.66 to 0.79 on discharge alone19. High-resolution HydroGeoSphere applied to a semi-arid urban watershed in Niamey treated surface and subsurface flow as fully coupled and showed that increased climate-model resolution did not by itself improve performance29.
In the Ouémé Delta, ParFlow-CLM resolved runoff, evapotranspiration, water-table depth, and soil moisture jointly, extending assessment to variables inaccessible with simpler models27. The gain is physical consistency; the cost is input data, computation, calibration, and interpretation. These models represent 5 of the 35 records (14%), with considerable potential in instrumented pilot basins and urban areas under strong hydrological pressure41.
Statistical and machine-learning approaches
Statistical approaches occupy an intermediate position between observation and process-based modeling, linking landscape metrics or cover classes to hydrological indicators, detecting breakpoints, and estimating trends; in West African catchments, they usually complement rather than replace hydrological models42. Machine learning operates at three levels. The first is land-cover mapping, where random forest and related algorithms improve classification and change detection8,22,32. The second is data preparation: imputation of missing meteorological series by decision trees, random forests, and extreme gradient boosting43, and statistical downscaling of precipitation projections44. The third, hydrological prediction itself, is the least developed regionally. Long short-term memory (LSTM) networks trained jointly on large catchment samples outperform conceptual models calibrated on the target catchment in leave-one-out regionalization, reframing prediction in ungauged basins (PUB) as data pooling rather than parameter transfer45; a global encoder-decoder LSTM matched or exceeded an established forecasting system in ungauged watersheds, with the largest gains in data-sparse regions including the Sahel46. No study in this corpus applies such models to a West African catchment, making regional LSTM and PUB experiments on pooled Niger, Volta, and Senegal discharge records a concrete priority, conditional on an open regional dataset of catchment attributes and discharge series that does not yet exist. Machine learning handles non-linearity, complex interactions, and multi-source fusion well, and is effective for fine urban classification. Its interpretability is lower than that of process-based models, its performance depends on training-data quality, and its extrapolation under deep land-use or climate change remains uncertain12.
Hybrid approaches and coupled land-use-climate scenarios
The most striking trend of the past decade is hybridization: multi-temporal mapping, future-change projection, calibrated hydrological models, and regional climate scenarios combined so that climate effects, land-use effects, and their interaction can be separated10,18,20,47. Yira et al. used such coupling in Dano to assess water yield and streamflow under five land-use scenarios18. In the Lobo Basin, the Land Change Modeler, CORDEX models, and CEQUEAU quantified impacts on reservoir inflows, illustrating the operational utility of these chains for reservoir management and urban supply47. The Water Evaluation and Planning model (WEAP) was applied in the Mono Basin to climate, LULC, and development effects on water resources and hydropower48.
Hybrid frameworks are best placed to support decision-making because they answer concrete questions: what happens to runoff if urbanization continues, or to recharge if savannas become cropland. Their drawback is the accumulation of uncertainties across classification, transition scenarios, climate models, and hydrological structure, which calls for sensitivity analyses and multi-model ensembles17,40. Where spreads are reported, the climate-model term generally dominates the land-use term20, so an ensemble mean presented without its spread is misleading for planning.
Comparative analysis of approaches
Method comparison must account for the diversity of scientific questions: some techniques measure, others map, explain, or simulate. There is no single best method, only assemblages more or less suited to the problem, the scale, the data, and the form of water stress studied (Figure 2). To avoid qualitative labels, the comparison in Table 5 is expressed wherever the sources allow in reported metrics: NSE, KGE, R2, and percent bias for simulation, and overall accuracy and Cohen’s kappa for classification, interpreted against established thresholds14. Direct observation is most reliable for what it measures, but its territorial reliability depends on network representativeness, and plot-scale runoff coefficients cannot be transferred to catchment scale15. Models give distributed insight, with West African calibration and validation mostly in the 0.6–0.9 range for NSE, KGE, and R2, good to very good by standard criteria14,18,19; but this is achieved on streamflow in most cases, and multi-variable validation shows comparable streamflow scores coexisting with markedly different internal water balances16,21. Remote sensing detects transitions effectively, with accuracies of 80–90% and kappa near 0.75–0.90 when multi-source series, ground validation, and robust algorithms are combined, and degrades when classes are spectrally close33. Model sensitivity to potential-evapotranspiration formulation, demonstrated with 21 methods in the Senegal River Basin, calls for caution in scenario comparison49.
The best cost-coverage trade-off combines free imagery, open climate datasets, a parsimonious model, and a minimal set of streamflow observations, which explains the regional success of SWAT with Landsat and Sentinel classifications8,24,26,30. Dense networks and integrated models remain costly, although best equipped to represent cascading mechanisms such as diffuse urbanization, reduced recharge, and altered wetlands27,29. For transboundary basins such as the Niger, Senegal, and Volta, local approaches alone are inadequate, and the most appropriate designs combine a satellite baseline, rigorous calibration, targeted field information, and systematic uncertainty reporting11,39.
An operational decision framework for method selection
The comparison above becomes an explicit selection procedure in Figure 3, through four sequential filters usable by both a basin agency and a research consortium. The first is the question. Documenting what has changed requires only a remote-sensing trajectory analysis with a formal accuracy assessment. Attributing change to LULC rather than climate requires, at a minimum, a counterfactual design: a run with land use fixed and climate varying, and the reverse. Testing future options requires a scenario chain. Quantifying groundwater response requires either an explicit subsurface representation or a gravimetric or tracer-based approach, because streamflow-calibrated models do not constrain recharge.
The second filter is scale. Below roughly 100 km2, and especially in urban catchments, event-scale processes dominate, and integrated surface-subsurface or event-based urban models are appropriate, provided drainage and impervious fraction are mapped more finely than the land-cover classes usually available. Between roughly 100 and 10,000 km2, semi-distributed models offer the best return on data effort. Above 10,000 km2 and for transboundary basins, regionalized or pooled approaches, satellite-constrained water accounting, and large-sample machine learning become the realistic options45,46.
The third filter is data availability, applied honestly rather than aspirationally. At least three years of concurrent discharge and rainfall records make conventional calibration feasible; shorter or interrupted records call for satellite-based objective functions on evapotranspiration, soil moisture, and total water storage21,34; with no discharge record, the choice lies between regionalization from donor catchments and pooled machine-learning prediction, with uncertainty propagated rather than hidden. The fourth filter is the decision horizon and available resources, each branch paired with an indicative cost in Table 5. Applied to the corpus, the framework exposes two recurrent mismatches: fully distributed models used where the data support only a semi-distributed one, and urbanization attributed to a settlement class too coarse for the inference.
Challenges and opportunities
The first challenge is input data quality. Discontinuous hydro-meteorological series, low station density, and rare observations of water tables, soil moisture, withdrawals, and discharges force dependence on derived products and interpolation, which satellite rainfall products, imputation, and downscaling adapted to West Africa only partly mitigate35,36,37,43,44. The second is causal attribution: water-stress trajectories simultaneously reflect climate variability, extreme-rainfall intensification, LULC change, urbanization, irrigation abstraction, siltation, and infrastructure, and only a minority of the modeling studies assembled here run the factorial design that separation requires.
The third challenge is scale, and here the balance of evidence needs to be stated carefully. West African urbanization is diffuse and discontinuous, combining formal built-up areas, informal settlements, unpaved roads, and hybrid drainage, and it is frequently invoked as a driver of water stress; yet only 3 records (9%) take it as their primary object, all in Niamey6,28,29, against 15 in which agricultural expansion is the dominant signal. Strong statements about urban impacts, therefore, rest on a much thinner base than statements about cropland expansion: the mechanisms are well established in general urban hydrology9,31, but their magnitude in West African catchments is quantified in only a handful of cases. This is a gap to be filled rather than a conclusion to be asserted, and it calls for finer urban mapping distinguishing impervious surfaces, building density, road condition, low-lying areas, and infiltration zones8. The fourth challenge is multi-variable validation: water stress affects streamflow, soil moisture, evapotranspiration, recharge, and water-table depth, so several variables should be mobilized to limit equifinality50.
Three opportunities stand out: growing access to free imagery, topographic data, climate products, and operational evapotranspiration and soil-moisture products, which improve reproducibility34; data fusion coupling field observations, satellite products, models, and machine learning; and regionalization, which opens the way to hydro-territorial observatories39.
Recommended orientations are to strengthen observatory watersheds, with priority to the countries absent from this corpus; generalize uncertainty analyses, multi-model comparison, and systematic metric reporting; integrate abstractions, infrastructure, and uses; develop urban-hydrology models reflecting formal and informal West African infrastructure; openly release a regional large-sample dataset; and co-construct scenarios with water managers, planners, and farmers11.
Conclusions
Assessment of LULC change and urbanization impacts on water stress in West African watersheds has substantially consolidated around a methodological core combining remote sensing, hydrological modeling, and field observations: across the 35 West African records included here, remote sensing intervenes in 57% and hydrological modeling in 43%. Available studies converge in showing that cropland expansion, degradation of natural cover and progressive soil sealing alter water balances, most often through increased runoff and peak flows, relative reduction of infiltration and recharge, redistribution of fluxes and accentuation of seasonal pressures on the resource39,48,51; this convergence is supported by 6 studies across 4 countries, though only 3 mutually independent research groups, and it should be read with that limitation in mind. No single technique can, on its own, capture the full complexity of the phenomenon. In situ devices remain essential for hydrological ground truth and process understanding; remote sensing is indispensable for capturing territorial dynamics over large and sometimes transboundary footprints; conceptual and semi-distributed hydrological models are needed to translate spatial changes into hydrological responses and to test prospective scenarios; machine-learning approaches improve classification, imputation and certain predictive capacities, and large-sample models offer an as yet untested route to prediction in the region’s many ungauged basins; and physically based or integrated models offer the best representation of surface-subsurface processes but demand substantial data, computation and expertise. Methodological superiority, therefore, lies less in any single tool than in the architecture of the assessment design, for which the decision framework proposed in Figure 3 offers an explicit procedure.
In the West African context, the most relevant strategy is to build graduated, hybrid frameworks combining open data, targeted observations, robust mapping, explicit territorial scenarios, transparent hydrological modeling, and systematic uncertainty analyses. Such an orientation is scientifically defensible, more economically sustainable, and operationally more useful for territorial planning, reservoir management, flood prevention, aquifer protection, and climate-change adaptation. The priority for the coming years must be to strengthen data quality and openness, model intercomparison, multi-variable validation, the explicit integration of fine urban dynamics and of the groundwater compartment, both of which this review finds to be quantitatively under-represented, the geographical broadening of the evidence base beyond the four countries that currently dominate it, and co-construction with water managers and territorial stakeholders so that water-stress diagnostics translate effectively into planning and investment decisions.
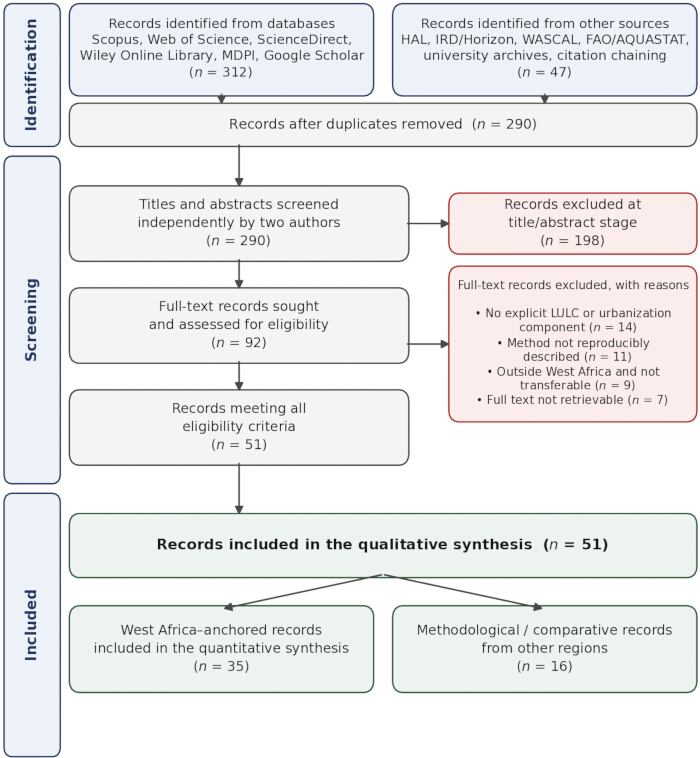
Figure 1: PRISMA 2020 flow diagram of the identification, screening, and inclusion of records. Number of records identified in each database and repository, removed as duplicates, screened at the title and abstract level, assessed as full texts, excluded with reasons, and finally included in the qualitative and quantitative synthesis. Searches were run between 12 January 2026 and 17 April 2026. Please click here to view a larger version of this figure.
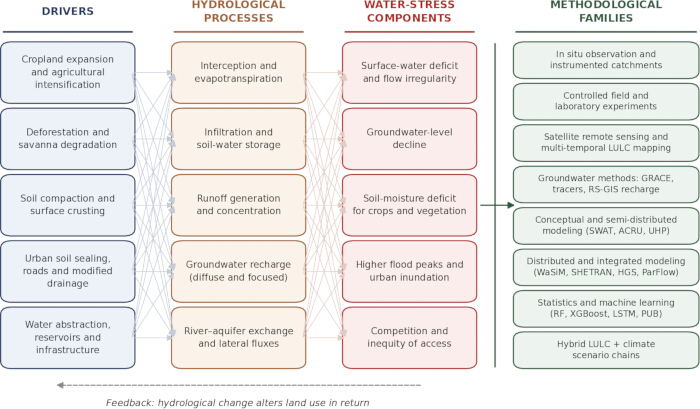
Figure 2: Conceptual diagram linking land use, land cover change, and urbanization to water stress, and mapping the eight methodological families onto the causal chain. Drivers (cropland expansion, deforestation, soil compaction and crusting, soil sealing and drainage modification) act on hydrological processes (interception, evapotranspiration, infiltration, runoff generation, recharge, river-aquifer exchange), which in turn produce the components of water stress (surface-water deficit, groundwater decline, soil-moisture deficit, flow irregularity, flood peaks). Each methodological family is positioned at the level of the chain it observes, maps, explains, or simulates. Please click here to view a larger version of this figure.
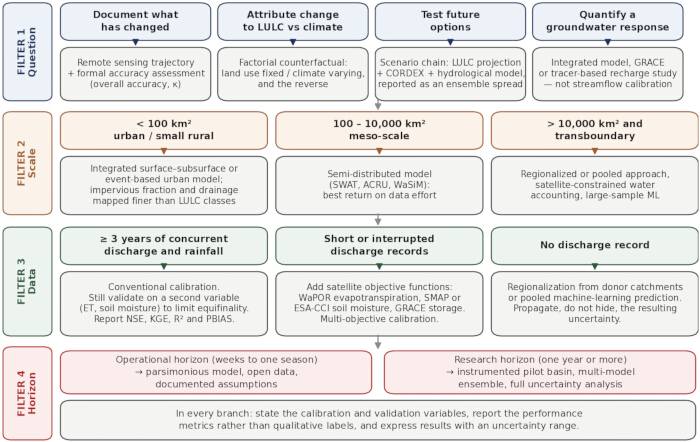
Figure 3: Operational decision framework for selecting a methodological assemblage in West African watersheds. Four sequential filters, namely the scientific question, the spatial scale, the data actually available, and the decision horizon and resources, lead to a recommended combination of methods, together with the minimum validation requirements and the uncertainty reporting expected for each branch. Please click here to view a larger version of this figure.
Table 1: Complete search strings and their platform-specific adaptations. Boolean strings used in each database and repository, field restrictions, language filters, date of execution, and number of records returned by each source. Please click here to download this file.
Table 2: Representative case studies considered in the comparative analysis. Study area, country, catchment area, study period, main method used, calibration and validation variables, reported performance metrics (NSE, KGE, R2, percent bias, overall accuracy, Cohen’s kappa), and specific contribution of each study to the assessment of water stress in West Africa. Please click here to download this file.
Table 3: Distribution of the included West African records by country and by period. Number and proportion of records per country and per five-year publication period, with the methodological families applied in each country. Please click here to download this file.
Table 4: Distribution of the included West African records by methodological family. Number and proportion of records for which each family is the primary approach, number for which it is a secondary approach, and the corresponding countries. Please click here to download this file.
Table 5: Synthetic comparison of the main experimental techniques used to assess water stress in West African watersheds. Comparison along five dimensions: accuracy and reliability expressed through the performance metrics reported by the source studies, cost and feasibility, capacity to capture complexity, relevant spatial and temporal scales, and suitability to the regional context. Please click here to download this file.
Disclosures
The authors declare no conflicts of interest related to this review.
Acknowledgements
The authors thank their colleagues and VM Group Multiservices for providing critical feedback on earlier versions of the manuscript and funding for this article.
References
- Food and Agriculture Organization of the United Nations. AQUASTAT – FAO’s Global Information System on Water and Agriculture. Rome: FAO; 2025.
- UN-Water. World Bank Group: Africa Water Center – Strengthening Capacity in the Water Sector [Internet]. New York: UN-Water. Available from: https://www.unwater.org/news/world-bank-group-africa-water-center-strengthening-capacity-water-sector
- Descroix L, et al. Evolution of Surface Hydrology in the Sahelo-Sudanian Strip: An Updated Review. Water. 2018;10(6):748.
- Leblanc MJ, et al. Land clearance and hydrological change in the Sahel: SW Niger. J Hydrol. 2008;375(1-2):241-52.
- Dauda AP, et al. Simultaneous increase in temperature and dry days in the West African transboundary Benue River Basin. Environ Earth Sci. 2024;83(12):369.
- Garba I, Descroix L, Panthou G, et al. Extreme rainfall characterization under climate change and rapid population growth in Niamey, Niger. Heliyon. 2023;9(4):e15063.
- Qin Y, et al. Flexibility and intensity of global water use. Nat Sustain. 2019;2(6):515-23.
- Mashala MJ, Dube T, Mudereri BT, Ayisi KK, Ramudzuli MR. A Systematic Review on Advancements in Remote Sensing for Assessing and Monitoring Land Use and Land Cover Changes Impacts on Surface Water Resources in Semi-Arid Tropical Environments. Remote Sens. 2023;15(16):3926.
- Salvadore E, Bronders J, Batelaan O. Hydrological modelling of urbanized catchments: A review and future directions. J Hydrol. 2015;529:62-81.
- Obahoundje S, Ofosu EA, Kiem AS, et al. Potential impacts of climate, land use and land cover changes on hydropower generation in West Africa: a review. Environ Res Lett. 2022;17:043005.
- Arfasa GF, Owusu-Sekyere E, Doke DA, Ayisi Ampofo J. Impacts of climate and land use/cover changes on the sustainability of irrigation water in West Africa: a systematic review. All Earth. 2024;36(1):1-13.
- Anggraini R, Baja S, Neswati R. Assessing the impact of land use change on ecosystem service using GIS and remote sensing technology: a review. IOP Conf Ser Earth Environ Sci. 2025;1525(1):012030.
- Page MJ, et al. The PRISMA 2020 statement: an updated guideline for reporting systematic reviews. BMJ. 2021;372:n71.
- Moriasi DN, et al. Model evaluation guidelines for systematic quantification of accuracy in watershed simulations. Trans ASABE. 2007;50(3):885-900.
- Mounirou LA, Zouré CO, Yonaba R, et al. Multi-scale analysis of runoff from a statistical perspective in a small Sahelian catchment under a semi-arid climate. Arab J Geosci. 2020;13(4):154.
- Cornelissen T, Diekkrüger B, Giertz S. A comparison of hydrological models for assessing the impact of land use and climate change on discharge in a tropical catchment. J Hydrol. 2013;498:221-36.
- Bormann H, Diekkrüger B, Hauschild M, et al. Regional hydrological modeling in Benin (West Africa): uncertainty issues versus scenarios of expected future environmental change. Phys Chem Earth. 2005;30(6-7):447-59.
- Yira Y, Diekkrüger B, Steup G, Bossa AY. Modeling land use change impacts on water resources in a tropical West African catchment (Dano, Burkina Faso). J Hydrol. 2016;537:187-99.
- Op de Hipt F, et al. Applying SHETRAN in a Tropical West African Catchment (Dano, Burkina Faso)—Calibration, Validation, Uncertainty Assessment. Water. 2017;9(2):101.
- Idrissou M, et al. Modeling the Impact of Climate and Land Use/Land Cover Change on Water Availability in an Inland Valley Catchment in Burkina Faso. Hydrology. 2022;9(1):12.
- Poméon T, Diekkrüger B, Springer A, Kusche J, Eicker A. Multi-objective validation of SWAT for sparsely-gauged West African river basins: a remote sensing approach. Water. 2018;10(4):451.
- Bodjrènou R, Yira Y, Ahamidé B, Diekkrüger B. Assessment of Current and Future Land Use/Land Cover in the Oueme Basin (Benin, West Africa) under a Changing Climate. Sustainability. 2023;15(3):2245.
- Ganni Mampo OM, Diekkrüger B, Näschen K, et al. Rainfall and streamflow variability in North Benin, West Africa. J Hydrol Reg Stud. 2025;57:101952.
- Awotwi A, Yeboah F, Kumi M. Assessing the impact of land cover changes on water balance components of White Volta Basin in West Africa. Water Environ J. 2015;29(2):259-67.
- Aduah MS, Jewitt GPW, Toucher ML. Assessing Impacts of Land Use Changes on the Hydrology of a Lowland Rainforest Catchment in Ghana, West Africa. Water. 2018;10(1):9.
- . Togbévi QF, Sintondji LO. Hydrological response to land use and land cover changes in a tropical West African catchment (Couffo, Benin). AIMS Geosci. 2021;7(3):338-54.
- Bodjrènou R, Yira Y, Diekkrüger B, et al. Investigating the impacts of climate and land use/cover change on hydrological fluxes in the Oueme Delta hydrosystem using ParFlow-CLM. Sci Rep. 2026;16:39679.
- ORSTOM. Étude hydrologique de bassins urbains à Niamey [Hydrological study of urban catchments in Niamey]. Niamey: Office de la Recherche Scientifique et Technique Outre-Mer; 1979. French.
- Boko BA, et al. High-Resolution, Integrated Hydrological Modeling of Climate Change Impacts on a Semi-Arid Urban Watershed in Niamey, Niger. Water. 2020;12(2):364.
- Olofintoye OO, Salami AW, Ajayi EO. A study on the applicability of a SWAT model in predicting the water yields and water balance of the Upper Oueme catchment, Benin Republic. Slovak J Civ Eng. 2022;30(1):48-58.
- Guan M, Sillanpää N, Koivusalo H. Modeling and assessment of hydrological changes in a developing urban catchment. Hydrol Process. 2015;29(13):2880-94.
- Sambou MHA, et al. Prediction of land use and land cover change in two watersheds in the Senegal River basin (West Africa) using the Multilayer Perceptron and Markov chain model. Geomat Nat Hazards Risk. 2023;14(1):2231137.
- Lu D, Mausel P, Brondízio E, Moran E. Change detection techniques. Int J Remote Sens. 2004;25(12):2365-401.
- Blatchford ML, Mannaerts CM, Njuki SM, et al. Evaluation of WaPOR V2 evapotranspiration products across Africa. Hydrol Process. 2020;34(15):3200-21.
- Cannella G, Pezzoli A, Tiepolo M. Comparative trend analysis of precipitation indices in several towns of the Sirba River catchment (Burkina Faso) from CHIRPS and TAMSAT rainfall estimates. Climate. 2024;12(12):208.
- Houngnibo MCM, et al. Validation of high-resolution satellite precipitation products over West Africa for rainfall monitoring and early warning. Front Clim. 2023;5:1185754.
- Kouakou C, et al. Comparison of gridded precipitation estimates for regional hydrological modeling in West and Central Africa. J Hydrol Reg Stud. 2023;47:101409.
- Barbosa SA, Pulla ST, Williams GP, et al. Evaluating Groundwater Storage Change and Recharge Using GRACE Data: A Case Study of Aquifers in Niger, West Africa. Remote Sens. 2022;14(7):1532.
- Ouarani M, et al. Exploring groundwater recharge mechanisms in a semi-arid coastal aquifer using isotopic analysis, remote sensing, and hydrological modeling. In: AGU Fall Meeting Abstracts 2023. Washington (DC): AGU; 2023. p. H04-05.
- Aloui S, Gires A, Hoang KD, et al. A review of Soil and Water Assessment Tool (SWAT) studies in Mediterranean watersheds: Lessons for data-scarce environments. Environ Int. 2023;171:107684.
- Aboelnour M, Gitau MW, Engel BA. A comparison of streamflow and baseflow responses to land-use change and the variation in climate parameters using SWAT. Water. 2020;12(1):191.
- Locke KA, Shanafield M, Cook PG, Simmons CT. Modeling relationships between land use and water quality: a critical review of statistical approaches. Environ Int. 2024;188:108703.
- Toure M, et al. Machine learning approaches for imputing missing meteorological data in Senegal. Appl Comput Geosci. 2025;27:100281.
- Polasky A, Evans JL, Fuentes JD. Statistical downscaling for precipitation projections in West Africa. Theor Appl Climatol. 2023;155(1):327-47.
- Arsenault R, Martel JL, Brunet F, et al. Continuous streamflow prediction in ungauged basins: long short-term memory neural networks clearly outperform traditional hydrological models. Hydrol Earth Syst Sci. 2023;27(1):139-57.
- Nearing G, et al. Global prediction of extreme floods in ungauged watersheds. Nature. 2024;627(8004):559-63.
- Koffi B, et al. Impact of climate and land use/land cover change on Lobo reservoir inflow, West-Central of Côte d’Ivoire. J Hydrol Reg Stud. 2023;47:101417.
- Obahoundje S, Youan Ta M, Diedhiou A, Amoussou E, Kouadio K. Sensitivity of hydropower generation to changes in climate and land use in the Mono Basin (West Africa) using CORDEX dataset and WEAP model. Environ Process. 2021;8(3):1073-97.
- Ndiaye PM, Bodian A, Dezetter A, Ogilvie A, Goudiaby O. Sensitivity of global hydrological models to potential evapotranspiration estimation methods in the Senegal River Basin (West Africa). J Hydrol Reg Stud. 2024;53:101823.
- Togbévi QF, et al. A multi-model approach for analysing water balance and water-related ecosystem services in the Ouriyori catchment (Benin). Hydrol Sci J. 2020;65(14):2453-65.
- Kouassi AM, Gnangouin AYJ, Konan GR, Nassa RAK. Impacts of climate change on water stress in West Africa: case study of the N’zi (Bandama) watershed in Côte d’Ivoire. Int J Environ Clim Change. 2022;12(12):472-83.