This paper describes an integrated Geographic Information System (GIS)-based approach using Multi-Influencing Factor (MIF) and Analytic Hierarchy Process (AHP) models to identify suitable rainwater harvesting sites and select appropriate structures in mountainous river basins, demonstrated in the Panjkora basin, northern Pakistan.
Research Article
Optimizing Rainwater Harvesting Site and Structure Suitability Using Geospatial, Multi-Influencing Factor, and Analytic Hierarchy Process Approaches
In This Article
Summary
Abstract
Rainwater harvesting (RWH) is an essential practice for water conservation, improved water resource management, and water-related hazards mitigation in mountainous areas. Selection of a suitable site and an appropriate structure of the RWH facility are vital for improving water availability and agricultural productivity under all circumstances, particularly due to climate change-related hydrological uncertainty. It is challenging to evaluate and analyze RWH sites across diverse conditions worldwide, particularly in remote, inaccessible mountainous areas where these sites have significant impacts on the environment, society, and economy of the region and downstream. In this study, the Multi-Influencing Factor (MIF), and the Analytic Hierarchy Process (AHP) were applied in Geographical Information System (GIS) using customary and remote sensing (RS) data for selecting a suitable RWH site and appropriate structures in the Panjkora river basin in the Hindu Kush region in northern Pakistan. According to MIF (and AHP) results, the study region has 80.22 (1572.58) km2 less suitable area, 1681.99 (1605.69) km2 as moderate suitable, 3116.10 (1768.62) km2 as suitable, 844.86 (689.15) km2 as high suitable and 35.10 (122.61) km2as very high suitable for RWH structures. The resulting maps were validated using Receiver Operating Characteristic and Area Under the Curve (ROC-AUC) tests (MIF score = 0.724 and AHP score = 0.692) to check the accuracy and robustness of the models. This research, presenting results with promising accuracy, will provide new technical insights on the topic for further improvement, suitability and applicability of the models under different hydro-meteorological and physiographic conditions. Overall, both models successfully identified suitable rainwater harvesting sites; however, the MIF model outperformed the AHP model in terms of predictive accuracy and spatial reliability. The proposed GIS-based framework can support sustainable rainwater harvesting planning and water resource management in mountainous watersheds.
Introduction
Water scarcity, including the depletion of both surface and groundwater resources, has become a major challenge in many developing countries1. Rapid population growth, urbanization, agricultural expansion, complex topography, and changing climatic conditions have intensified pressure on available water resources2,3. In water-stressed regions, excessive groundwater abstraction to meet domestic and agricultural demands has resulted in declining water tables and reduced long-term water security. Therefore, sustainable water management strategies are urgently required, particularly in regions experiencing rapid population growth, high vulnerability of water resources from climate change, and increasing water demand, such as Pakistan. Among various adaptation strategies, rainwater harvesting (RWH) has emerged as an effective approach for conserving rainfall runoff and supplementing available water resources4. RWH systems collect and store rainfall during wet periods for subsequent use, providing a sustainable alternative for addressing water shortages at both local and regional scales5,6. However, the success of RWH systems largely depends on identifying suitable locations and appropriate harvesting structures. Site selection is a complex process because it is influenced by multiple physiographic, environmental, hydrological, and socio-economic factors that vary spatially across regions7,8. Traditionally, field surveys have been used to identify potential RWH sites; however, these approaches are often expensive, time-consuming, and impractical for large and inaccessible areas, particularly mountainous regions. Therefore, Geographic Information System (GIS) and Remote Sensing (RS) technologies have increasingly been adopted as efficient alternatives for regional-scale RWH assessment9. GIS-based multi-criteria evaluation (MCE) provides an effective framework for integrating diverse thematic layers, including rainfall, runoff, slope, soil characteristics, land use/land cover, drainage density, and socio-economic parameters, to identify suitable RWH zones10,11. Remote sensing datasets further enhance this approach by providing cost-effective spatial information over large and inaccessible areas, including land cover, geomorphology, soil characteristics, and hydrological features12. Pakistan is among the countries facing severe water challenges due to increasing water demand, climate variability, and dependence on agriculture-based livelihoods13. The country's agricultural economy requires substantial water resources, while declining groundwater levels and irregular precipitation patterns have increased vulnerability to water shortages. Consequently, rainwater conservation and storage have become important strategies for improving water availability, especially in water-deficient and mountainous regions12,14. Previous studies have demonstrated the effectiveness of GIS and RS-based approaches for RWH site selection by integrating environmental and socio-economic parameters15,16,17,18. Several researchers have applied various multi-criteria decision-making techniques, including Analytic Hierarchy Process (AHP), Fuzzy AHP, and other weighting approaches, to identify suitable RWH locations under diverse environmental conditions19. Despite significant progress, the performance of different multi-criteria decision-making approaches may vary depending on regional environmental characteristics, available datasets, and expert-based weighting systems. In particular, limited studies have compared the effectiveness of different approaches under similar watershed conditions. Therefore, evaluating and comparing alternative decision-making techniques is essential for improving the reliability of RWH site suitability assessments. The present study addresses this research gap by comparing the Multi-Influencing Factor (MIF) and Analytic Hierarchy Process (AHP) techniques for identifying suitable RWH sites in the Panjkora Basin, Pakistan. It is hypothesized that incorporating different variables like topography, geological properties, land cover dynamics, drainage-lineament density, soil characteristics and rainfall in GIS using a multi-criteria decision approach can identify the best suitable RWH sites under a mountainous environment. The study provides valuable insights into the applicability of GIS-based decision-support approaches for sustainable water resource planning in mountainous regions.
Protocol
This study involved geospatial, remote-sensing, and field-validation data and did not involve human participants, identifiable personal data, animals, or vertebrate tissues; therefore, institutional human or animal ethics approval was not required.
Study region
The Panjkora river basin is an important physiographic region situated in the eastern Hindu Kush Mountains in the northern Pakistan (Figure 1). Panjkora river is the main river of the basin (113 km long with 5758.27 km2 catchment area) and starts as a torrent from ice-capped mountains of Hindu Kush. It joins the River Swat near Chakdara, Dir Lower20. Panjkora River is joined by five significant torrents or streams, including Barawal, Dir, Gawaldai, Jandol, and Kohistan. It extends from 34°39′30′′ to 35°46′1′′ North latitudes and from 71°13′08′′ to 72°22′13′′ East longitude. The region's location and rugged topography significantly influence its climate (mountainous and temperate). The Upper (Kumrat, Thal) region of the basin has a longer winter season and a colder summer season. From November onwards, the temperature drops sharply. However, in Dir Lower (Timergara, Talaash, Maidan, Samarbagh), the temperature is usually above the freezing point from December to February. The warmest months in Timergara are June through August, with average maximum temperatures above 35 °C, whereas June and July are the hottest months in Dir Town (with maximum temperatures of 32.4 °C and 31.5 °C). Monsoon is the source for summer rainfall, whereas the Western Depression brings winter rainfall. The study area is characterized by a high relative humidity throughout the year. Riverine and flash floods21 occur (almost) every year, especially in areas up and downstream of Wari. The major crops cultivated in the region include rice, wheat, corn, potato, and onion, while significant fruits grown in the study area are persimmon, orange, apple, walnuts, apricot, plum, loquat, and mulberry.
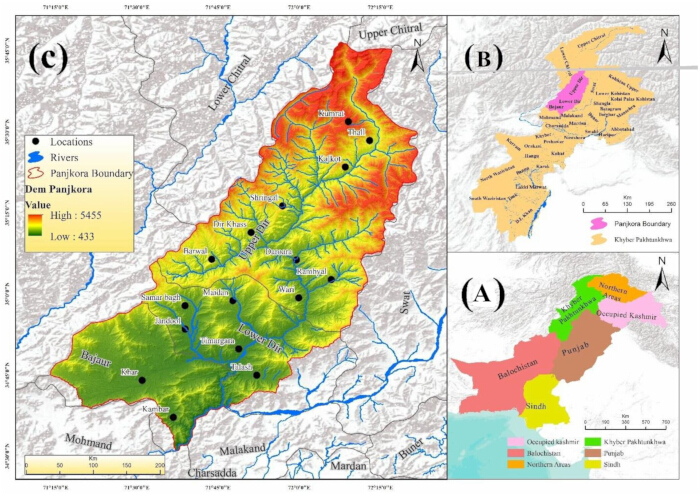
Figure 1: Study area map of the Panjkora River Basin, northern Pakistan. (A) Location of Khyber Pakhtunkhwa within Pakistan; (B) location of the Panjkora River Basin within Khyber Pakhtunkhwa; and (C) Panjkora River Basin showing the basin boundary, elevation distribution, river network, and major locations within the study area. Please click here to view a larger version of this figure.
Data collection and preparation
For this study, the data were collected from different sources. Rainfall/ Precipitation data were downloaded from Global Precipitation Measurement (GPM) National Aeronautics and Space Administration (NASA) https://gpm.nasa.gov/missions/GPM from 2014 to 2023. The soil texture data were collected from the Directorate of Soil Survey Khyber Pakhtunkhwa, Pakistan (www.soilconservation.kp.org). The Geological data was obtained from the regional office of Geological Survey of Pakistan (https://gsp.gov.pk/). For collection and calculation of land Scenarios (Land use/Land Cover) Sentinel 2 images were obtained from European Space Agency (ESA) Copernicus Open Access Hub (https://scihub.copernicus.eu/). Sentinel-2B imagery acquired on 10 September 2025 was used for land use/land cover (LULC) mapping. The image was processed and classified using the Maximum Likelihood Classification (MLC) algorithm. A total of 65 training samples were collected across the study area representing seven LULC classes: water bodies, forest, agricultural land, urban areas, bare soil, snow/ice, and rangeland. The prepared training samples were used to perform supervised classification and generate the final LULC map. The classification accuracy was evaluated using an accuracy assessment approach based on validation samples, including overall accuracy and Kappa coefficient. The digital elevation model (DEM) model 12.5 Spatial resolution was acquired from Alaska Satellite facility (ASF) (https://asf.alaska.edu/) on 2/12/2023. The DEM model was further used to generate slope, drainage network, drainage density, and elevation layers. The existing rain water harvesting structures data were collected from relevant departments for cross validation.
All spatial datasets were processed and analyzed using geographic information system (GIS) software (see Table of Materials). The GIS thematic-layer data are provided in Supplementary File 1. All input datasets were projected into a common projected coordinate reference system (CRS) (WGS 1984 UTM Zone 42N) to ensure spatial consistency and accurate area calculation. Raster datasets with different spatial resolutions were resampled and aligned to a common grid using the nearest neighbor resampling method, while maintaining the original spatial characteristics of categorical datasets. The Digital Elevation Model (DEM) with 12.5 m spatial resolution was used as the reference raster for spatial alignment, and all thematic layers were converted into raster format with the same cell size and extent. The study area boundary of the Panjkora River Basin was used as a mask to extract all input layers and maintain a consistent spatial extent for analysis. Missing pixels and areas outside the basin boundary were excluded from the analysis and treated as NoData values. The thematic layers (rainfall, slope, drainage density, lineament density, soil, geology, and land use/land cover) were reclassified into suitability classes using the Jenks Natural Breaks classification method, and corresponding ranks/weights were assigned based on the MIF and AHP approaches. Table 1 shows the data sources.
Table 1: Data sources and characteristics used for rainwater harvesting suitability assessment. Please click here to download this Table.
MIF suitability modeling
Initially, the selection of various parameters is carried out based on literature review12. To determine suitable locations for RWH, precipitation, lithology, lineament density, drainage density, soil texture, slope, and land use/land cover, were taken into consideration as distinct influencing factors. For this objective, pre-processing of the parameters is carried out to create the parameter's influence scale; the data were then categorized according to their significance to RWH, and the major and minor importance were determined using the multi-influencing factor formula (Equation 1). Table 2 shows the major and minor importance of different factors22 (See the Supplementary File 2)
Table 2: Selected influencing factors and their major and minor influence scores used in the Multi-Influencing Factor (MIF) model. Please click here to download this Table.
The selected Factors were ranked using the relation,
[(X+Y) ÷ ∑(X+Y)] × 100 (1)
where Y denotes the minor effect of factors, and X denotes the major effect. Each factor's major and minor influences are calculated using Equation 1.
The major (X) and minor (Y) influence scores were assigned based on previous studies and the hydrological significance of each factor in controlling runoff generation, infiltration, and rainwater harvesting potential12. A major influence was assigned to factors having a direct impact on RWH suitability, while minor influence represented indirect relationships among the controlling parameters. The factor weights were calculated using Equation (1) by normalizing the combined major and minor influence scores. The subclass weights were assigned according to their relative contribution to runoff accumulation, infiltration capacity, water retention, and suitability for RWH structures. This approach ensured a transparent and reproducible weighting framework for GIS-based suitability analysis.
Relative importance based on Saaty’s scale is shown in Table 3.
Table 3: Saaty’s relative importance scale used for Analytic Hierarchy Process (AHP) analysis. Please click here to download this Table.
The thematic levels scores of all the parameters are combined, each subclass score of the MIF parameters is listed in Table 4. Using the reclassification technique, the MIF output is classified into five categories for rainwater harvesting. Finally, maps of the ultimate locations suggested for installing different RWH structures, such as check dams, farm ponds, gully plugs, and other conservation-related structures, are generated and analyzed. Figure 2 shows the methodology framework.
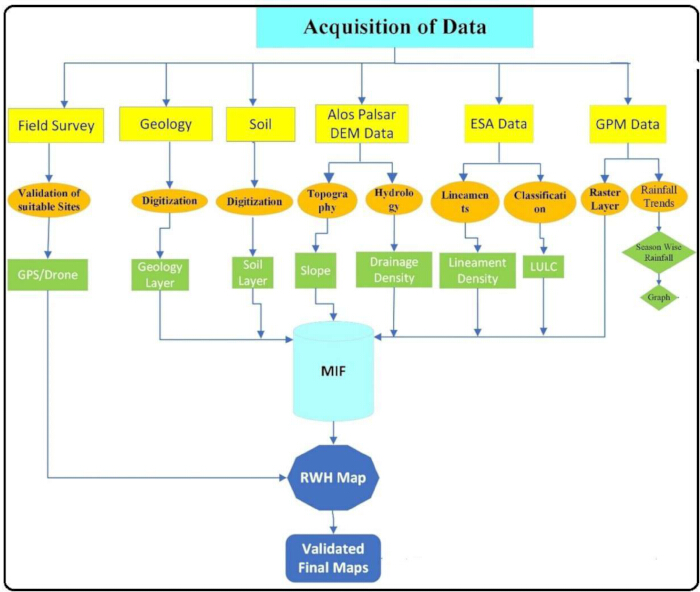
Figure 2: Methodological framework for rainwater harvesting site suitability assessment using GIS-based MIF and AHP models. The framework illustrates the acquisition and processing of field-survey, geology, soil, ALOS PALSAR DEM, ESA, and GPM data to derive thematic layers, including geology, soil, slope, drainage density, lineament density, land use/land cover (LULC), and rainfall. These layers were integrated using the Multi-Influencing Factor (MIF) approach to generate the RWH suitability map, followed by field-based validation to produce the final validated maps Please click here to view a larger version of this figure.
Table 4: Multi-Influencing Factor (MIF)-based ranks and weights of thematic factors and subclasses for rainwater harvesting suitability mapping. Please click here to download this Table.
AHP suitability modeling
Analytic Hierarchy Process (AHP) is an effective technique for handling difficult decision-making situations which also helps the decision-maker set priorities and choose the best option23. The AHP technique is a systematic framework for organizing and evaluating complicated decisions through the application of mathematics and expert knowledge24. The AHP aids in identifying both the subjective and objective aspects of a decision by simplifying complex judgments through pairwise comparisons and then evaluating the results25. There will inevitably be some disparity because the comparisons are based on subjective or individual viewpoints. By calculating the consistency ratio and removing decision-making bias, the AHP technique provides a useful tool for evaluating the consistency of the decision-maker's judgments, ensuring consistency of perceptions. One of the main benefits of the AHP is the consistency ratio, which quantifies the degree of consistency between paired comparisons of different criteria26,27,28,29. Geographical data inputs are combined and transformed by the AHP into a decision output. Utilizing Saaty's scale (Table 3), qualitative data on various themes and qualities is transformed into quantitative data by generating a pairwise comparison matrix30,31. The fundamental process comprises setting the goal, considering and assessing the factors or standards that affect the final decision, and using Saaty's scale to assign a rating to each criteria. To check the consistency of assigned weights, the consistency ratio (CR) as suggested by Saaty23 was computed using Equations 2 and 3:
CR = CI/RCI (2)
where CI is the consistency index, and RCI is the random consistency index.
The consistency index (CI) is given by the equation:
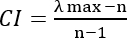 (3)
(3)
where n is the number of criteria and λmax is the major eigenvalue. The consistency index's average value is estimated by the random index.
RWH structure selection
Land cover land use (LULC)
Land use characterizes the use of the land, whereas land cover describes the natural features of the land. Important information about runoff spreading is contained in the LULC32. In vegetation-covered areas, higher absorption and infiltration rates are linked to less runoff, whereas bare land and built-up areas foster high runoff formation33,34. Sentinel 2b satellite data were used to prepare the land-use/land-cover patterns of the study area. The land use of the Panjkora river basin was classified into seven classes namely; water bodies, forest, crop and agricultural land, urban land, bare land, snow/ice and range land. The suitability weights assigned to the different land-use/land-cover classes were based on their influence on runoff generation, infiltration, and rainwater storage potential. Agricultural land received the highest suitability rating because it generally produces moderate runoff and directly benefits from harvested water for irrigation. Barren land was also assigned a relatively high weight because sparse vegetation and exposed soil surfaces promote greater surface runoff compared with densely vegetated areas. In contrast, forested areas were assigned to lower weights because dense vegetation intercepts rainfall, increases infiltration through extensive root systems, and reduces overland flow. Urban areas and existing water bodies were assigned to lower suitability because they either have limited opportunities to construct additional RWH structures or are already occupied by impervious surfaces or existing water bodies (Figure 3A).
Drainage density
An area's groundwater infiltration and water runoff are described by the drainage density. The subsurface hydrological formation and surface characteristics are both reflected in drainage density. It shows the tightness of channel spacing and the characteristics of the surface material. Runoff decreases with decreased drainage density and vice versa12. Lower infiltration and lower runoff are generally found in areas with low drainage density, and vice versa. Dense drainage networks are essential for rainwater collection. RWH are better suited to areas with higher drainage densities because they provide a system that allows water to flow and be rapidly conveyed to a point of collection34,35. The Drainage density of the Panjkora River basin was classified into five classes on the basis of Jenks Natural Breaks classification: 0–9.4907, 9.4907–27.207, 27.207–48.219, 48.219–79.089 and 79.089–161.34 km/km2. Zones with low to moderate drainage densities were assigned a higher weighting value because they are considered as ideal locations for rainwater harvesting (Figure 3B).
Lineament density
Lineaments are linear subsurface features that are typically derived from geological maps and are also visible on satellite images. Lineaments (buried beneath zones of localized or structural weathering) exhibit enhanced porosity and permeability12. The lineaments were extracted from Landsat 8 image using remote-sensing image-processing software. The line-density tool was employed to generate the lineament raster layer. The lineament density was further classified using Jenks Natural Breaks classification method into five classes: 0.0072-0.406 km/km2, 0.406-0.664 km/km2, 0.664-0.921 km/km2, 0.921-1.33 km/km2 and 1.33-2.13 km/km2 (Figure 3C).
Soil
Soil texture is an important factor with respect to RWH planning and site selection. The soil's capacity for infiltration is determined by its texture. In general, sandy soils generate low runoff as compared to clayey soil36. The percentages of silt, sand, and clay define the textural class of the soil. Clay soil has poor permeability and can retain the collected water, so areas with medium- and fine-grained soil were often preferred for rainwater collection8,37. The study region is characterized by five soil textures: Glaciers and snow caps, loamy, non-calcareous clay soil, Loamy shallow non-calcareous soil, Loamy very Shallow soil, and rock outcrops (Figure 3D).
Slope
Infiltration and runoff are significantly impacted by topography8. The catchment's variation in slope has a clear impact on how water flows during and after a downpour. Building RWH structures in areas with steep slopes is not cost-effective due to the significant amount of earthwork needed38. For a high RWH potential, a gentle slope is the most suitable location. RWH structures are not durable in areas with steep slopes (slopes greater than 5%)39. Erosion control measures are also considered in areas with steeper slopes40 . The slope was calculated in degrees, and the study area was divided into five classes using Jenks Natural Breaks classification: 0°–11.9°, 12°–22.5°, 22.6°–31.8°, 31.9°–42.4° and 42.5°–82° (Figure 3E).
Rainfall
Rainfall is the primary component that produces surface runoff. Rainfall/ Precipitation data, the Global Precipitation Measurement (GPM) data were downloaded from NASA https://gpm.nasa.gov/missions/GPM from 2014 to 202341. The GPM rainfall data from 2014-2023 time period and Jenks Natural Breaks classification were used to classify the study area into five classes of rainfall (mm): 49.93–57.014, 57.014–61.773, 61.773–65.262, 65.262–68.646 and 68.646–76.894 (Figure 3F).
Geology
The physical composition of a watershed and the amount of soil it produces are greatly influenced by the geology of the area. Geological features control the flow of water into subsurface aquifers40. Sedimentary and metamorphic rocks are the two major types of rocks found in the current study area. Lithology was broadly divided into Lower Paleozoic rocks, Carboniferous sedimentary rocks, Cretaceous sedimentary rocks, Mesozoic intrusive and metamorphic rocks, Triassic rocks, undivided Paleozoic rocks, undivided Paleozoic rocks and undivided Precambrian rocks, and undivided Silurian rocks. The availability and storage capacity are significantly influenced by the type of lithology; certain rocks have the ability to percolate surface water and replenish the aquifer41. On the other hand, some rocks allow water to pass through and help recharge subsurface water. Lithology strongly controls runoff generation through its effects on permeability, porosity, and infiltration capacity. In the Panjkora Basin, compact metamorphic rocks generally exhibit lower primary porosity and permeability than unconsolidated or highly porous sedimentary deposits. Consequently, rainfall is less likely to infiltrate and more likely to generate surface runoff, making these formations more suitable for surface rainwater-harvesting structures. In contrast, sedimentary formations containing coarse-grained or sandy materials generally permit greater infiltration, thereby reducing surface runoff available for storage. Therefore, higher suitability weights were assigned to metamorphic rocks, whereas relatively lower weights were assigned to sedimentary formations. Figure 3G shows the geological map of Panjkora river basin. All data are available in Supplementary Files 1 and 3.
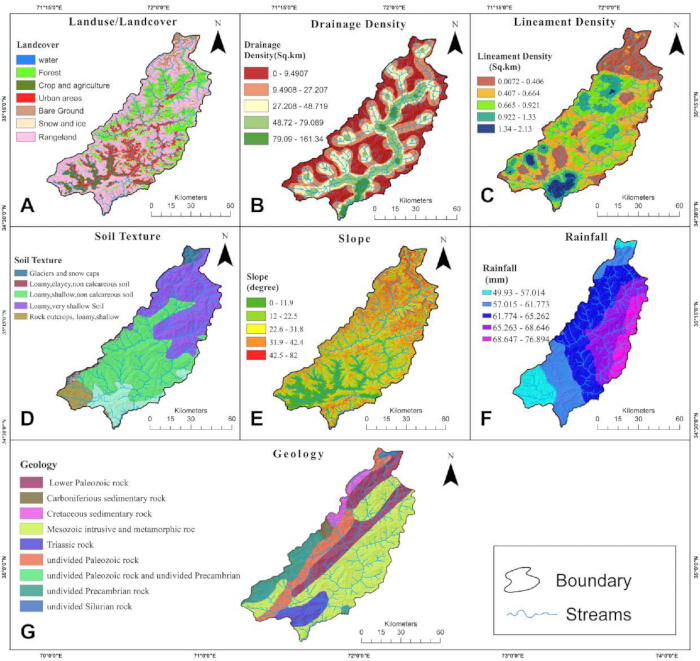
Figure 3: Spatial distribution of the thematic factors used for rainwater harvesting site assessment in the Panjkora River Basin. (A) Land use/land cover, (B) drainage density, (C) lineament density, (D) soil texture, (E) slope, (F) rainfall, and (G) geology. Different colors represent the respective classes of each thematic factor. Please click here to view a larger version of this figure.
Results
Thematic map reclassification for MIF model
Land cover land use and RWH
The land use of the Panjkora river basin was classified into seven classes, namely, Water bodies, Forest Land, Crop and Agriculture land, Urban land, Bare Land, Snow and ice and range land Regions where RWH is vital to life have been assigned a high weight based on literature. Agricultural and barren land were assigned higher suitability because these land-cover classes generally generate greater surface runoff than densely forested areas and provide favorable locations for storing harvested water for agricultural use. Forested areas received lower suitability because higher vegetation cover promotes rainfall interception and infiltration, thereby reducing runoff generation. Urban areas and existing water bodies were assigned lower weights because they offer limited opportunities for new rainwater harvesting interventions, Agricultural and bare Land were given more weight, whilst surface water and urban areas were given less weight in context of Rainwater harvesting (Figure 4A). The LULC classes were assigned weights according to their relative importance for rainwater harvesting suitability (Table 4): water bodies (1), barren land (6), forest cover (2), urban areas (1), and agricultural land (7).
Drainage density and RWH
The infiltration of groundwater and runoff of surface water are described by the drainage density. Low-runoff areas showed high infiltration, while low-drainage-density areas showed lower infiltration. Low and moderate drainage density zones were given a high rank (7, 4) while High and very High Drainage density was given the lowest weight (3, 2) on the basis of23 (Figure 4B). Low and moderate drainage density areas were marked as best for RWH in the area.
Lineament density and RWH
The lineament density of the study area was classified using Jenks Natural Breaks classification method into five classes i.e. very high suitability, high suitability, moderate suitability, low suitability, and very low suitability, and the weights were assigned (7, 4, 3, 2, 1) accordingly (Figure 4C and Table 4). In the study area, high-density zones were deemed the least suitable locations for rainwater harvesting, while low-density zones were considered to have high potential and were given a higher weighting value.
Soil and RWH
Five types of soil texture were mapped, i.e., (glaciers and snow caps), (loamy, clay non calcareous soil), (loamy shallow non calcareous soil), (loamy very shallow soil), and (rock outcrops) (Figure 4D). The water-holding capacity and permeability have been taken into consideration when assigning the weights. The capacity of loamy and clay soil to hold water on the surface was given the highest weight according to Saaty23. Very shallow mountain loamy soil has a low weight value owing to its high porosity and high permeability.
Slope and RWH
The slope data were divided into five classes on the basis of Jenks Natural Breaks classification i.e. (0–11.9) degrees, (12–22.5) degrees, (22.6–31.8) degrees, (31.9–42.4) degrees and (42.5–82) degrees (Figure 4E). In the MIF technique, areas with a moderate slope (12–22.5), were allotted a high value, while very steep-slope areas were assigned a low value. This indicates that the slope was given weightage. The MIF model formula was used to determine the classes’ weights and ranks.
Rainfall and RWH
The GPM rainfall data from the 2014–2023 time period was used and classified using Junk's classification into five classes in (mm) i.e. (49.93–57.014), (57.014–61.773), (61.773–65.262), (65.262–68.646) and (68.646–76.894) (Figure 4F). Values were assigned based on rainfall amounts; areas with high rainfall rates acquired high weights, and vice versa.
Geology and RWH
The majority of the study area consists of metamorphic and sedimentary rocks. The availability and storage capacity are significantly influenced by the lithology and type of rock; certain rocks can percolate surface water and replenish the aquifer. On the other hand, some rocks allow water to pass through and help recharge subsurface water. Metamorphic rocks were assigned higher suitability because their comparatively low permeability promotes surface runoff generation, thereby increasing the availability of runoff for harvesting. In contrast, sedimentary formations generally possess higher permeability and infiltration capacity, allowing a larger proportion of rainfall to infiltrate into the subsurface rather than contributing to surface runoff. Therefore, metamorphic rocks were considered more suitable for surface rainwater harvesting in the study area. Figure 4G shows the reclassified Geological map.
Weights assignment using AHP
According to Wind and Saaty's recommendations23, the study considered seven thematic layers, each assigned a weight ranging from 1 to 9 based on its suitability for rainwater harvesting. The approach indicates that weights were also allocated to the feature classes. Table 5 shows the normalization of the weights allocated to the criterion and their feature classes using the AHP approach30. Expert judgment was crucial in determining the weights assigned to the different factors, which were evaluated based on each factor's impact on the research area. After the calculation Normalized weights (0.23) were given to Land use/ Land cover, Rainfall (0.27), drainage density (0.13), slope (0.07), lineaments density (0.08), geology (0.10), and soil (0.10). For the theme layers, the consistency ratio was computed as 0.08 using Equation 3, which falls below the threshold of 0.10. Moreover, the feature classes consistency ratio was similarly within the 0.10 range (Table 6). The layers and features are consistent, according to the consistency ratio for the present study. To ascertain the relative importance of the thematic layers, a pairwise analysis was also performed, as Table 5 shows.
Table 5: Pairwise comparison matrix and normalized weights of thematic factors used in the Analytic Hierarchy Process (AHP) model. Please click here to download this Table.
Table 6: Analytic Hierarchy Process (AHP)-based weights and ranks of thematic factors and subclasses for rainwater harvesting suitability analysis. Please click here to download this Table.
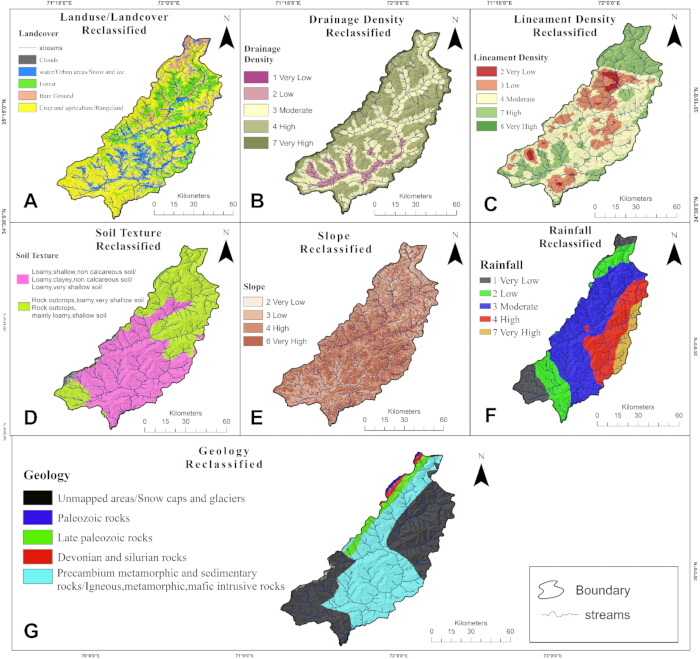
Figure 4: Reclassified thematic layers used for rainwater harvesting suitability analysis in the Panjkora River Basin. (A) Reclassified land use/land cover, (B) drainage density, (C) lineament density, (D) soil texture, (E) slope, (F) rainfall, and (G) geology. The classes were reclassified according to their suitability scores for rainwater harvesting site selection. Numbers/colors indicate the assigned suitability classes, ranging from very low to very high suitability, where applicable. Please click here to view a larger version of this figure.
Potential RWH areas
The final maps using MIF and AHP model techniques were developed by applying weighted overlay and weighted sum techniques. Using these two models, the study area was classified into five classes (Figure 5) based on suitability classes: less suitable, moderately suitable, suitable, highly suitable, and very highly suitable sites. The MIF results in the Panjkora river basin for rainwater harvesting show that 80.22 km2 area has less suitability, 1681.99 km2 is moderately suitable, 3116.1 km2 is suitable, 844.86 km2 has high suitability and 35.10 km2 has very high suitability for RWH. While the AHP results exhibit 1572.58 km2 area with less suitability, 1605.69 km2 is moderate suitable, 1768.62 km2 is suitable, 689.15 km2 has high suitability and 122.611 km2 has very high suitability (Table 7, Figure 5 and Figure 6) for RWH. The MIF- and AHP-based suitability map outputs are provided in Supplementary File 4.
Table 7: Comparison of rainwater harvesting suitability classes derived from Multi-Influencing Factor (MIF) and Analytic Hierarchy Process (AHP) models. Please click here to download this Table.
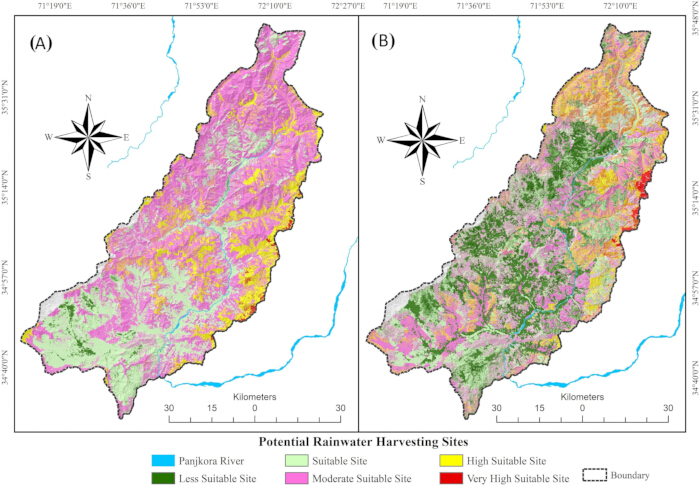
Figure 5: Spatial distribution of potential rainwater harvesting sites identified using (A) the MIF method and (B) the AHP method in the Panjkora River Basin. Please click here to view a larger version of this figure.
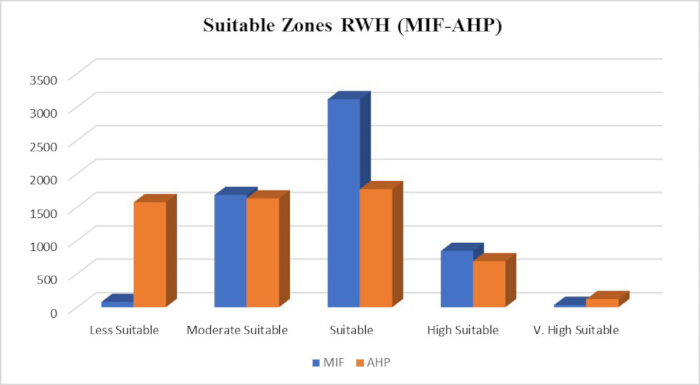
Figure 6: Comparison of the areas classified into different rainwater harvesting suitability classes using the Multi-Influencing Factor (MIF) and Analytic Hierarchy Process (AHP) methods. The bars show the area (km2) within each suitability class, including less suitable, moderately suitable, suitable, highly suitable, and very highly suitable zones. Please click here to view a larger version of this figure.
Selection of suitable RWH structures
The engineering criteria used for selecting suitable locations for rainwater harvesting (RWH) structures, including check dams, farm ponds, and gully plugs, were adopted from the Food and Agriculture Organization (FAO) Water Harvesting Manual42. According to the FAO guidelines, the selection of appropriate RWH structures should consider topography (slope), drainage characteristics, runoff potential, soil texture, lithology, land use/land cover, and catchment conditions to ensure the technical feasibility, structural stability, and long-term performance of the harvesting systems. These internationally recognized engineering criteria were integrated into the GIS-based multi-criteria evaluation framework used in this study. The main goal of rainwater conservation using runoff-conservation structures (bench trenching, rock-fill dams, gully plugs, and check dams) is to reduce or stop the flow of water. Contour trenching and subsurface dams are two effective ways that RWH can be used in drought-prone locations to address the severe issues of drought and water scarcity43. Following the identification of potential RWH sites, the optimal locations for RWH construction were determined. Farm ponds, check dams, and gully plugs are the only three RWH structures found to be worthy of consideration after an analysis of the study area's conditions (Table 8). Farm ponds are Small earthen barriers with a slope ranging from 1% to 6%. The goal of constructing farm ponds is to divide a long slope into multiple shorter, less steep slopes in order to lessen flow velocity and the erosion caused by runoff water. Check dams are more significant than other types of construction because they can reduce soil erosion and store rainwater. The distance between two check dams while building a chain of them along a stream channel should be greater than their water spread. Rainwater erosion of topsoil results in the formation of gullies. Gradually, the erosion increases and a gully takes on a more definite shape. Then, at specific intervals, barriers or plugs made of various materials are placed across the gully to stop erosion and store rainwater for later use. The map (Figure 7) shows the locations for rainwater harvesting in the Panjkora river basin. Metadata for the identified suitable RWH locations are provided in Supplementary File 5.
Table 8: Proposed rainwater harvesting structures and their geographic characteristics in the Panjkora River Basin. Please click here to download this Table.
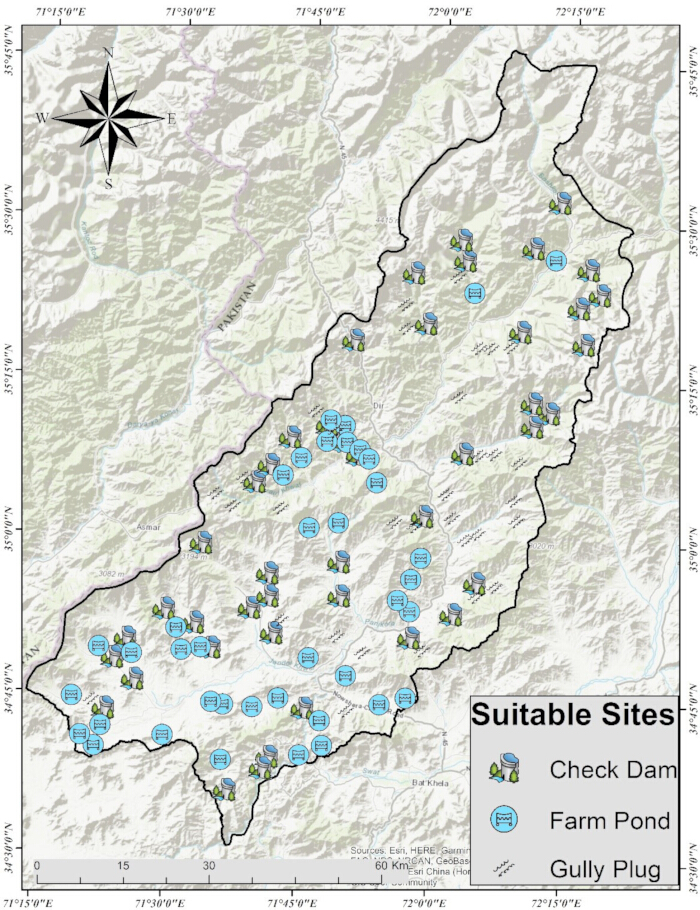
Figure 7: Spatial distribution of potential rainwater harvesting structures in the Panjkora River Basin. The map shows locations of proposed check dams, farm ponds, and gully plugs within the identified suitable areas. The basin boundary and drainage network are also shown. Please click here to view a larger version of this figure.
Model validation
The GIS-based model results will always require a verification with ground data. After extracting the data, the area was extensively surveyed and the cross-checked the results with existing RWH structures in the study area. It was discovered throughout the survey that some rainwater harvesting structures had already been built at appropriate locations; however, these were not enough for the area. Verification of the MIF and AHP results was done using the cross-verification technique. Most suitable zones are where the negotiable interventions fall. Additionally, various locations for upcoming rainwater-harvesting interventions were identified during the physical survey. The field-survey validation points and geographic coordinates are provided in Supplementary File 6. The statistical validation of the model was carried out using the receiver operating characteristic area under the curve (ROC AUC). The ROC analysis data and results for the AHP model are provided in Supplementary File 7. The ROC was run on field validation Global Positioning System (GPS) points (Figure 8A) and the results of AHP and MIF models. The corresponding ROC analysis data and results for the MIF model are provided in Supplementary File 8. The MIF models exhibit a 0.72 AUC curve (Figure 8B), and the AHP model shows 0.69 (Figure 8C). According to commonly accepted ROC-AUC interpretation criteria, AUC values are classified as no discrimination (0.50), poor (0.50 to 0.60), fair (0.60 to 0.70), good (0.70 to 0.80), very good (0.80 to 0.90), and outstanding (0.90 and above) to indicate predictive performance. Accordingly, the MIF model demonstrated good predictive capability (0.72), whereas the AHP model exhibited fair (close to good) predictive performance (0.69). Although both models performed substantially better than random predictions (AUC = 0.50), the higher AUC value obtained by the MIF model indicates greater agreement with the observed rainwater harvesting locations and suggests that the MIF approach is more reliable for identifying suitable RWH sites in the mountainous terrain of the Panjkora Basin. Nonetheless, MIF is a comparatively better model than AHP in the study area. The superior performance of the MIF model compared with the AHP model can be attributed to the complex environmental and geographical characteristics of the Panjkora Basin. The basin is characterized by rugged mountainous terrain, highly variable slopes, heterogeneous lithological formations, and diverse land-use/land-cover patterns, all of which strongly influence runoff generation and rainwater harvesting potential. Unlike the AHP method, which relies primarily on expert-derived pairwise comparisons, the MIF approach considers the relative influence and interaction among multiple environmental factors in a more flexible manner. This enables the model to better represent the spatial variability of hydrological processes within the watershed. Consequently, the MIF model produced more realistic suitability patterns, resulting in a higher AUC value and improved agreement with the locations of existing rainwater harvesting structures. Furthermore, the Panjkora Basin exhibits considerable spatial heterogeneity in rainfall distribution, drainage density, slope, soil texture, and geological conditions. These factors interact differently across the watershed, making the influence of individual parameters non-uniform. The MIF approach is better suited to capturing these variations because it evaluates the cumulative influence of multiple conditioning factors rather than relying solely on subjective pairwise judgments. This has likely contributed to its improved predictive performance compared with the AHP model.
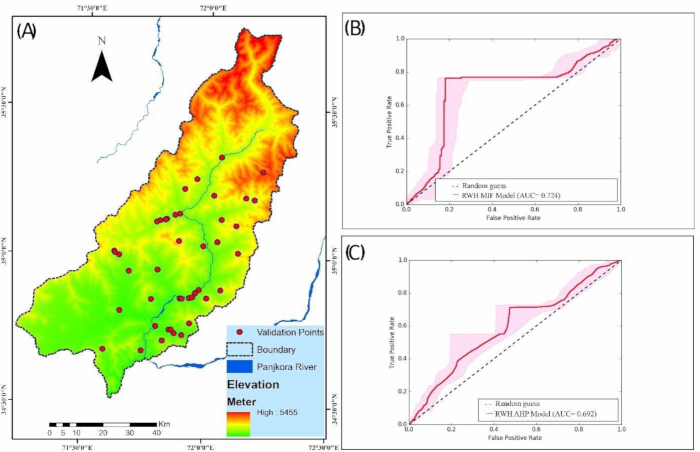
Figure 8: Validation of the rainwater harvesting suitability models using Receiver Operating Characteristic (ROC) analysis. (A) Spatial distribution of field-based validation points used for model verification; (B) ROC curve and Area Under the Curve for the Multi-Influencing Factor (MIF) model; and (C) ROC curve and AUC for the Analytic Hierarchy Process (AHP) model. Please click here to view a larger version of this figure.
DATA AVAILABILITY:
The datasets used in this study are publicly available or can be obtained from the respective organizations. The Global Precipitation Measurement (GPM) precipitation data are available from the NASA GPM mission repository (https://gpm.nasa.gov/missions/GPM). Sentinel-2 satellite imagery was obtained from the ESA Copernicus Open Access Hub (https://scihub.copernicus.eu/). The digital elevation model (DEM) was downloaded from the Alaska Satellite Facility (ASF) Distributed Active Archive Center (https://asf.alaska.edu/). The extracted data (Validation, all raster data, all metadata, Model calculations) are provided in Supplementary Files 1–8.
Supplementary File 1: GIS thematic-layer data. Spatial data used to generate the thematic GIS layers included in the rainwater harvesting suitability analysis, including the environmental and hydrological factors evaluated in the study.Please click here to download this file.
Supplementary File 2: MIF calculations. Calculations used to determine the relative influence, factor weights, and scores applied in the MIF-based rainwater harvesting suitability analysis.Please click here to download this file.
Supplementary File 3: Reclassified GIS layers and suitability thresholds. Reclassified thematic layers and the corresponding class ranges, threshold values, ranks, and suitability scores used in the MIF and AHP analyses.Please click here to download this file.
Supplementary File 4: MIF- and AHP-based suitability map results. Spatial outputs of the MIF and AHP analyses showing the resulting rainwater harvesting suitability classifications for the Panjkora River Basin.Please click here to download this file.
Supplementary File 5: Metadata for identified suitable rainwater harvesting locations. Metadata associated with the locations identified as suitable for rainwater harvesting structures, including the available spatial and site-related information.Please click here to download this file.
Supplementary File 6: Field-survey validation points. Field-survey validation data, including the geographic coordinates of the validation points used to assess the MIF- and AHP-derived rainwater harvesting suitability maps.Please click here to download this file.
Supplementary File 7: ROC analysis for the AHP model. Receiver operating characteristic (ROC) analysis data and results used to evaluate the predictive performance of the Analytical Hierarchy Process (AHP) model.Please click here to download this file.
Supplementary File 8: ROC analysis for the MIF model. ROC analysis data and results used to evaluate the predictive performance of the Multi-Influencing Factor (MIF) model.Please click here to download this file.
Discussion
This study compared two widely used GIS-based multi-criteria decision-making approaches, namely the Multi-Influencing Factor (MIF) and Analytic Hierarchy Process (AHP), for identifying suitable rainwater harvesting (RWH) sites in the mountainous Panjkora River Basin of northern Pakistan. Although both models successfully delineated potential harvesting zones, noticeable differences were observed in their spatial predictions and validation performance. The ROC-AUC analysis demonstrated that the MIF model (AUC = 0.724) performed better than the AHP model (AUC = 0.692), indicating that both models exhibit acceptable predictive capability, while the MIF approach provides greater agreement with the distribution of existing rainwater harvesting structures and field observations. The superior performance of the MIF model can be explained by the complex hydrological and geomorphological characteristics of the Panjkora Basin. The watershed is characterized by rugged mountainous terrain, highly variable slopes, heterogeneous lithology, diverse land-use patterns, and spatially variable rainfall. These environmental variables interact simultaneously to control runoff generation, infiltration, and water storage potential. Unlike the AHP approach, which relies primarily on expert-derived pairwise comparisons among criteria, the MIF technique evaluates both the relative importance and cumulative interactions among multiple conditioning factors. Consequently, MIF is better able to capture the spatial heterogeneity of mountainous catchments where runoff generation is governed by the combined influence of topography, geology, soil texture, drainage characteristics, and land cover rather than by individual factors alone. Similar observations have demonstrated that influence-based weighting approaches perform well in hydrologically heterogeneous environments because they better represent interactions among environmental variables22,34,41. The spatial distribution of highly suitable RWH zones reflects the watershed's physical characteristics. The western and southern parts of the basin were identified as the most favorable locations because they combine moderate slopes, suitable drainage density, favorable soil texture, relatively higher rainfall, and land-use conditions that promote runoff generation while remaining technically feasible for constructing harvesting structures. Moderate slopes reduce flow velocity sufficiently to facilitate runoff collection while minimizing excessive erosion and construction costs. In contrast, very steep slopes produce rapid runoff, offer limited storage opportunities, and increase structural instability, making them less suitable for constructing check dams or farm ponds. These findings align with previous studies that identified slope as a dominant control on RWH suitability in mountainous environments8,36,39. Geology also played a significant role in determining RWH suitability. In the Panjkora Basin, metamorphic rocks generally exhibit lower primary porosity and permeability than many sedimentary formations, thereby reducing infiltration losses and increasing surface runoff available for harvesting. Consequently, these formations received higher suitability weights because they enhanced runoff accumulation, which is required for surface storage structures such as check dams and farm ponds. Conversely, sedimentary formations with relatively higher permeability permit greater infiltration and groundwater recharge, reducing the volume of surface runoff available for harvesting. Similar relationships between lithology, runoff generation, and rainwater harvesting suitability have been reported earlier12,40. Land use/land cover and soil texture further influenced the spatial distribution of suitable harvesting sites. Agricultural and barren lands exhibited greater suitability because these surfaces generally generate moderate to high runoff while simultaneously providing direct opportunities for agricultural water storage and utilization. In contrast, forested areas showed comparatively lower suitability because dense vegetation intercepts rainfall, improves soil structure, and increases infiltration through extensive root systems, thereby reducing overland flow. Likewise, clay-rich and loamy soils were considered more favorable because of their relatively low permeability and greater water-holding capacity, whereas shallow rocky soils promote rapid infiltration or excessive runoff with limited storage potential. Comparable findings have been reported in previous GIS-based RWH investigations conducted in Ethiopia, Iraq, Pakistan9,18. The comparison between MIF and AHP also demonstrates the influence of the weighting strategy on suitability mapping. The AHP approach assigns criterion weights primarily through expert judgment and pairwise comparison, introducing a degree of subjectivity despite acceptable consistency ratios. In contrast, MIF evaluates both major and minor interactions among influencing factors and additionally permits weighting of parameter subclasses according to their hydrological significance. This flexible weighting framework allows MIF to better represent spatial variability in runoff-producing conditions, particularly in mountainous watersheds where environmental factors vary considerably over short distances. Similar comparative studies have reported that influence-based or hybrid multi-criteria approaches frequently outperform conventional expert-based weighting techniques under complex physiographic conditions19,44,45. The ROC-AUC validation further supports these observations. Although both models achieved acceptable predictive performance (AUC > 0.5), the higher AUC of the MIF model indicates greater agreement between the predicted suitable locations and the existing rainwater harvesting structures observed during field verification. This demonstrates that incorporating interactions among multiple hydrological and environmental variables improves the reliability of suitability assessments. Similar validation approaches using ROC analysis have been successfully applied for evaluating groundwater potential, flood susceptibility, and rainwater harvesting suitability models34,41,45. Overall, the findings confirm that integrating GIS, remote sensing, and multi-criteria decision-making techniques provides a reliable framework for rainwater harvesting planning in mountainous watersheds. Beyond identifying suitable locations, the comparative evaluation presented here provides practical evidence that model selection significantly influences the quality of suitability predictions. The improved performance of the MIF model suggests that influence-based weighting approaches are particularly appropriate for regions characterized by strong spatial variability in topography, lithology, rainfall, and land cover. Consequently, the methodology developed in this study can serve as a transferable decision-support framework for sustainable water resource planning in other mountainous and water-scarce regions with similar hydro-meteorological and physiographic conditions.
This comparative study evaluates the AHP and MIF approaches as GIS-based spatial models by analyzing various direct and indirect controlling factors to identify areas with different levels of suitability for the construction of rainwater harvesting structures. Although MIF and AHP alone have unique benefits for making spatial decisions, their comparison enables a more sophisticated multi-criteria analysis that improves the precision and robustness of site appropriateness evaluations of these techniques. For the selection of the RWH sites, rainfall, geology, soil, lineament density, drainage density, land use/cover, and topography were analyzed as responsible factors. Some additional factors like distance from roads, distance from main streams, and distance from urban settlements were also processed according to FAO criteria. The objective of developing suitable RWH sites is to improve the study area's water resource availability. With respect to RWH construction, the study area was classified into five classes on the basis of degree of suitability: less suitable, moderately suitable, suitable, highly suitable, and very highly suitable sites. During the field visit, it was found that the MIF results were more accurate than the AHP model in the mountainous terrain of the region. The MIF model results were more accurate and locally relevant because of its adaptability in managing complicated topographical variables and its capacity to combine subclasses weights and ranks. MIF allows users to rank each subclass for decision making, while on other hand, AHP allocates ranks and weights to parameters instead of subclasses of the parameters. A comparison between MIF and AHP provides a deeper understanding of how different weight-assignment strategies and decision criteria affect spatial analysis results. Better performance of the MIF approach than the AHP approach was also confirmed by the ROC-AUC score of 0.724 for MIF and 0.692 for AHP.
These methods enable more efficient decision-making for the sustainable management of water resources while minimizing costs, labor, and time. This is especially crucial because managing the world's water resources sustainably will require creative solutions amid climate change, increasing urbanization, and water scarcity. By demonstrating the efficiency of these technologies in a topographically diverse region like the Panjkora Basin, the study offers a model for similar uses in other areas with similar environmental constraints. Thus, both these models performed well and confirmed their applicability for other geographic, environmental and socio-economic regions beyond the region under investigation. New techniques like machine learning and high-resolution spatial data could be added to enhance the scalability and accuracy of MIF and AHP approaches. Real-time and automated analysis would be made possible by these developments, which are essential for dynamic and expanded applications.
Disclosures
The authors declare no conflicts of interest. None of the images and figures are AI-generated.
Author Contributions:
Shazia Gulzar: Conceptualization, Methodology, Data curation, Formal analysis, Investigation, Visualization, Writing-original draft. Muhammad Ali: Conceptualization, Supervision, Methodology, Validation, Writing, review and editing, Project administration. Abid Sarwar: Formal analysis, GIS and Remote Sensing analysis, Data interpretation, Validation, Visualization, Writing – review & editing. Hammad Gilani: Methodology, Validation, Writing, review & editing. Hassan Alsberi: Writing, review and editing, Visualization. Abdulqader M. Almars: Writing, review and editing, Formal analysis. Hasan Hashim: Validation, Writing, review & editing. El-Sayed Atlam: Formal analysis, Writing, review and editing. Ayman El Sabagh: Supervision, Writing, review & editing, Funding acquisition.
Acknowledgements
The authors would like to acknowledge the Deanship of Graduate Studies and Scientific Research of Taif University, Saudi Arabia, for funding this work.
Materials
| Name | Company | Catalog Number | Comments |
|---|---|---|---|
| ArcGIS Desktop | Esri | Version 10.3.1 | Used for GIS-based spatial data preprocessing, thematic-layer generation, reclassification, weighted-overlay analysis, and suitability mapping. |
| Digital elevation model (DEM), 12.5 m | Alaska Satellite Facility (ASF) Distributed Active Archive Center | N/A | 12.5 m spatial-resolution DEM used as the reference raster and to derive slope, drainage network, drainage density, and elevation layers; acquisition date reported as 2/12/2023 in the manuscript and should be made unambiguous. |
| Geological data | Geological Survey of Pakistan | N/A | Geological/lithological data used to generate the geology thematic layer. |
| Global Precipitation Measurement (GPM) precipitation data | National Aeronautics and Space Administration (NASA) | 2014-2023 dataset | Precipitation data used to generate the rainfall thematic layer. The exact GPM product/version and temporal statistic should be specified by the authors. |
| Global Positioning System (GPS) field-validation points | Not specified | N/A | Field-validation locations used for cross-verification and ROC-AUC assessment. GPS receiver/app manufacturer and model were not specified in the manuscript. |
| Landsat 8 imagery | Source not specified | Product/scene ID not specified | Used for lineament extraction. Authors should provide the source repository, acquisition date, product/scene ID, spatial resolution, and preprocessing details. |
| Sentinel-2B satellite imagery | European Space Agency (ESA), Copernicus | Acquired 10 September 2025 | Used for land-use/land-cover mapping with supervised Maximum Likelihood Classification. Authors should add the exact product/scene identifier and processing level. |
| Soil texture data | Directorate of Soil Survey, Khyber Pakhtunkhwa, Pakistan | N/A | Used to generate the soil-texture thematic layer. Dataset/map edition or identifier was not specified in the manuscript. |
References
- Ibrahim GRF, et al. Suitable site selection for rainwater harvesting and storage case study using Dohuk Governorate. Water. 2019;11(4):864.
- Andualem TG, et al. Groundwater recharge estimation using empirical methods from rainfall and streamflow records. J Hydrol Reg Stud. 2021;37:100917.
- Hagos YG, Andualem TG, Yibeltal M, Mengie MA. Flood hazard assessment and mapping using GIS integrated with multi-criteria decision analysis in upper Awash River basin, Ethiopia. Appl Water Sci. 2022;12(7):148.
- Mohanty S, Bardhan T, Dey A. Rain water harvesting: a viable way to combat water crisis. Food Sci Rep. 2020;1(7):44–48.
- Biswas BK, Mandal BH. Construction and evaluation of rainwater harvesting system for domestic use in a remote and rural area of Khulna, Bangladesh. Int Sch Res Notices. 2014;2014(1):751952.
- Bekbolet M, et al. Application of oxidative removal of NOM to drinking water and formation of disinfection by-products. Desalination. 2005;176(1–3):155–166.
- Jasrotia A, Majhi A, Singh S. Water balance approach for rainwater harvesting using remote sensing and GIS techniques, Jammu Himalaya, India. Water Resour Manag. 2009;23(14):3035–3055.
- Toosi AS, et al. A multi-criteria decision analysis approach towards efficient rainwater harvesting. J Hydrol. 2020;582:124501.
- Adham A, et al. Development of methodology for existing rainwater harvesting assessment in (semi-) arid regions. In: Water and Land Security in Drylands: Response to Climate Change. Springer; 2017:171–184.
- Isioye OA, Shebe M, Momoh U, Bako C. A multi criteria decision support system (MDSS) for identifying rainwater harvesting site(s) in Zaria, Kaduna State, Nigeria. Int J Adv Sci Eng Technol Res. 2012;1(1):53–71.
- Tolossa TT, Abebe FB, Girma AA. Rainwater harvesting technology practices and implication of climate change characteristics in Eastern Ethiopia. Cogent Food Agric. 2020;6(1):1724354.
- Khudhair MA, Sayl KN, Darama Y. Locating site selection for rainwater harvesting structure using remote sensing and GIS. IOP Conf Ser Mater Sci Eng. 2020;881(1):012170.
- Ahmad S, Farid S, Maryam K, Khoso AR. Smallholder farmer vulnerability and adaptation deficits: insights district Okara, Pakistan. SN Soc Sci. 2026;6(7):258.
- Kadam AK, et al. Identifying potential rainwater harvesting sites of a semi-arid, basaltic region of Western India, using SCS-CN method. Water Resour Manag. 2012;26(9):2537–2554.
- Abdulla FA, Al-Shareef AW. Roof rainwater harvesting systems for household water supply in Jordan. Desalination. 2009;243(1–3):195–207.
- Al-Ardeeni M. Selecting potential water harvest sites using GIS and remote sensing in Al-Tharthar Valley, West Nineveh, Iraq. Tikrit J Pure Sci. 2018;20(2):142–150.
- Ammar A, Riksen M, Ouessar M, Ritsema C. Identification of suitable sites for rainwater harvesting structures in arid and semi-arid regions: a review. Int Soil Water Conserv Res. 2016;4(2):108–120.
- Ejegu MA, Yegizaw ES. Potential rainwater harvesting suitable land selection and management by using GIS with MCDA in Ebenat District, Northwestern Ethiopia. J Degrad Min Lands Manag. 2020;8(1):2537.
- Khashei-Siuki A, Sharifan H. Comparison of AHP and FAHP methods in determining suitable areas for drinking water harvesting in Birjand aquifer, Iran. Groundw Sustain Dev. 2020;10:100328.
- Sarwar A, Ali M. GIS-DRASTIC integrated approach for groundwater vulnerability assessment under soil erosion hot spot areas in Northern Pakistan. Environ Earth Sci. 2024;83(18):532.
- Ali MAS, et al. Application of morphometric ranking approach using geospatial techniques for flash flood susceptibility modelling in District Shangla, Pakistan. Proc Pak Acad Sci B Life Environ Sci. 2023;60(2):243–255.
- Selvam S, et al. A GIS based identification of groundwater recharge potential zones using RS and IF technique: a case study in Ottapidaram taluk, Tuticorin district, Tamil Nadu. Environ Earth Sci. 2015;73(7):3785–3799.
- Saaty T. The analytic hierarchy process (AHP) for decision making. Kobe, Japan; 1980;1:69.
- Suliman M, Ali M. Identification of potential groundwater recharge sites in a semi-arid region of Pakistan using Saaty's Analytical Hierarchical Process (AHP). Geomat Environ Eng. 2022;16(1):53–70.
- Dweiri F, Kumar S, Khan SA, Jain V. Designing an integrated AHP based decision support system for supplier selection in automotive industry. Expert Syst Appl. 2016;62:273–283.
- Benítez J, Delgado-Galván X, Izquierdo J, Pérez-García R. An approach to AHP decision in a dynamic context. Decis Support Syst. 2012;53(3):499–506.
- Dyer JS. Remarks on the analytic hierarchy process. Manage Sci. 1990;36(3):249–258.
- Franek J, Kresta A. Judgment scales and consistency measure in AHP. Procedia Econ Finance. 2014;12:164–173.
- Kubler S, et al. Measuring inconsistency and deriving priorities from fuzzy pairwise comparison matrices using the knowledge-based consistency index. Knowl Based Syst. 2018;162:147–160.
- Chowdary V, et al. Multi-criteria decision making approach for watershed prioritization using analytic hierarchy process technique and GIS. Water Resour Manag. 2013;27(10):3555–3571.
- Vaidya OS, Kumar S. Analytic hierarchy process: an overview of applications. Eur J Oper Res. 2006;169(1):1–29.
- Ahmad H, et al. Morphometric assessment and soil erosion susceptibility mapping using ensemble extreme gradient boosting (XGBoost) algorithm: a study for Hunza-Nagar catchment, Northern Pakistan. Environ Earth Sci. 2024;83(21):605.
- Aziz SF, Abdulrahman KZ, Ali SS, Karakouzian M. Water harvesting in the Garmian Region (Kurdistan, Iraq) using GIS and remote sensing. Water. 2023;15(3):507.
- Fagbohun BJ. Integrating GIS and multi-influencing factor technique for delineation of potential groundwater recharge zones in parts of Ilesha schist belt, southwestern Nigeria. Environ Earth Sci. 2018;77(3):69.
- Hammouri N, El-Naqa A, Barakat M. An integrated approach to groundwater exploration using remote sensing and geographic information system. J Water Resour Prot. 2012;4(9):717.
- Jha MK, Chowdary V, Kulkarni Y, Mal BC. Rainwater harvesting planning using geospatial techniques and multicriteria decision analysis. Resour Conserv Recycl. 2014;83:96–111.
- Sayl KN, Mohammed AS, Ahmed AD. GIS-based approach for rainwater harvesting site selection. IOP Conf Ser Mater Sci Eng. 2020;737(1):012246.
- Emeka OJ, et al. Evaluation of the effect of hydroseeded vegetation for slope reinforcement. Land. 2021;10(10):995.
- Oweis TY. Rainwater harvesting for restoring degraded dry agro-pastoral ecosystems: a conceptual review of opportunities and constraints in a changing climate. Environ Rev. 2017;25(2):135–149.
- Islam F, et al. Modelling and mapping of soil erosion susceptibility of Murree, Sub-Himalayas using GIS and RS-based models. Appl Sci. 2022;12(23):12211.
- Nazir J, et al. Delineation and validation of GIS-based groundwater potential zones under arid to semi-arid environment using multi-influence-factors approach. Geol Ecol Landsc. 2025;9(4):1194–1210.
- Critchley WS, Chapman K, Finkel CM. Water harvesting: a manual for the design and construction of water harvesting schemes for plant production. FAO; Rome; 1991. AGL/MISC/17/91.
- Kiggundu N, et al. Rainwater harvesting knowledge and practice for agricultural production in a changing climate: A review from Uganda’s perspective. Agric Eng Int CIGR J. 2018;20(2):19–36.
- Khan AS. A comparative analysis of rainwater harvesting system and conventional sources of water. Water Resour Manag. 2023;37(5):2083–2106.
- Zheng X, et al. Rainwater harvesting for agriculture development using multi-influence factor and fuzzy overlay techniques. Environ Res. 2023;238:117189.