This protocol integrates microbial metabolite target prediction, rectal mucosal transcriptomics, protein–protein interaction and pathway enrichment, molecular docking, molecular dynamics simulation, and Molecular mechanics/Poisson–Boltzmann surface area (MM-PBSA) binding free-energy estimation to generate a ranked, hypothesis-generating shortlist of candidate metabolite-associated host genes and structurally prioritized protein–ligand complexes for experimental follow-up.
Method Article
A Computational Workflow for Prioritizing Microbial Metabolite-Associated Host Genes in Constipation-Predominant Irritable Bowel Syndrome
In This Article
Summary
Abstract
No standardized computational pipeline exists for systematically prioritizing microbial metabolite-associated host genes and protein-ligand complexes from publicly available chemical, genomic, and structural databases. This article describes an eight-stage workflow that accepts a user-defined set of gut microbiota-derived metabolites and produces a ranked shortlist of candidate metabolite-associated host genes, enriched biological pathways, and structurally prioritized protein-ligand complexes for experimental follow-up. The pipeline integrates (i) chemoinformatic metabolite profiling; (ii) multi-database candidate target prediction using protein-chemical interaction and ligand-based target-prediction tool and a molecular docking program; (iii) differential gene expression analysis of publicly available transcriptomic data; (iv) target-differentially expressed gene overlap; (v) protein-protein interaction network construction and pathway enrichment; (vi) molecular docking with a molecular docking program; (vii) 200 ns molecular dynamics simulation using a molecular dynamics engine with a protein force field used for molecular dynamics simulations; and (viii) MM-PBSA binding free-energy estimation. As a worked example, nine gut microbiota-derived or microbiota-modified metabolites representing short-chain fatty acids, bile acids, tryptophan-derived metabolites, and urolithin A were processed using the public IBS-C rectal mucosal transcriptomic dataset GSE36701. The workflow ranked 17 unique predicted metabolite-associated genes that were differentially expressed in this dataset. Docking, molecular dynamics simulation, and MM-PBSA analyses structurally prioritized five metabolite-protein complexes: lithocholic acid-VDR, lithocholic acid-NR1H4/FXR, ursodeoxycholic acid-NR1H4/FXR, tryptamine-HTR2A (simulated in an explicit 1-Palmitoyl-2-oleoyl-sn-glycero-3-phosphocholine (POPC) lipid bilayer), and urolithin A-CASP3. The protocol is designed to be adaptable to other metabolite sets, disease transcriptomic datasets, and target classes; all outputs are hypothesis-generating computational predictions that require independent transcriptomic replication, protein-level validation, and functional ligand-response assays before causal or therapeutic conclusions can be drawn.
Introduction
Irritable bowel syndrome with constipation (IBS-C) is a prevalent functional gastrointestinal disorder characterized by recurrent abdominal pain, altered bowel habits, bloating, and constipation, with a global prevalence estimated at approximately 10–15% of the general population1,2. Current pharmacological therapies, including secretagogues, prokinetics, and antispasmodics, can improve individual symptoms in a subset of patients; however, treatment response remains heterogeneous and durable remission is infrequently achieved, reflecting the complex, multifactorial pathobiology of the condition1,3,4. A more complete mechanistic understanding of how gut microbial signals are transduced at the mucosal level is therefore required to generate testable hypotheses for novel therapeutic targets.
The gut microbiota contributes to lower gastrointestinal homeostasis through the production and biotransformation of chemically diverse metabolites, including short-chain fatty acids (SCFAs), secondary bile acids, tryptophan-derived compounds, and polyphenol-derived metabolites such as urolithins5,6,7,8. These molecules communicate with host cells through a broad and incompletely characterized repertoire of molecular targets that extends well beyond canonical metabolite-sensing membrane receptors to encompass nuclear receptors, cytosolic enzymes, histone-modifying proteins, peptide hormone precursors, and intracellular signaling proteins9. Altered gut microbial community composition and metabolite profiles have been documented in patients with irritable bowel syndrome (IBS), providing a biological rationale for investigating whether host genes associated with microbial metabolite responsiveness are transcriptionally perturbed in IBS-C rectal mucosa10.
The nine-metabolite panel was defined a priori to provide a compact, chemically diverse, and biologically interpretable set of gut microbiota-derived or microbiota-modified small molecules. Selection was based on five criteria: representation of major microbial metabolite classes involved in host-microbiota signaling; known or plausible distal intestinal mucosal exposure; availability of unambiguous PubChem identifiers and canonical structures; molecular size and structural tractability for ligand-based target prediction and docking; and prior plausibility for epithelial, neuroimmune, enteroendocrine, nuclear-receptor, or motility-related signaling in IBS-C. The selected panel included butyrate and propionate as SCFAs; chenodeoxycholic acid, lithocholic acid, and ursodeoxycholic acid as bile acids; tryptamine, indole-3-propionic acid, and indole-3-lactic acid as tryptophan-derived metabolites; and urolithin A as a gut microbiota-derived polyphenol metabolite5,6,7,8,9,10.
Most prior computational and experimental investigations have examined individual metabolite–receptor or metabolite–enzyme pairs in isolation, an approach that does not capture the distributed, convergent nature of microbial metabolite signaling across host pathways9,11. Integration of multiple analytical stages confers a mutually reinforcing filtering power that no single stage can provide independently. Computational target prediction against curated databases yields a broad set of candidate host proteins for each metabolite. Intersection with disease-relevant transcriptomic data substantially filters this set, retaining only candidates whose transcripts are altered in the disease context. Pathway enrichment and protein–protein interaction network analyses then map the reduced candidate list to known biological modules. Molecular docking provides an initial computational assessment of binding pocket complementarity for each candidate complex, and an additional 200 ns molecular dynamics (MD) simulation with MM-PBSA binding free-energy decomposition provides a time-resolved, thermodynamic dimension to structural prioritization that is not available from docking scores alone. Performing each step independently, without systematic integration and sequential filtering, would result in candidate lists that are too broad to be experimentally tractable and would fail to detect convergent pathway architecture.
Within the framework of this whole protocol, by the term “metabolite-associated gene” (MAG), we mean a human gene, the protein product of which has been nominated as a putative molecular target of one or more gut microbiota-derived metabolites by at least one curated computational prediction database, and whose transcript is differentially expressed in the disease-relevant transcriptomic dataset used to demonstrate the workflow. This operational definition deliberately includes membrane receptors plus nuclear receptors, cytosolic enzymes, signaling proteins, peptide hormone precursors, and other intracellular proteins. MAG designation is not experimental evidence that a metabolite binds, forms a protein–ligand complex, activates a receptor, changes protein abundance, or causes disease, but a computationally derived, hypothesis-generating nomination that requires experimental validation.
This protocol describes the full eight-stage computational workflow (Figure 1) with enough operational detail to enable independent replication, adaptation to other metabolite panels or disease datasets, and extension to other host-microbiota interaction contexts. The workflow is explicitly scoped as a hypothesis-generation and structural-prioritization framework that operates exclusively on publicly available omics and structural resources and does not infer altered metabolite concentrations, receptor activation states, protein expression changes, downstream signaling activity, or clinical significance from computational outputs alone. Here, we demonstrate the protocol as a worked example using nine gut microbiota-derived or microbiota-modified metabolites and the public IBS-C rectal mucosal transcriptomic dataset GSE36701, with the goal of identifying MAGs and prioritizing metabolite–protein complexes for subsequent experimental follow-up.
Protocol
The analysis used only publicly available, de-identified transcriptomic data from GSE36701 and publicly available chemical, protein, and structural databases. The databases were accessed between January and May 2026. Any later access date was documented in the separate Table of Materials.
1. Study design, hardware, and software requirements
- Define the workflow before beginning analysis. Use eight stages: metabolite selection, target prediction, differential-expression analysis, target, Differentially expressed gene (DEG) overlap, Protein–protein interaction (PPI) /pathway enrichment, molecular docking, MD simulation, and MM-PBSA estimation.
- Record that docking, MD, and MM-PBSA are structural prioritization tools only. Do not interpret these outputs as experimental evidence of binding, receptor activation, protein abundance change, therapeutic efficacy, or disease causality.
- Confirm the compute hardware before running MD simulations. Use a 64-bit Linux OS, a 6-core CPU or better, a GPU-acceleration platform with ≥8 GB VRAM, or an equivalent GPU-acceleration platform with ≥8 GB VRAM with at least 8 GB VRAM, 32 GB RAM minimum, and at least 200 GB free storage per MD system.
- Record core software: a molecular dynamics engine, a molecular docking of metabolite ligands to target proteins, chemical file-format conversion12, three-dimensional ligand generation, ligand preparation, a docking-input preparation toolkit, a molecular docking of metabolite ligands to target proteins, a general-purpose programming environment, a statistical computing environment with bioinformatics software framework, and a differential gene-expression analysis package.
- Record structural-analysis tools: web-based membrane-system construction tool, CHARMM-compatible ligand parameterization service, molecular mechanics/continuum-solvent binding-energy calculation tool, molecular topology and parameter conversion library, three-dimensional molecular visualization program, and molecular visualization and two-dimensional interaction-diagram tool 2021 (see Table of Materials for download links and version information).
- Record exact protein force field used for molecular dynamics simulations, CGenFF, CHARMM-GUI, R/bioinformatics software framework, and molecular mechanics/continuum-solvent binding-energy calculation tool release identifiers in the Table of Materials/environment file. Mark absent identifiers as “not recoverable”; do not infer them.
2. Metabolite selection and chemoinformatic characterization
- Define the metabolite panel before target prediction. Include butyrate (PubChem CID: 264), propionate (CID: 1032), chenodeoxycholic acid (CID: 10133), lithocholic acid (CID: 9903), ursodeoxycholic acid (CID: 31401), tryptamine (CID: 1150), indole-3-propionic acid (CID: 3744), indole-3-lactic acid (CID: 92904), and urolithin A (CID: 5488186).
- Retrieve the canonical Simplified Molecular Input Line Entry System (SMILES) and PubChem CID for each metabolite. Verify synonyms and duplicate structures before target prediction. Store the final identifiers in the metabolite master sheet.
- Submit the canonical SMILES strings to the physicochemical-property and ADME-prediction web tool13 (see Table of Materials). Record molecular weight, Topological polar surface area (TPSA), consensus logP, hydrogen-bond donors, hydrogen-bond acceptors, rotatable bonds, predicted gastrointestinal absorption, P-glycoprotein prediction, and Lipinski, Veber, Ghose, Egan, Muegge, and PAINS alerts.
- Retain metabolites with successful structure recognition, molecular weight ≤500 Da, and no PAINS alerts. Record any failed criterion and the decision to retain or exclude the metabolite.
- Assign ionization states before downstream target prediction and docking. Use deprotonated carboxylates for butyrate and propionate, neutral carboxylic acid forms for bile acids, protonated ammonium for tryptamine, and neutral forms for the remaining metabolites.
3. Candidate human target prediction
- Open a chemical-protein interaction target prediction14 (see Table of Materials). Enter each metabolite name or PubChem CID, select Homo sapiens (taxonomy ID: 9606), and set the minimum combined interaction score to ≥0.700.
- Prioritize experimental and curated database evidence channels in a chemical-protein interaction target prediction. Download the complete protein-association table for each metabolite.
- Open a molecular docking program15 (see Table of Materials). Submit each canonical SMILES string with Homo sapiens selected and retain targets with probability ≥0.70.
- Merge the chemical-protein interaction target prediction and the molecular docking program outputs as a union set for each metabolite. Retain any target meeting either database threshold and remove exact duplicate gene-symbol entries.
- Standardize protein entries to HUGO Gene Nomenclature Committee (HGNC)- approved gene symbols using mapping protein identifiers to standardized HGNC-approved gene symbols or the integrated human gene-information database (see Table of Materials). Resolve aliases, outdated symbols, and isoform annotations to one gene symbol per protein.
- Classify each target as a membrane receptor, nuclear receptor, enzyme, intracellular signaling protein, peptide hormone, hormone-related protein, or other intracellular protein. Record the class in the target table.
4. Transcriptomic dataset and differential gene expression analysis
- Access GSE36701 through the NCBI web-based differential gene-expression analysis tool16,17 (see Table of Materials). Record that the dataset includes rectal mucosal biopsy expression data from IBS-C, Diarrhea-predominant irritable bowel syndrome (IBS-D), post-infectious IBS, and healthy volunteer groups18.
- Search GEO and ArrayExpress for an independent validation cohort. Use combinations of IBS-C, constipation-predominant irritable bowel syndrome, rectal mucosa, colonic mucosa, biopsy, transcriptome, microarray, and RNA-seq. Record the repositories, search terms, search date, and whether a comparable validation dataset was identified.
- Launch web-based differential gene-expression analysis tool from the GSE36701 record (see Table of Materials). Assign the 18 IBS-C samples to the IBS-C group, assign the 40 healthy volunteers to the control group, and leave IBS-D and post-infectious IBS samples unassigned.
- Run differential-expression analysis using the differential gene-expression analysis package framework with Benjamini-Hochberg False discovery rate (FDR) correction19. Download the complete results table with probe ID, gene symbol, gene title, logFC, AveExpr, moderated t-statistic, raw P-value, and adjusted P-value.
- Collapse probes to gene-level entries. Remove probes lacking gene symbols; retain the probe with the lowest FDR for duplicate symbols; and use the larger absolute logFC as the tiebreaker.
5. Target-deg overlap analysis and statistical assessment
- Intersect each metabolite-specific predicted target list with the gene-level DEG list at FDR < 0.05. Record the overlapping genes, metabolite of origin, logFC, adjusted P-value, and expression direction.
- Merge the metabolite-specific overlap lists into a non-redundant MAG list. Count total predicted targets, metabolite-specific overlaps, and total unique MAGs.
- Assess probe-level directional consistency for genes with multiple probes. Flag any gene for which probes disagree in expression direction.
- Construct the Fisher’s exact-test contingency table using total gene-collapsed entries, total DEGs, total unique predicted targets, and observed MAGs. Calculate the one-tailed P-value, odds ratio, and 95% confidence interval with the Fisher’s exact test implementation.
- If the background DEG rate exceeds 50%, report the overlap as descriptive rather than independently validated enrichment. Treat uniform downregulation as a descriptive directional pattern unless a separate directionality test is performed.
6. Protein-Protein Interaction Network Analysis and Pathway Enrichment
- Submit the complete unique MAG list to protein-protein interaction network construction and pathway enrichment20 (see Table of Materials). Select Homo sapiens and set the minimum interaction score to 0.700.
- Export the combined Protein-protein interaction network construction and pathway enrichment network and the full interaction table. If text-mining produces an artifactually dense topology, deselect text-mining and retain experimental, co-expression, and database channels.
- Generate metabolite-class subnetworks for SCFA-associated, bile-acid-associated, and tryptamine/serotonergic MAGs. Use the same Protein-protein interaction network construction and pathway enrichment organism and confidence settings.
- Run Protein-protein interaction network construction and pathway enrichment against Kyoto Encyclopedia of Genes and Genomes (KEGG)21, Reactome22, and Gene Ontology (GO) Biological Process23,24. Apply Benjamini–Hochberg BH FDR <0.05 and export all enrichment tables.
7. Molecular docking
- Retrieve experimentally determined receptor structures from Research Collaboratory for Structural Bioinformatics Protein Data Bank RCSB PDB25 (see Table of Materials). Use VDR/1DB1, NR1H4/FXR/3DCT, CASP3/2DKO, and HTR2A/6A93 for the five prioritized protein-ligand complexes.
- Prepare each receptor by retaining chain A and removing water, co-crystallized ligands, cofactors, ions, and non-protein HETATM records. For 6A93, remove the T4 lysozyme fusion segment before receptor preparation.
- Add polar hydrogens, assign Gasteiger charges, and save each receptor as PDBQT with the molecular-structure toolkit. Inspect binding-site histidine protonation states before PDBQT conversion and document the selected states.
- Generate each ligand's 3D structure in the chemical structure file-conversion toolkit. Energy-minimize with Universal Force Field (UFF) for 500 steps, assign the pH 7.4 ionization state, assign Gasteiger charges, and save as PDBQT.
- Define a 25 Å x 25 Å x 25 Å docking box centered on the co-crystallized ligand centroid. Use centers of (10, 19, 33) for VDR, (137, 31, 78) for FXR, (37, 34, 32) for CASP3, and (12, −1, 61) for HTR2A.
- Run a molecular docking of metabolite ligands to target proteins26,27 with exhaustiveness = 8, seed = 42, num_modes = 9, and energy_range = 3 kcal/mol. Record the top-ranked Vina score and Root-mean-square deviation (RMSD) values for all poses.
- Select mode 1 for each prioritized complex. Generate two-dimensional ligand-residue diagrams in a molecular visualization and a two-dimensional interaction-diagram tool, and three-dimensional receptor-ligand views in a three-dimensional molecular visualization program.
- Perform redocking controls for VDR/1DB1 and FXR/3DCT. Accept the receptor docking setup when heavy-atom RMSD is <2.0 Å relative to the crystallographic pose.
- Perform cross-docking controls by docking Lithocholic acid (LCA) into CASP3 and tryptamine into VDR. Compare cognate and non-cognate scores and record cases where the score difference is <1.0 kcal/mol.
8. Molecular dynamics simulation
- Generate ligand parameters with CHARMM-compatible ligand parameterization service28 (see Table of Materials). Inspect all penalty scores and flag any parameter with a penalty >50.
- Convert ligand stream files to molecular dynamics engine-compatible .itp and .prm files with the force-field topology-conversion script. Combine ligand and protein topology files for each complex.
- Apply hydrogen mass repartitioning with molecular topology and parameter conversion library. Generate aqueous topologies with the protein force field used for molecular dynamics simulations29 and an explicit three-site water model30.
- Solvate aqueous complexes in a dodecahedral box with at least 1.2 nm solute-edge clearance. Neutralize the systems and add NaCl to 0.15 M.
- Build the tryptamine-HTR2A membrane system with a web-based membrane-system construction tool31,32,33 (see Table of Materials). Use membrane-protein orientation database-aligned receptor coordinates34 (see Table of Materials), a pure POPC bilayer, 22.5 Å water layers, and 0.15 M NaCl.
- Energy-minimize all systems by steepest descent for up to 50,000 steps. Confirm convergence at Fmax <1000 kJmol-1nm-1 before equilibration.
- Equilibrate aqueous systems with Constant number of particles, volume, and temperature ensemble (NVT) and Constant number of particles, pressure, and temperature ensemble (NPT) phases. Equilibrate the membrane system using the six-step web-based multistage molecular-system preparation and equilibration workflow with gradually released restraints.
- Run 200 ns production MD for all five complexes. Use a 4 fs timestep with Hydrogen mass repartitioning HMR, V-rescale thermostat at 310 K, Parrinello-Rahman barostat at 1 bar, Particle mesh Ewald (PME) electrostatics35, and LINCS constraints36.
- Analyze the final trajectories with molecular dynamics trajectory-analysis utilities. Calculate backbone RMSD, Cα Root-mean-square fluctuation (RMSF), radius of gyration, Solvent-accessible surface area (SASA), and protein-ligand hydrogen bonds using the final 150 ns as the primary analysis window.
9. MM-PBSA binding free-energy estimation
- Extract trajectory snapshots for MM-PBSA analysis. Use 2,001 frames for each aqueous complex and 201 processed frames for the membrane-embedded HTR2A subsystem.
- Run molecular mechanics/continuum-solvent binding-energy calculation tool37 with Poisson-Boltzmann solvation, interior dielectric constant = 1, exterior dielectric constant = 80, SASA-based nonpolar solvation, and no entropy correction. Report the mean binding free energy and standard deviation.
- Perform per-residue decomposition for all five complexes. Report stabilizing and destabilizing residues with absolute contributions ≥0.5 kcalmol−1.
Results
Candidate metabolite-associated targets
The nine metabolites produced heterogeneous predicted target sets across a chemical-protein interaction target prediction and a molecular docking program. Propionate, tryptamine, bile acids, and urolithin A yielded several targets with known relevance to gastrointestinal signaling. The predicted target landscape included canonical membrane receptors, nuclear receptors, intracellular enzymes, signaling proteins, and peptide hormone-related proteins. Downstream results are therefore described as metabolite-associated genes (MAGs) rather than receptor-only findings (Table 1).
Benchmarking against reported metabolite-protein interactions
To benchmark the target-prediction output against existing experimental knowledge, predicted metabolite-associated target relationships were classified into three evidence levels: (i) experimentally supported direct or close class-level metabolite-protein interactions, where the metabolite or a closely related endogenous metabolite has been reported to bind, activate, inhibit, or functionally regulate the encoded protein; (ii) pathway- or target-class-supported interactions, where the predicted target belongs to an established metabolite-responsive pathway or receptor family but direct evidence for the exact metabolite-protein pair is limited; and (iii) computational-only associations for which no direct experimental interaction was identified in the literature reviewed. This benchmarking was used to contextualize, not validate, the predicted MAGs.
Several predictions recapitulated previously reported biology. Propionate-FFAR2 was treated as experimentally supported because FFAR2/GPR43 is a canonical short-chain fatty acid receptor. Butyrate-HDAC3 was classified as experimentally or class-supported because butyrate is a recognized histone deacetylase inhibitor, and the predicted overlap involved an HDAC-family member. Bile-acid-associated predictions involving NR1H4/FXR and VDR were considered supported by established bile-acid nuclear receptor biology, particularly for hydrophobic bile acids such as LCA; Ursodeoxycholic acid (UDCA)- associated FXR predictions were interpreted with caution because UDCA is generally a weaker or context-dependent FXR ligand. Tryptamine-associated HTR1B, HTR2A, HTR2B, and HTR6 predictions were classified as serotonergic-pathway-supported rather than confirmed direct receptor-specific interactions, because tryptamine is a microbial tryptophan-derived monoamine and serotonin receptors are established regulators of gastrointestinal motility and secretion. Urolithin A-CASP3 was considered pathway-supported by published links between urolithin A and apoptotic/caspase-related responses, but not by direct evidence of CASP3 binding. Indole-3-lactic acid-KYAT1 and indole-3-propionic acid-KYAT1 were retained as computational-only hypotheses because the broader literature supports host signaling by microbial indole derivatives, but not direct KYAT1 binding by these exact metabolites7,8,38,39,40.
Accordingly, Table 1 distinguishes computational target nomination from the level of prior experimental or pathway support. It also provides, for each target, the prediction source (a chemical-protein interaction target prediction, a molecular docking program, or both), the combined interaction score for the chemical-protein interaction target prediction, and the molecular docking program probability when the target was identified by a molecular docking program. Predicted targets without direct prior experimental evidence are described as candidate metabolite-associated genes that require independent protein-level and ligand-response validation.
Overlap between predicted targets and IBS-C differentially expressed genes
The intersection of the union-combined predicted target lists and the gene-level differential expression results identified 17 unique predicted metabolite-associated genes that were significantly differentially expressed in the IBS-C versus healthy volunteer comparison. All 17 genes were downregulated. The set included membrane and nuclear receptors (CASR, FFAR2, GPR68, HTR1B, HTR2A, HTR2B, HTR6, NR1H4, TBXA2R, VDR) and non-receptor proteins (CASP3, GCG, GNAQ, GPHN, HDAC3, KYAT1, MLN) (Table 1, Figure 2A,B).
All 17 MAGs met a false discovery rate (FDR) threshold below 0.05; 16 of 17 met the more stringent FDR < 0.001, with the remaining gene (HTR1B) significant at FDR < 0.05. Seven of the 17 targets (CASP3, GCG, GNAQ, GPHN, GPR68, HDAC3, TBXA2R) satisfied both FDR < 0.001 and an absolute log2 fold change exceeding 1.0 (logFC range −1.34 to −1.10), indicating strong and consistent downregulation for this subset. The remaining targets exhibited moderate but statistically significant downregulation (|logFC| ranging from 0.45 to 0.97). This uniform descriptive pattern was interpreted with caution, considering the dataset's genome-wide expression characteristics (see statistical assessment below).
Statistical assessment of the target-DEG overlap
To formally assess the statistical significance of the 17-gene overlap, a one-tailed Fisher’s exact test was applied using the 17 predicted target genes as the query set and all 18,296 unique gene-collapsed entries detected in GSE36701 as the genomic background. Of this background, 17,296 genes (94.5%) were differentially expressed at FDR < 0.05, reflecting near-universal transcriptional suppression in the IBS-C rectal mucosal comparison. All 17 predicted target genes were among the differentially expressed genes (observed overlap 17/17, 100%). Given the 94.5% background differential-expression rate, the expected overlap for any randomly selected 17-gene set is 16.1 genes. Fisher’s exact test yielded p = 0.384 with a continuity-corrected odds ratio of 2.03 (95% confidence interval 0.12–33.73), which was not statistically significant at α = 0.05 (Figure 3A–C).
This result indicates that the observed 17/17 overlap does not exceed the overlap expected by chance under the genome-wide expression profile of this dataset. Accordingly, these findings are interpreted as a descriptive directional pattern, in which all 17 predicted targets were consistently and significantly downregulated in IBS-C rectal mucosal tissue, rather than as evidence of statistical enrichment or independent validation over a genomic background. Formal enrichment testing would require replication in transcriptomic datasets with more selective differential-expression profiles, in which substantially fewer than half of all genes reach significance. It should be emphasized that the uniform downregulation of all 17 overlapping genes is a descriptive observation rather than a separately validated statistical result, because the differentially expressed background of this dataset is itself predominantly downregulated, a shared downward direction among the overlapping genes is expected and was not subjected to a formal directionality test. This uniform direction should therefore not be interpreted as independent statistical evidence of coordinated, metabolite-specific regulation.
Metabolite-specific patterns
Propionate had the largest number of overlapping genes, including CASR, FFAR2, GCG, GNAQ, GPHN, GPR68, MLN, and TBXA2R, suggesting possible involvement of short-chain fatty acid-responsive and Gq-associated signaling. Butyrate overlapped with HDAC3, consistent with butyrate-associated histone deacetylase biology, although mRNA downregulation alone does not establish altered butyrate responsiveness. Bile acid-associated overlaps included the nuclear receptors VDR and NR1H4, both recognized effectors of bile acid signaling in the gut38,39. Tryptamine overlapped with HTR1B, HTR2A, HTR2B, and HTR6, implicating serotonergic signaling as a candidate module, a system with well-established roles in gastrointestinal motility and secretion40. Indole-3-lactic acid and indole-3-propionic acid overlapped with KYAT1, and urolithin A overlapped with CASP3.
Pathway enrichment
Functional enrichment analysis of the 17 overlapping genes identified pathways related to G protein-coupled receptor (GPCR) downstream signaling, Gαq signaling, GPCR ligand binding, serotonergic synapse, neuroactive ligand-receptor interaction, calcium signal transduction, cAMP signaling, and peptide hormone secretion. These results are consistent with the gene set's composition and support its biological coherence, but they reflect the functional annotation of the submitted genes rather than independent evidence of pathway-level activity.
Protein–protein interaction network structure
Protein-protein interaction network construction and pathway enrichment analysis were interpreted across three complementary networks. In the combined 17-gene meta-network (Network 1), the most evident annotation-supported structure was a GNAQ-centered GPCR/Gαq signaling component linking GNAQ to receptor-associated genes, including TBXA2R, CASR, HTR2A, and HTR2B. Limited serotonin receptor connectivity was also retained, most prominently between HTR2A and HTR2B, while several other genes remained isolated or weakly connected at the selected confidence threshold. The propionate-specific network (Network 2) showed a more restricted topology, with GNAQ retaining annotation-supported links to CASR and TBXA2R, whereas FFAR2, GPR68, GCG, GPHN, and MLN were isolated or weakly connected. The tryptamine/serotonin network (Network 3) included HTR1B, HTR2A, HTR2B, and HTR6; within this subset, HTR2A and HTR2B showed the principal annotation-supported connection, while HTR1B and HTR6 were not directly connected at the chosen threshold (Figure 4A–C).
Molecular docking
Molecular docking was performed on five selected metabolite-protein complexes. The bile acid-nuclear receptor pairs showed more favorable Vina scores than urolithin A-CASP3 and tryptamine-HTR2A. LCA-VDR had the best score at −10.0 kcal/mol, followed by LCA-NR1H4/FXR (−9.9 kcal/mol) and UDCA-NR1H4/FXR (−9.4 kcal/mol). Urolithin A-CASP3 and tryptamine-HTR2A had lower but still reasonable scores of −7.1 kcal/mol (Table 2).
For the LCA-VDR complex (PDB ID: 1DB1), the predicted pose was supported by a conventional hydrogen bond between the LCA carboxylate oxygen and Ser278 (4.29 Å), together with extensive hydrophobic contacts involving Leu230, Val234, Trp286, Val300, His305, Tyr295, Leu233, and His397, and additional van der Waals contacts with Met272, Leu313, Ile271, Ile268, Leu309, Phe422, Val418, Ala231, Ala303, Cys288, Ser275, and Phe150. The top-ranked pose had a Vina score of −10.0 kcal/mol, a cavity size of 2055 Å3, and a grid center of (10, 19, 33) (Table 3, Figure 5A,B).
For the LCA-NR1H4/FXR complex (PDB ID: 3DCT), the docking score of −9.9 kcal/mol was accompanied by predicted hydrogen bonds involving His294 and Ile335, a π-Sigma interaction with His294, and hydrophobic Alkyl or π-Alkyl contacts involving Met290, Met328, Ala291, Leu287, Ile352, and His447, with further van der Waals contacts supporting accommodation of the steroidal scaffold in the FXR pocket (Table 4, Figure 6A,B).
The predicted pose of the UDCA-NR1H4/FXR complex (PDB ID: 3DCT) showed a conventional hydrogen bond with His447 (3.66 Å), another hydrogen bond with Gly322 (3.46 Å), a π-Anion interaction with Val325 (4.96 Å), and a carbon-hydrogen bond with Trp469 (4.51 Å). The interaction map also identified unfavorable donor-donor contacts with Arg395 (3.89 Å) and Gln396 (3.40 Å), suggesting that the lower Vina score of UDCA compared to LCA in the same receptor pocket may be due to less favorable local geometry or electrostatics (Table 5, Figure 7A,B).
In the urolithin A-CASP3 complex (PDB ID: 2DKO), the predicted binding mode featured conventional hydrogen bonds with Gln161 (3.78 and 4.19 Å), Ser120 (3.95 Å), and Arg207 (3.05 and 3.77 Å), and was further stabilized by π-Cation interactions with Arg207, a π-Donor hydrogen bond with Cys163, and additional π-Alkyl and van der Waals contacts involving Arg64, Ala162, His121, Ser205, and Trp206 (Table 6, Figure 8A,B).
For the tryptamine-HTR2A complex (PDB ID: 6A93), the predicted pose was stabilized by an electrostatic salt bridge between the protonated amine of tryptamine and Asp155, the conserved transmembrane helix 3 aspartate (D3.32 in Ballesteros-Weinstein numbering) that anchors the protonated amine of aminergic ligands across serotonin and related receptors41,42,43, together with hydrogen bonding with Thr160 and Ser159, aromatic contacts with Phe340 and Trp336, and π-Alkyl interactions with Val156 and Ile163. Additional van der Waals contacts with Tyr370, Phe339, Ser242, Phe243, Phe332, and Leu123 supported an orthosteric pocket-binding pattern (Table 7, Figure 9A,B).
Docking protocol validation
To evaluate the reliability of the docking protocol, two complementary control experiments were performed. For redocking (positive) controls, co-crystallized ligands were extracted from their reference X-ray structures and re-docked into their native binding sites. The top-ranked predicted pose for the vitamin D analog VDX in VDR/1DB1 deviated 0.87 Å from the crystallographic position, and the co-crystal ligand WAY-362450 in FXR/3DCT deviated 1.79 Å; both values fell below the conventional 2.0 Å acceptance threshold, supporting the geometric validity of the docking protocol for these receptor systems (Figure 10A,B). For cross-docking (negative) controls, lithocholic acid was docked into caspase-3 (2DKO), a cysteine protease for which it is not a known ligand, yielding a predicted score (−8.3 kcal/mol) 1.7 kcal/mol weaker than at its cognate target VDR (−10.0 kcal/mol), consistent with predicted binding-site selectivity. Tryptamine docked into VDR yielded a predicted score of −6.4 kcal/mol compared with −7.1 kcal/mol at its cognate HTR2A target, a difference of 0.7 kcal/mol that lies within the reported uncertainty of a molecular docking of metabolite ligands to target proteins scores and therefore indicates only modest predicted selectivity for this smaller ligand (Figure 10C). Taken together, these controls indicate that the docking protocol reproduces known binding geometries and discriminates cognate from non-cognate pairs under the conditions tested, while remaining computational predictions that do not substitute for experimental affinity measurements (Table 8).
Molecular dynamics simulation
Molecular dynamics simulations were completed for the five prioritized complexes over 200 ns production trajectories. The four soluble and nuclear receptor complexes were simulated in explicit aqueous solvent, while the tryptamine-HTR2A complex was simulated in an explicit POPC lipid bilayer to provide a physiologically appropriate membrane environment for this G protein-coupled receptor. Analyses tested the dynamic stability of the docked poses under time-dependent conditions and allowed comparison of relative structural behavior across complexes (Table 9).
The RMSD profile of the LCA-VDR/1DB1 complex showed a short equilibration period during the first 10 ns, followed by a stable plateau, with fluctuations mainly in the range of 0.20–0.28 nm (Figure 11A). RMSF values were low, and backbone fluctuations were < 0.15 nm for most residues (Figure 11B). Hydrogen-bond analysis showed a persistent network of 2–5 hydrogen bonds, with occasional increases to 7 (Figure 11C). The radius of gyration (Rg) was kept within the range of 1.25–1.75 nm, and the solvent-accessible surface area (SASA) was kept around 130 nm2 (Figure 11D,E).
The urolithin A-CASP3/2DKO complex exhibited greater dynamic activity. The RMSD initially increased and then oscillated between 0.4 and 0.7 nm, with a brief high-deviation event around 165 ns (Figure 12A). RMSF analysis showed high mobility at the residue level, with the largest fluctuations in the flexible loop region around residue 175 (Figure 12B). Hydrogen-bond analysis revealed an initial extensive network of about 2–5 bonds for the first 30–40 ns, followed by mostly 0 to 2 intermittent bonds (Figure 12C). The corresponding radius-of-gyration and SASA profiles are shown in Figure 12D,E.
For the NR1H4/FXR (3DCT) bile-acid systems, the backbone RMSD profile remained within a relatively narrow range over most of the trajectory (Figure 13A), while the RMSF profile showed lower mobility in core regions and higher fluctuations in flexible regions (Figure 13B). The LCA-3DCT complex maintained approximately three to four persistent hydrogen bonds throughout the trajectory, whereas the UDCA-3DCT complex exhibited greater hydrogen-bond fluctuation and a reduction in hydrogen bonding after approximately 125 ns. Radius-of-gyration profiles for the LCA- and UDCA-bound systems are shown in Figure 13C,D, respectively, and the corresponding SASA profiles are shown in Figure 13E,F.
Membrane molecular dynamics of the tryptamine-HTR2A complex
The tryptamine-HTR2A/6A93 complex was simulated for 200 ns within an explicit POPC lipid bilayer comprising 258 lipid molecules, an explicit three-site water model, and 0.15 M NaCl, for a total system size of approximately 100,925 atoms33,44,45. The receptor remained stably embedded in the bilayer throughout the trajectory (Figure 14). Backbone RMSD rose from approximately 0.10 nm to a stable plateau near 0.15–0.20 nm within the first 100 ns and remained stable thereafter, with all values below 0.25 nm, indicating that the receptor maintained a stable conformation in the membrane environment without global unfolding (Figure 15A). Per-residue RMSF showed low fluctuations in the transmembrane helical core with expected higher mobility in loop and terminal regions, consistent with typical GPCR flexibility (Figure 15B). The radius of gyration was tightly confined between approximately 2.06 and 2.12 nm, and SASA fluctuated within a narrow band without progressive drift, both confirming preservation of the compact transmembrane bundle (Figure 15C,D).
Hydrogen bonding between the protein and the ligand was maintained throughout the trajectory (Figure 15E), with major fluctuations in the number of hydrogen bonds, ranging from 1 to 3. To specifically evaluate the persistence of the key ionic interaction, the minimum distance between the protonated ammonium nitrogen of tryptamine and the carboxylate oxygen atoms of Asp155 (D3.32) was monitored throughout the entire trajectory. This distance remained tightly distributed around a mean of 0.270 nm (minimum 0.247 nm, maximum 0.424 nm), and the salt-bridge contact (< 0.4 nm) was maintained for 99.9% of the simulation with only two brief transient excursions, and no sustained dissociation event (Figure 16). These results suggest that the conserved Asp155 ionic interaction was sufficient to stabilize the tryptamine within the HTR2A orthosteric pocket throughout the membrane simulation.
MM-PBSA binding free-energy and per-residue decomposition
MM-PBSA analysis was performed to add an extra energetic prioritization layer to the five complexes (Table 10). For the four aqueous complexes, per-residue decomposition identified the main energetic contributors for each predicted binding mode. In the LCA-VDR/1DB1 complex, the ligand and Gln317 had a favorable contribution, while Trp286 had an unfavorable contribution. In the urolithin A-CASP3/2DKO complex, Arg64 and Arg207 showed strongly negative per-residue contributions, indicating substantial polar or electrostatic stabilization; nevertheless, the corresponding trajectory remained highly dynamic, demonstrating that favorable residue-level energetics alone do not ensure sustained complex stability. For the 3DCT systems, LCA binding was primarily driven by Arg331, whereas UDCA binding involved a more distributed energetic network comprising Glu326, Asp394, Arg395, Arg441, and Asp470. Across the four aqueous systems, the MM-PBSA decomposition supported the relative prioritization of the LCA-based complexes.
For the membrane-embedded tryptamine-HTR2A/6A93 complex, MM-PBSA analysis was performed on the protein–ligand subsystem extracted from the bilayer trajectory46,47. Favorable contributions were observed for the ligand and Asp155 (D3.32), which was by far the dominant residue-level stabilizing contributor, consistent with the salt-bridge interaction identified in both the docking and trajectory distance analyses. Trp137 exhibited the largest unfavorable per-residue contribution among the surrounding orthosteric-pocket residues (Ser86, Phe87, Phe133, Phe140, Phe141, Val156, Ser159, Thr160, Ile163, Val167, Tyr171), which together form the aromatic and polar contact network lining the binding pocket. These values represent relative computational estimates for structural prioritization and are not experimental binding affinities.
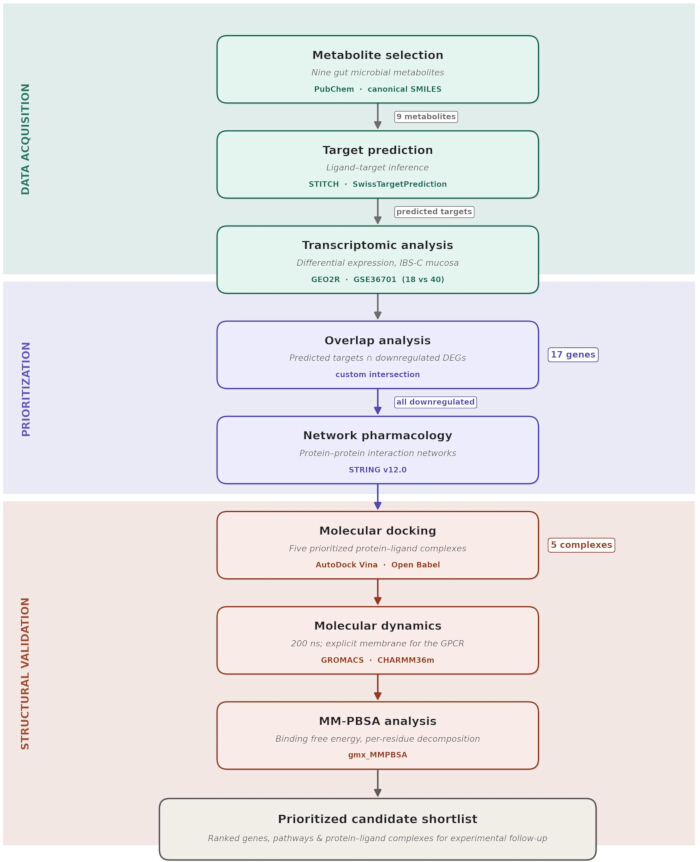
Figure 1: Computational workflow for metabolite-associated host gene prioritization in IBS-C. Schematic representation of the eight-stage workflow integrating metabolite selection, target prediction, transcriptomic differential expression, overlap analysis, network and pathway enrichment, molecular docking, molecular dynamics simulation, and MM-PBSA binding free-energy analysis. Please click here to view a larger version of this figure.
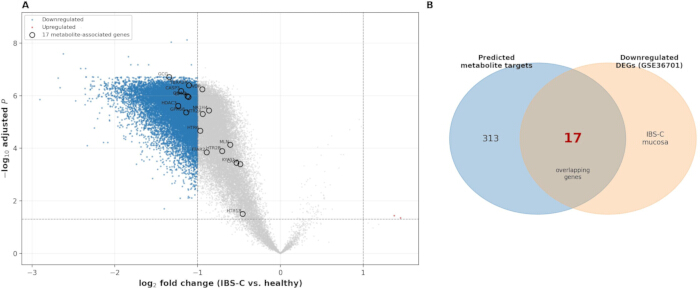
Figure 2: Differential expression and metabolite-target overlap analysis in IBS-C mucosa. (A) Volcano plot of gene-level differential expression in GSE36701. Blue points, significantly downregulated genes; red points, significantly upregulated genes; gray points, non-significant genes. Selected overlapping metabolite-associated genes are labeled. (B) Venn diagram showing the overlap between 330 unique predicted metabolite targets and downregulated genes in GSE36701; 17 genes were shared. Please click here to view a larger version of this figure.
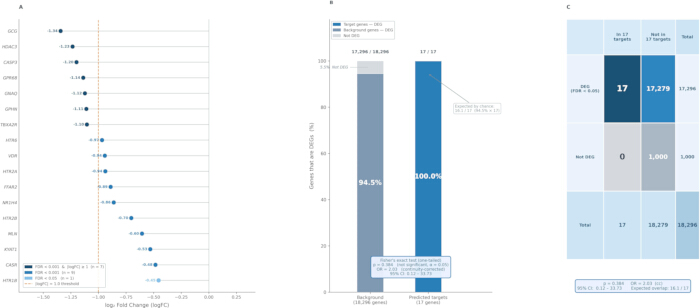
Figure 3: Statistical assessment of the 17 predicted metabolite target genes against GSE36701. (A) Per-gene log2 fold change for all 17 genes, colored by significance tier. (B) Differential expression rate of background genes versus predicted targets, with Fisher’s exact test. (C) A two-by-two contingency table is used for Fisher’s exact test. All 17 targets were significantly downregulated; the overlap is interpreted as a descriptive directional pattern rather than statistical enrichment. Please click here to view a larger version of this figure.
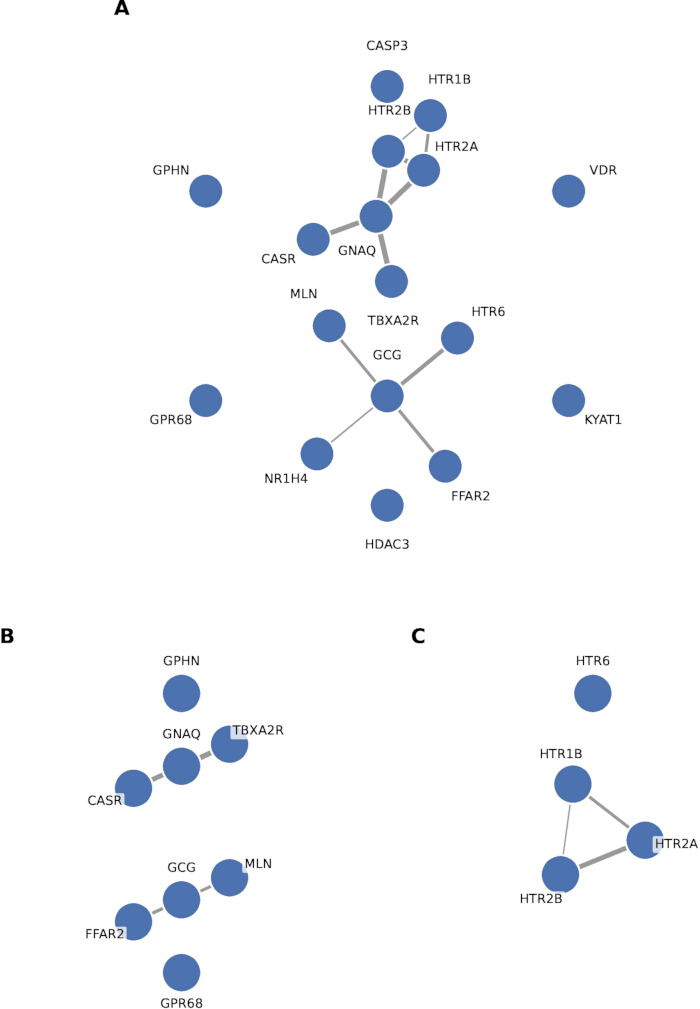
Figure 4: Composite protein-protein interaction network construction and pathway enrichment protein-protein interaction networks of overlapping metabolite-associated genes. (A) Network 1: combined meta-network of all 17 genes. (B) Network 2: propionate-specific network of eight genes (CASR, FFAR2, GCG, GNAQ, GPHN, GPR68, MLN, TBXA2R). (C) Network 3: tryptamine/serotonin network of four genes (HTR1B, HTR2A, HTR2B, HTR6). Networks were generated for Homo sapiens at a minimum, using protein-protein interaction network construction and pathway enrichment confidence ≥ 0.700. Edges represent annotation-supported functional association Please click here to view a larger version of this figure.
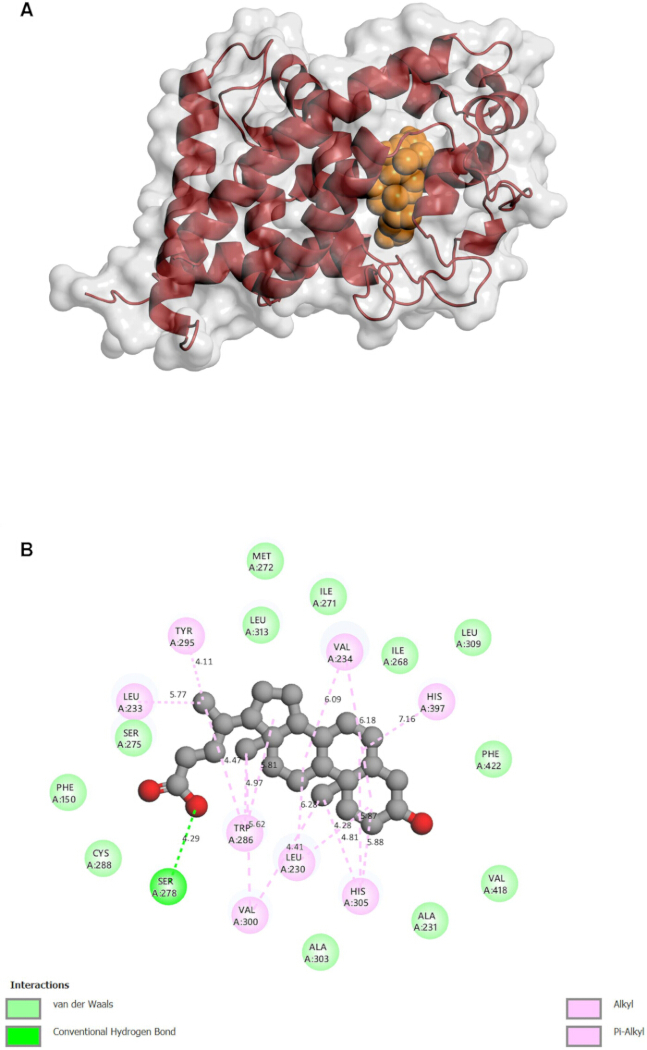
Figure 5: Three-dimensional and two-dimensional structural representation of lithocholic acid in complex with VDR (PDB ID: 1DB1). (A) Three-dimensional surface and cartoon representation with lithocholic acid shown as spheres. (B) Two-dimensional interaction map showing the Ser278 hydrogen bond and surrounding hydrophobic and van der Waals contacts. Please click here to view a larger version of this figure.
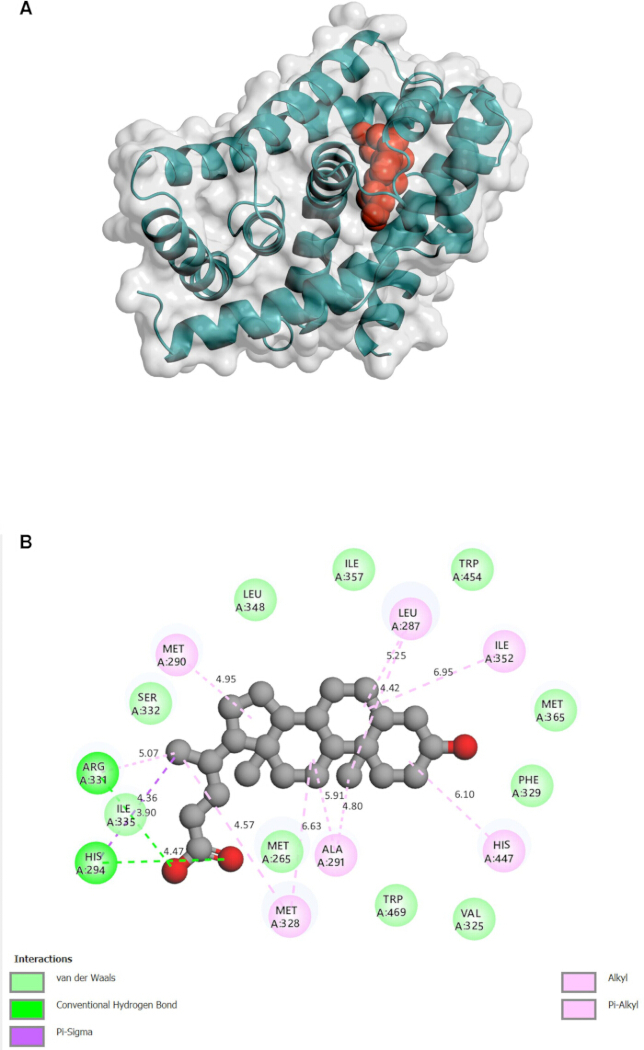
Figure 6. Three-dimensional and two-dimensional structural representation of lithocholic acid in complex with NR1H4/FXR (PDB ID: 3DCT). (A) Three-dimensional surface and cartoon representation. (B) Two-dimensional interaction map showing hydrogen bonding with His294 and Ile335, a π-Sigma interaction, and surrounding contacts. Please click here to view a larger version of this figure.
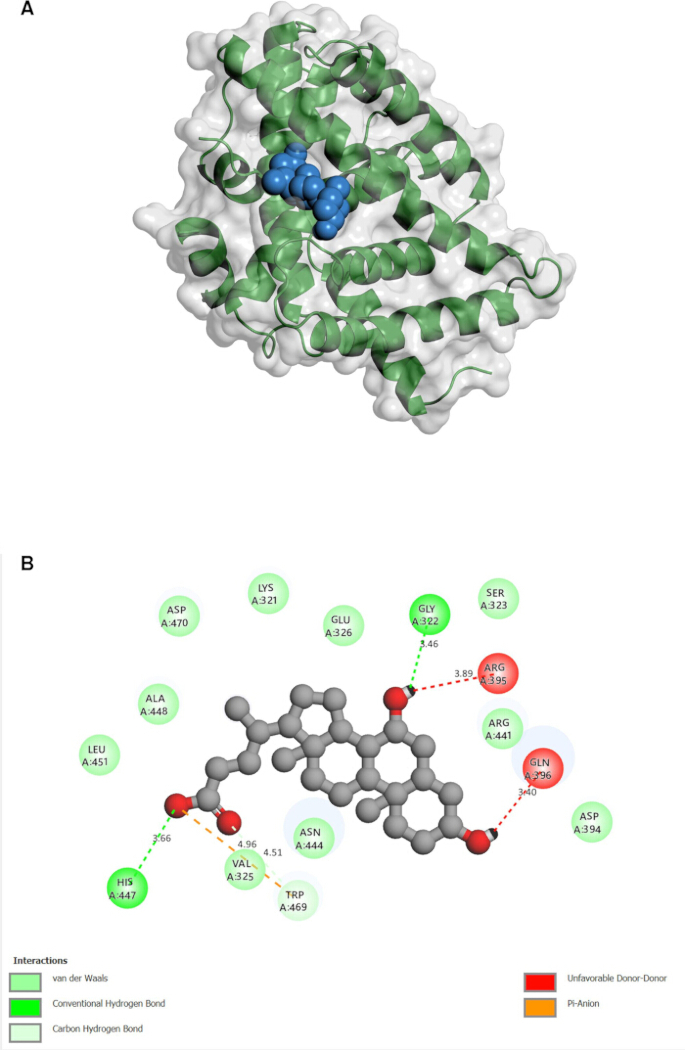
Figure 7: Three-dimensional and two-dimensional structural representation of ursodeoxycholic acid in complex with NR1H4/FXR (PDB ID: 3DCT). (A) Three-dimensional surface and cartoon representation. (B) Two-dimensional interaction map showing hydrogen bonding with His447 and Gly322, a π-Anion interaction with Val325, a carbon-hydrogen bond with Trp469, and unfavorable donor-donor contacts with Arg395 and Gln396. Please click here to view a larger version of this figure.
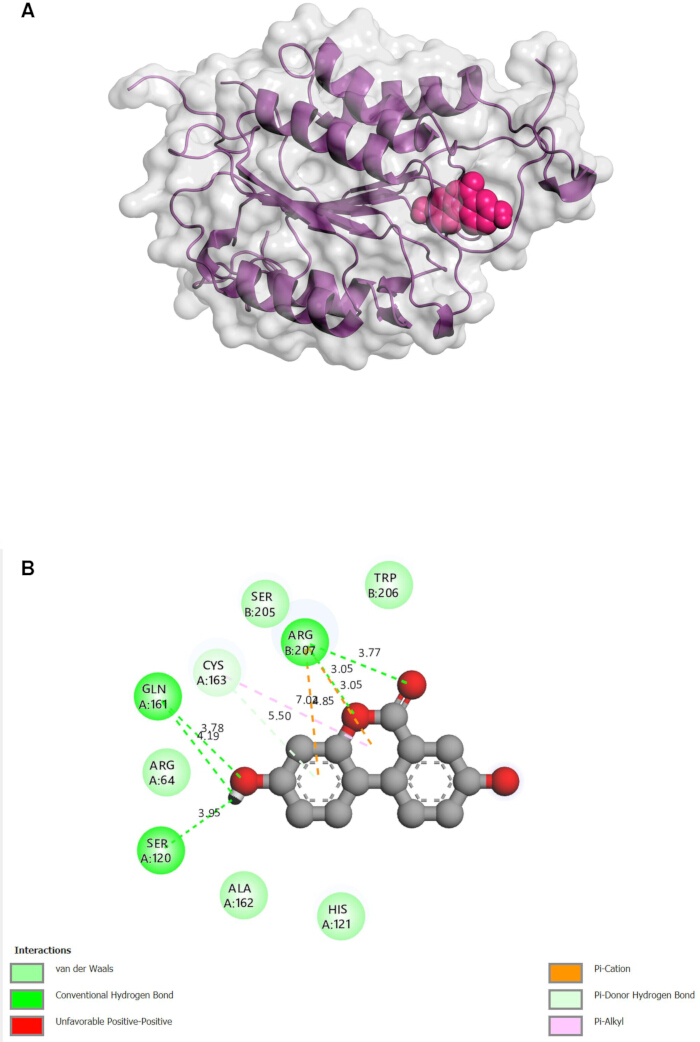
Figure 8: Three-dimensional and two-dimensional structural representation of urolithin A in complex with CASP3 (PDB ID: 2DKO). (A) Three-dimensional surface and cartoon representation. (B) Two-dimensional interaction map showing hydrogen bonding with Gln161, Ser120, and Arg207, π-Cation interactions with Arg207, a π-Donor hydrogen bond with Cys163, and surrounding contacts. Please click here to view a larger version of this figure.
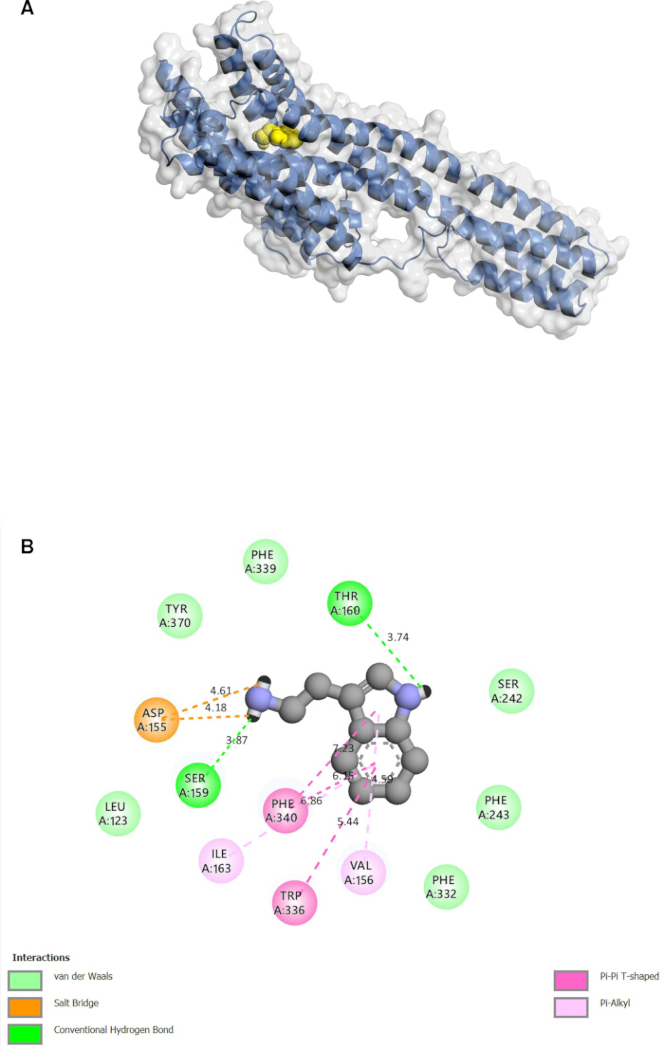
Figure 9: Three-dimensional and two-dimensional structural representation of tryptamine in complex with HTR2A (PDB ID: 6A93). (A) Three-dimensional surface and cartoon representation generated in a three-dimensional molecular visualization program. (B) A two-dimensional interaction map generated in molecular visualization and a two-dimensional interaction diagram tool, illustrating the Asp155 salt bridge and additional binding-site interactions. Please click here to view a larger version of this figure.
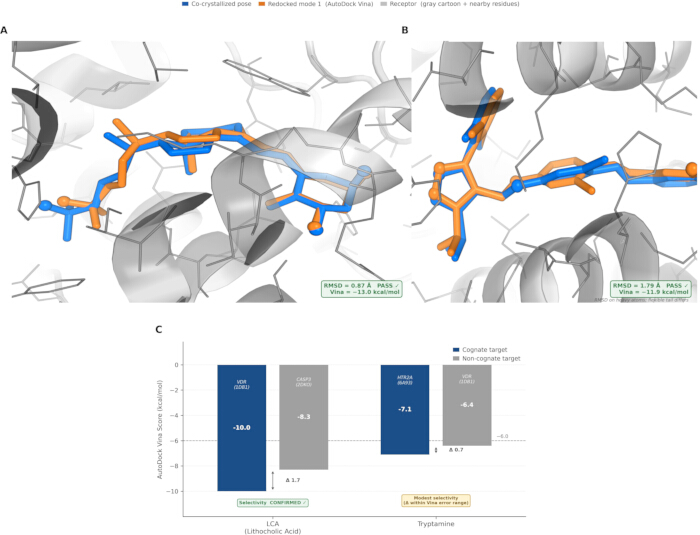
Figure 10: Docking protocol validation. (A,B) Redocking of co-crystallized ligands into VDR/1DB1 (RMSD 0.87 Å) and FXR/3DCT (RMSD 1.79 Å); crystallographic and redocked poses are overlaid, both below the 2.0 Å acceptance threshold. (C) Cross-docking selectivity: cognate versus non-cognate Vina scores for lithocholic acid and tryptamine. Please click here to view a larger version of this figure.
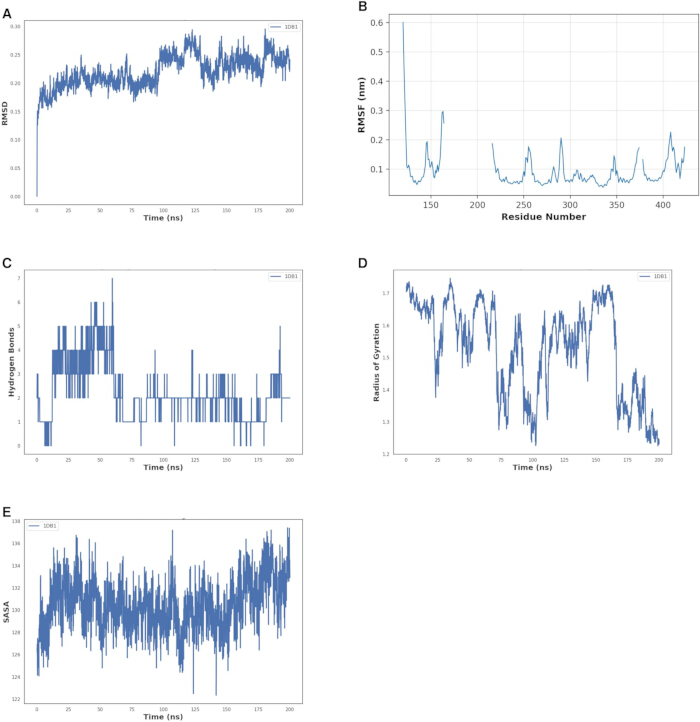
Figure 11. Molecular dynamics trajectory analysis of the LCA-VDR/1DB1 complex over 200 ns. (A) RMSD profile. (B) RMSF profile. (C) Hydrogen-bond count. (D) Radius-of-gyration profile. (E) SASA profile. Please click here to view a larger version of this figure.
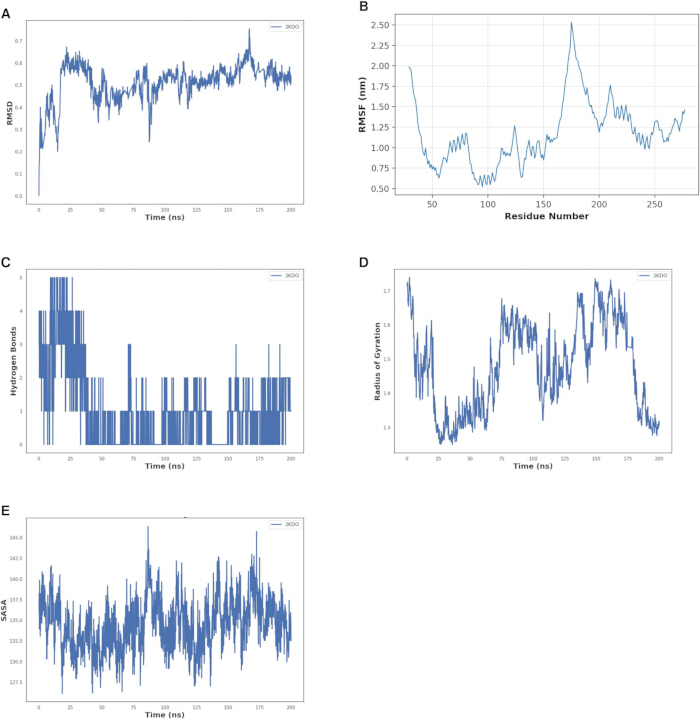
Figure 12: Molecular dynamics trajectory analysis of the urolithin A-CASP3/2DKO complex over 200 ns. (A) RMSD profile showing broad conformational fluctuations and a transient high-deviation event near 165 ns. (B) RMSF profile showing pronounced residue-level flexibility near residue 175. (C) Hydrogen-bond count. (D) Radius-of-gyration profile. (E) SASA profile. Please click here to view a larger version of this figure.
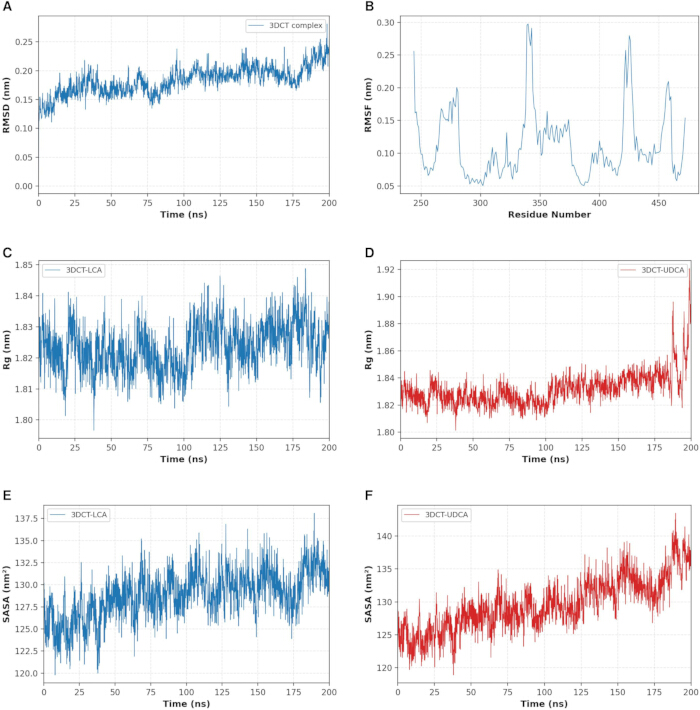
Figure 13: Molecular dynamics trajectory analysis of the NR1H4/FXR (3DCT) bile-acid systems over 200 ns. (A) Backbone RMSD profile for the 3DCT complex. (B) Backbone RMSF profile. (C) Radius-of-gyration profile for 3DCT-LCA. (D) Radius-of-gyration profile for 3DCT-UDCA. (E) SASA profile for 3DCT-LCA. (F) SASA profile for 3DCT-UDCA. Please click here to view a larger version of this figure.
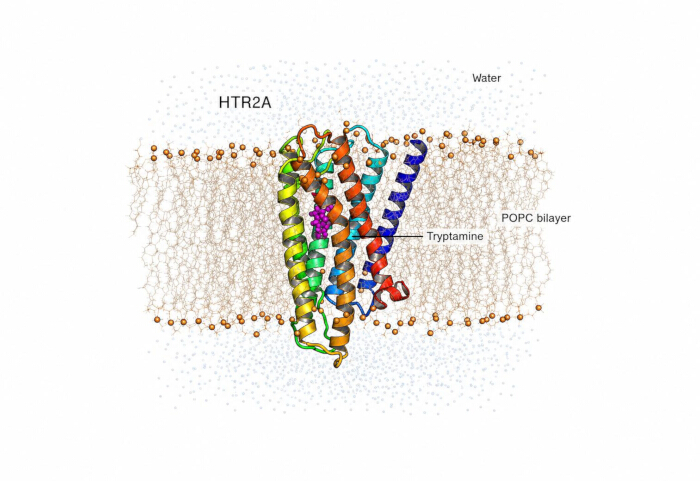
Figure 14: The tryptamine-HTR2A complex embedded in an explicit POPC lipid bilayer. The receptor is shown as a cartoon spanning the bilayer, POPC lipids as lines with phosphate headgroups highlighted, and tryptamine within the orthosteric pocket. Water is shown above and below the membrane. Please click here to view a larger version of this figure.
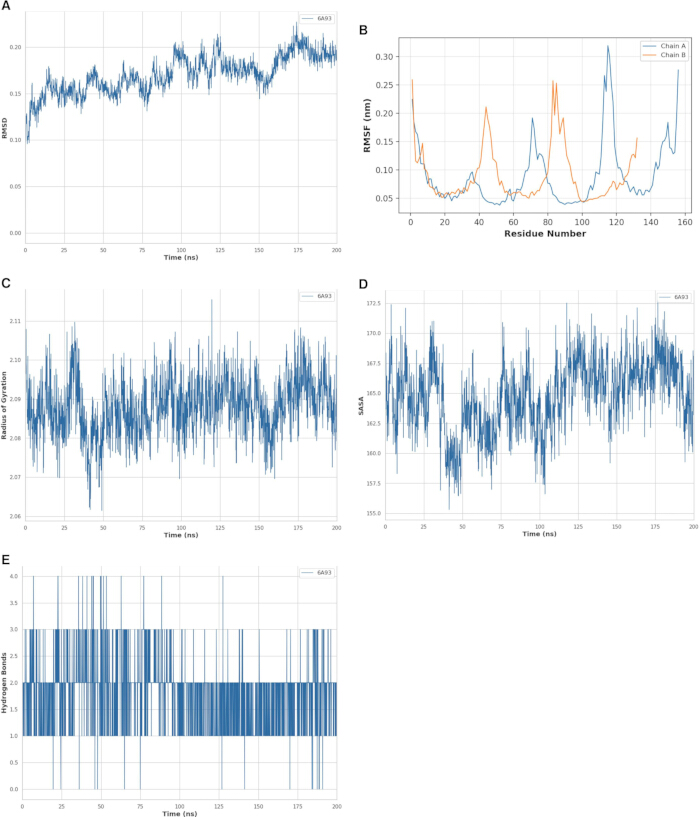
Figure 15: Molecular dynamics trajectory analysis of the tryptamine-HTR2A/6A93 complex over 200 ns in an explicit POPC lipid bilayer. (A) Backbone RMSD profile. (B) Per-residue RMSF profile. (C) Radius-of-gyration profile. (D) SASA profile. (E) Protein-ligand hydrogen-bond count. Please click here to view a larger version of this figure.
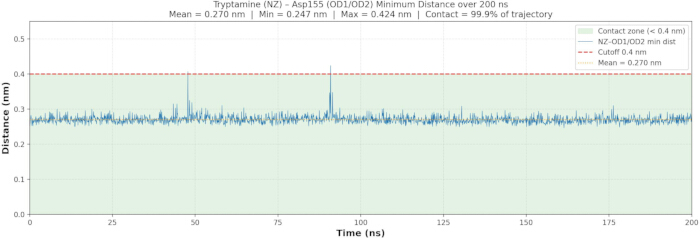
Figure 16: Persistence of the tryptamine–Asp155 (D3.32) ionic interaction over the 200 ns membrane trajectory. The minimum distance between the tryptamine ammonium nitrogen and the Asp155 carboxylate oxygen atoms is plotted against time; the dashed line marks the 0.4 nm salt-bridge contact threshold. The contact was maintained for 99.9% of the simulation. Please click here to view a larger version of this figure.
| Gene Symbol | Metabolite(s) of Origin | Functional Category | log2FC | FDR (adj. P-value) | Significance Tier |
| GCG | Propionate | Peptide hormone-related protein | −1.342 | 1.97e−7 | FDR <0.001 & |logFC > 1 |
| HDAC3 | Butyrate | Enzyme | −1.234 | 2.44e−6 | FDR <0.001 & |logFC| > 1 |
| CASP3 | Urolithin A | Enzyme | −1.198 | 6.66e−7 | FDR <0.001 & |logFC| > 1 |
| GPR68 | Propionate | Membrane receptor | −1.137 | 4.35e−6 | FDR <0.001 & |logFC| > 1 |
| GNAQ | Propionate | Intracellular signaling protein | −1.122 | 1.05e−6 | FDR <0.001 & |logFC| > 1 |
| GPHN | Propionate | Other intracellular protein | −1.109 | 1.13e−6 | FDR <0.001 & |logFC| > 1 |
| TBXA2R | Propionate | Membrane receptor | −1.104 | 4.04e−7 | FDR <0.001 & |logFC| > 1 |
| HTR6 | Tryptamine | Membrane receptor | −0.967 | 2.17e−5 | FDR <0.001 |
| VDR | Lithocholic acid | Nuclear receptor | −0.942 | 5.73e−7 | FDR <0.001 |
| HTR2A | Tryptamine | Membrane receptor | −0.937 | 4.99e−6 | FDR <0.001 |
| FFAR2 | Propionate | Membrane receptor | −0.889 | 1.44e−4 | FDR <0.001 |
| NR1H4 | Lithocholic acid / Ursodeoxycholic acid | Nuclear receptor | −0.861 | 3.68e−6 | FDR <0.001 |
| HTR2B | Tryptamine | Membrane receptor | −0.702 | 1.29e−4 | FDR <0.001 |
| MLN | Propionate | Peptide hormone-related protein | −0.605 | 7.39e−5 | FDR <0.001 |
| KYAT1 | Indole-3-lactic acid / Indole-3-propionic acid | Enzyme | −0.530 | 3.61e−4 | FDR <0.001 |
| CASR | Propionate | Membrane receptor | −0.483 | 4.05e−4 | FDR <0.001 |
| HTR1B | Tryptamine | Membrane receptor | −0.455 | 3.18e−2 | FDR <0.05 |
Table 1: Predicted metabolite-associated target genes overlapping with differentially expressed genes in the IBS-C rectal mucosal dataset. All listed overlapping genes were downregulated. Table 1 is submitted separately as an spreadsheet table and lists, for each target, the metabolite(s) of origin, functional category, target-prediction source (a chemical-protein interaction target prediction, a molecular docking program, or both), a chemical-protein interaction target prediction combined interaction score, and the molecular docking program probability, where available, the prediction tier, log2 fold change, and FDR with expression-significance tier. Source: Gene expression values were obtained from the gene-collapsed GSE36701 differential-expression table (lowest-FDR probe per gene). Target-prediction source and confidence values were compiled from a chemical-protein interaction target prediction and a molecular docking program’s output, using thresholds of a chemical-protein interaction target prediction combined interaction score ≥ 0.700 and a molecular docking program probability ≥ 0.70. a chemical-protein interaction target prediction scores are combined scores on a 0–1 scale; STP denotes a molecular docking program probability. Tier 1 = a chemical-protein interaction target prediction-strict support; Tier 1+ = a chemical-protein interaction target prediction-strict support cross-supported by a molecular docking program.
| Complex | Protein (PDB ID) | Ligand | Vina Score (kcal/mol) | Cavity Size (A^3) | Grid Center X,Y,Z (A) | Search Box (A) |
| LCA-VDR | VDR (1DB1) | Lithocholic acid | −10.0 | 2055 | 10, 19, 33 | 25 x 25 x 25 |
| LCA-NR1H4/FXR | NR1H4/FXR (3DCT) | Lithocholic acid | −9.9 | 3395 | 137, 31, 78 | 25 x 25 x 25 |
| UDCA-NR1H4/FXR | NR1H4/FXR (3DCT) | Ursodeoxycholic acid | −9.4 | 3395 | 137, 31, 78 | 25 x 25 x 25 |
| Urolithin A-CASP3 | CASP3 (2DKO) | Urolithin A | −7.1 | 233 | 37, 34, 32 | 25 x 25 x 25 |
| Tryptamine-HTR2A | HTR2A (6A93) | Tryptamine | −7.1 | 3238 | 12, −1, 61 | 25 x 25 x 25 |
Table 2: Molecular docking results: top-ranked a molecular docking of metabolite ligands to target proteins scores and cavity parameters for the five prioritized protein-ligand complexes. Cavity size is reported in Å3. Source: Docking_Validation/Results/Docking_Validation_Results.xlsx, sheet 'Original_Docking_Scores'. A molecular docking of metabolite ligands to target proteins; exhaustiveness = 8, seed = 42 (fixed), num_modes = 9 for all complexes; top-ranked (mode 1) pose reported.
| Interaction Type | Residue(s) | Distance (A) | Notes |
| Conventional hydrogen bond | Ser278 | 4.29 | LCA carboxylate oxygen |
| Hydrophobic / Pi-Alkyl contact | Leu230, Val234, Trp286, Val300, His305, Tyr295, Leu233, His397 | - | |
| Van der Waals contact | Met272, Leu313, Ile271, Ile268, Leu309, Phe422, Val418, Ala231, Ala303, Cys288, Ser275, Phe150 | - |
Table 3: Binding modes generated for lithocholic acid docking with VDR (PDB ID: 1DB1). Source: molecular visualization and two-dimensional interaction-diagram tool 2D ligand-residue interaction diagrams, as reported in the manuscript Results (Molecular docking). '-' indicates a distance value was not individually reported for that contact.
| Interaction Type | Residue(s) | Distance (A) | Notes |
| Hydrogen bond | His294 | - | |
| Hydrogen bond | Ile335 | - | |
| Pi-Sigma interaction | His294 | - | |
| Alkyl / Pi-Alkyl (hydrophobic) | Met290, Met328, Ala291, Leu287, Ile352, His447 | - | |
| Van der Waals contact | Additional pocket residues (not individually specified in source) | - | Supports steroidal scaffold accommodation |
Table 4: Binding modes generated for lithocholic acid docking with NR1H4/FXR (PDB ID: 3DCT).
Source: molecular visualization and two-dimensional interaction-diagram tool 2D ligand-residue interaction diagrams, as reported in the manuscript Results (Molecular docking). '-' indicates a distance value was not individually reported for that contact.
| Interaction Type | Residue(s) | Distance (A) | Notes |
| Conventional hydrogen bond | His447 | 3.66 | |
| Hydrogen bond | Gly322 | 3.46 | |
| Pi-Anion interaction | Val325 | 4.96 | |
| Carbon-hydrogen bond | Trp469 | 4.51 | |
| Unfavorable donor-donor contact | Arg395 | 3.89 | |
| Unfavorable donor-donor contact | Gln396 | 3.40 |
Table 5: Binding modes generated for ursodeoxycholic acid docking with NR1H4/FXR (PDB ID: 3DCT). Source: molecular visualization and two-dimensional interaction-diagram tool 2D ligand-residue interaction diagrams, as reported in the manuscript Results (Molecular docking). '-' indicates a distance value was not individually reported for that contact.
| Interaction Type | Residue(s) | Distance (A) | Notes |
| Conventional hydrogen bond | Gln161 | 3.78 | |
| Conventional hydrogen bond | Gln161 | 4.19 | second contact |
| Conventional hydrogen bond | Ser120 | 3.95 | |
| Conventional hydrogen bond | Arg207 | 3.05 | |
| Conventional hydrogen bond | Arg207 | 3.77 | second contact |
| Pi-Cation interaction | Arg207 | - | |
| Pi-Donor hydrogen bond | Cys163 | - | |
| Pi-Alkyl / van der Waals contact | Arg64, Ala162, His121, Ser205, Trp206 | - |
Table 6: Binding modes generated for urolithin A docking with CASP3 (PDB ID: 2DKO). Source: molecular visualization and two-dimensional interaction-diagram tool 2D ligand-residue interaction diagrams, as reported in the manuscript Results (Molecular docking). '-' indicates a distance value was not individually reported for that contact.
| Interaction Type | Residue(s) | Distance (A) | Notes |
| Electrostatic salt bridge | Asp155 (D3.32) | - | protonated amine of tryptamine |
| Hydrogen bond | Thr160 | - | |
| Hydrogen bond | Ser159 | - | |
| Aromatic contact | Phe340, Trp336 | - | |
| Pi-Alkyl interaction | Val156, Ile163 | - | |
| Van der Waals contact | Tyr370, Phe339, Ser242, Phe243, Phe332, Leu123 | - |
Table 7: Binding modes generated for tryptamine docking with HTR2A (PDB ID: 6A93). Source: molecular visualization and two-dimensional interaction-diagram tool 2D ligand-residue interaction diagrams, as reported in the manuscript Results (Molecular docking). '-' indicates a distance value was not individually reported for that contact.
| (A) Redocking validation (positive controls) | ||||||
| PDB ID | Protein | Co-crystal Ligand | Vina Score (kcal/mol) | RMSD (A) | Threshold (A) | Result |
| 1DB1 | VDR | VDX (vitamin D analogue) | −13.0 | 0.87 | 2.0 | PASS |
| 3DCT | FXR | WAY-362450 (064) | −11.9 | 1.79 | 2.0 | PASS |
| (B) Cross-docking validation (negative controls) | ||||||
| Ligand | Cognate Target (PDB) | Cognate Score (kcal/mol) | Non-cognate Target (PDB) | Non-cognate Score (kcal/mol) | Delta (kcal/mol) | Selectivity |
| Lithocholic acid | VDR (1DB1) | −10.0 | CASP3 (2DKO) | −8.3 | 1.7 | Confirmed |
| Tryptamine | HTR2A (6A93) | −7.1 | VDR (1DB1) | −6.4 | 0.7 | Modest (within Vina uncertainty +/−0.5–1.0) |
Table 8: Docking protocol validation results: redocking RMSD values (positive controls) and cross-docking scores (negative controls). Source: Docking_Validation/Results/Docking_Validation_Results.xlsx and Docking_Validation/Logs/*.log (a molecular docking of metabolite ligands to target proteins, exhaustiveness = 8, seed = 42, 25 Å × 25 Å × 25 Å box). RMSD computed by heavy-atom, atom-name matching (no superposition).
| Complex | RMSD (nm), mean + / –SD (range) | Rg (nm), mean + / – SD (range) | SASA (nm^2), mean + / – SD (range) | H-bonds, mean + / –SD (range) | RMSF (nm), mean (max) |
| LCA-VDR/1DB1 | 0.230 + / – 0.025 (0.167–0.296) | 1.889 + / − 0.009 (1.863–1.919) | 130.4 + / − 2.3 (122.3–137.4) | 1.9 + / − 0.9 (0–7) | 0.093 (max 0.600 at residue 120) |
| LCA-NR1H4/FXR/3DCT | 0.190 + / – 0.020 (0.135–0.281) | 1.824 + / − 0.008 (1.804–1.849) | 129.7 + / − 2.3 (121.9–138.1) | 3.8 + / − 0.7 (1–6) | 0.113 (max 0.298) |
| UDCA-NR1H4/FXR/3DCT | 0.190 + / – 0.020 (0.135–0.281) | 1.834 + / − 0.013 (1.809–1.921) | 131.0 + / −3.4 (121.6–143.5) | 1.1 + / − 1.1 (0–5) | 0.113 (max 0.298) |
| Urolithin A-CASP3/2DKO | 0.521 + / – 0.058 (0.244–0.755) | 1.892 + / − 0.024 (1.839–1.984) | 134.9 + / − 3.0 (126.4–146.4) | 0.6 + / − 0.7 (0–3) | 1.172 (max 2.532 at residue 175) |
| Tryptamine-HTR2A/6A93 (membrane) | 0.177 + / –0.017 (0.131–0.227) | 2.089 + / − 0.007 (2.070–2.116) | 165.1 + / − 2.7 (156.–172.7) | 1.7 + / − 0.7 (0–4) | 0.090 (max 0.319) |
Table 9: Summary of 200 ns molecular dynamics simulation behavior for the five prioritized protein-ligand complexes, including the membrane-embedded tryptamine-HTR2A system. Source: molecular dynamics trajectory-analysis utilities (.xvg) files — gmx rms, gmx gyrate, gmx sasa, gmx hbond, gmx rmsf — computed over the final 150 ns (50–200 ns) of each 200 ns production run, per protocol step 8.8. RMSD/Rg backbone-fitted; SASA probe radius 0.14 nm; H-bond donor-acceptor cutoff 0.35 nm / 30 °. LCA-3DCT and UDCA-3DCT share one protein backbone trajectory (RMSD, RMSF) with ligand-specific Rg/SASA/H-bonds.
| Tryptamine-HTR2A/6A93 (membrane) — quantitative per-residue decomposition | ||
| Residue | Total ddG contribution (kcal/mol), mean + / − SD | Direction |
| Asp155 (D3.32) | −89.94 + / − 6.81 | Stabilizing (dominant) |
| Tryptamine (ligand) | −13.01 + / − 6.22 | Stabilizing |
| Tyr171 | 13.62 + / − 4.54 | Destabilizing |
| Val167 | 23.32 + / − 3.96 | Destabilizing |
| Val156 | 20.03 + / − 3.81 | Destabilizing |
| Thr160 | 4.86 + / − 3.64 | Destabilizing |
| Ser159 | 24.16 + / − 3.48 | Destabilizing |
| Ser86 | 24.48 + / − 3.65 | Destabilizing |
| Phe87 | 35.18 + / − 4.04 | Destabilizing |
| Phe133 | 32.80 + / −3.70 | Destabilizing |
| Phe140 | 30.63 + / − 3.84 | Destabilizing |
| Phe141 | 35.25 + / − 3.55 | Destabilizing |
| Ile163 | 27.64 + / − 3.71 | Destabilizing |
| Trp137 | 53.77 + / − 4.32 | Destabilizing (largest unfavorable) |
| Other four complexes — residues identified in per-residue decomposition (qualitative) | ||
| Complex | Residue | Direction |
| LCA-VDR/1DB1 | Ligand (LCA) | Favorable |
| LCA-VDR/1DB1 | Gln317 | Favorable |
| LCA-VDR/1DB1 | Trp286 | Unfavorable |
| LCA-NR1H4/FXR/3DCT | Arg331 | Favorable (dominant) |
| UDCA-NR1H4/FXR/3DCT | Glu326 | Mixed/distributed network |
| UDCA-NR1H4/FXR/3DCT | Asp394 | Mixed/distributed network |
| UDCA-NR1H4/FXR/3DCT | Arg395 | Mixed/distributed network |
| UDCA-NR1H4/FXR/3DCT | Arg441 | Mixed/distributed network |
| UDCA-NR1H4/FXR/3DCT | Asp470 | Mixed/distributed network |
| Urolithin A-CASP3/2DKO | Arg64 | Strongly favorable (polar/electrostatic) |
| Urolithin A-CASP3/2DKO | Arg207 | Strongly favorable (polar/electrostatic) |
Table 10: Per-residue MM-PBSA decomposition SHORT ABSTRACT: stabilizing and destabilizing residues (≥ 0.5 kcal mol⁻1 absolute contribution) for each of the five prioritized protein-ligand complexes, including the membrane-embedded tryptamine-HTR2A system. Source: Membrane Simulation/03_MMPBSA/results/FINAL_DECOMP_MMPBSA.dat (molecular mechanics/continuum-solvent binding-energy calculation tool Generalized Born (GB) per-residue decomposition, 'Complex: Total Energy Decomposition'). Residue numbers converted from the CHARMM-GUI-built system's internal numbering (offset +68) to the original 6A93 PDB numbering used elsewhere in this manuscript.
Source: Previous_MD Simulation data/1DB1,2KD0, LCA & UDCA_3DCT}/mmpbsa_*/Decomposition_NORMAL_GB_Complex_TDC*.svg and manuscript Results (MM-PBSA binding free-energy and per-residue decomposition). These four complexes have no numeric per-residue .dat/.csv output in the project directory (only rendered SVG plots with vector-path text that is not machine-extractable); only residue identity and favorable/unfavorable direction, as stated in the manuscript text, are reported. Exact kcal/mol contributions for these four complexes are not available in the source repository.
Discussion
This exploratory computational study demonstrates an integrated, reproducible workflow for prioritizing microbial metabolite-associated host genes and protein-ligand complexes, applied here to a public IBS-C rectal mucosal transcriptomic dataset. Using this workflow, a subset of predicted microbial metabolite-associated genes overlapped with consistently downregulated genes in the dataset, clustering within GPCR, serotonergic, calcium-signaling, neuroactive ligand-receptor, and nuclear receptor-associated pathways, systems increasingly implicated in microbiota-host communication48,49. These findings should be interpreted strictly as hypothesis-generating: the analysis does not measure microbial metabolite concentrations, receptor protein abundance, ligand binding, receptor activation, downstream signaling, motility, secretion, pain responses, or clinical outcomes. The strongest supportable conclusion is that the identified genes and pathways are candidates for experimental validation rather than confirmed disease mechanisms.
The critical significance of this protocol, relative to prior work examining single metabolite-receptor pairs in isolation, lies in its integration of target prediction, public transcriptomics, network analysis, docking with validation controls, molecular dynamics, and MM-PBSA into a single sequential prioritization pipeline. Each stage narrows and contextualizes the candidate set produced by the preceding stage, and the sequential filtering is what renders the final candidate list experimentally tractable. The GNAQ-centered GPCR module and the serotonin receptor-associated module identified here are biologically plausible given the role of Gq signaling in phospholipase C activation, inositol 1,4,5-trisphosphate production, calcium mobilization, secretion, and enteroendocrine function, and the established roles of short-chain fatty acid and tryptophan-derived signaling in mucosal homeostasis and of serotonergic signaling in gastrointestinal motility, secretion, visceral sensitivity, and gut-brain communication10,18,50,51.
A key methodological feature of this study is the treatment of the membrane-embedded receptor HTR2A. Because a soluble-phase simulation cannot reproduce the lipid environment that governs the conformational behavior of a G protein-coupled receptor, the tryptamine-HTR2A complex was simulated in an explicit POPC bilayer. In this membrane environment, the receptor remained structurally stable across the full 200 ns trajectory, and the tryptamine ammonium-Asp155 (D3.32) salt bridge was maintained for essentially the entire simulation. That three independent lines of evidence-the docking pose, the persistent contact distance across the trajectory, and the dominant per-residue MM-PBSA contribution-converge on the same conserved D3.32 interaction lends internal consistency for the predicted tryptamine binding mode, which recapitulates the canonical binding geometry of aminergic ligands at serotonin receptors.
There are certain methodological issues to consider when reproducing this workflow. Errors in the canonical structure or Pan-assay interference compounds ((PAINS)- flagged compounds propagate via target prediction and docking, requiring accurate metabolite selection and chemoinformatic curation. Minimize noise-driven target sets by applying the confidence criteria consistently (chemical-protein interaction target prediction: ≥0.700; molecular docking program: ≥0.70; Protein-protein interaction network construction and pathway enrichment: ≥0.700). Predicted targets should be grouped by functional category to avoid mischaracterization of all metabolite-associated genes as receptors. Precise preprocessing of PDB structures, ligand energy minimization, and grid placement around known binding residues are essential aspects of docking, and the redocking and cross-docking controls introduced here provide an objective measure of the correctness of the docking methodology. The reproducibility envelope in molecular dynamics is defined by a combination of force-field parameterization, proper solvation or membrane building, staged equilibration, and adequate production sampling.
Typical adaptations and troubleshooting steps include relaxing thresholds if the target prediction returns no hits, checking the directional consistency at the probe level for genes with multiple probes, and interpreting isolated Protein-protein interaction network construction and pathway enrichment nodes as threshold-dependent rather than biologically irrelevant. For membrane receptors, explicit lipid bilayer simulation should be used rather than aqueous simulation, as exemplified by the HTR2A method described here. Where a per-residue energy decomposition is necessary, the computation must be performed with a decomposition-capable engine, and reported residue numbering should be reconciled to the native receptor numbering to avoid ambiguity. We suggest that pathway enrichment results should be best treated as an organizational context for the candidate list rather than as pathway-level validation. Mechanically, enrichment of GPCR, serotonergic, or calcium-signaling terms will occur whenever the gene list contains multiple serotonin receptor genes, regardless of protein-level co-regulation. RMSD, Rg, and RMSF values for the membrane-embedded HTR2A system should be interpreted when considering the lipid bilayer: a decrease of Rg in the later trajectory may reflect bilayer-driven conformational adaptation of the transmembrane bundle rather than global unfolding, and persistent ligand-protein hydrogen bonds should be interpreted along with overall RMSD stability.
The limitations of this study are substantial and constrain interpretation. The research was based on one relatively small public dataset, and a search of the major public transcriptomic repositories (web-based differential gene-expression analysis tool and ArrayExpress) did not identify an independent IBS-C rectal mucosal transcriptome dataset of comparable design and platform that could serve as a replication cohort at the time of analysis. The absence of independent transcriptomic replication is a major limitation, and no statement in this manuscript should be interpreted as external validation of the single-dataset findings. The dataset shows near-universal differential expression (approximately 94.5% of genes are significant, the vast majority of which are downregulated), a property that renders conventional enrichment statistics uninformative and prevents conclusions about the specificity of target-gene downregulation relative to the genomic background; the overlap is therefore reported as a descriptive directional pattern rather than statistical enrichment. Bulk mucosal transcriptomics cannot distinguish actual gene regulation from changes in cell composition. mRNA expression does not determine protein abundance or functional response. Target prediction databases suffer from annotation bias, and the results of docking, MD, and MM-PBSA depend on the choice of force field, ligand parameterization, starting position, simulation time, and the adequacy of sampling. Exact minor/build identifiers for some web-server and package components, including CHARMM-compatible ligand parameterization service, CHARMM-GUI, statistical computing environment
package builds, and molecular mechanics/continuum-solvent binding-energy calculation tool subversions, were not fully recoverable from the archived project record and should be reported as available in the separate Table of Materials. The MM-PBSA values are relative estimates, do not contain an explicit configurational entropy term, and should not be interpreted as experimental affinities. The study lacks metabolomic data and cannot determine whether ligand availability is altered in IBS-C, or whether the observed expression alterations are causes, consequences, compensatory responses, or irrelevant correlations.
Future applications of this method should include independent transcriptomic replication, Quantitative polymerase chain reaction (qPCR) and protein-level validation, cell-type localization by single-cell or spatial transcriptomics, metabolomic profiling of the relevant metabolite classes, and functional ligand-response assays in patient-derived colonoids, mucosal explants, or comparable models. Comparisons with diarrhea-predominant IBS, mixed IBS, inflammatory bowel disease, and non-IBS constipation cohorts1,2 would help establish disease specificity. For the structural component, replicating MD trajectories, conducting sensitivity analyses with alternative starting poses, and fully documenting the deposition of the topology, trajectories, and MM-PBSA input and output files would further strengthen reproducibility. Experimental ligand-response assays remain necessary to determine whether the prioritized complexes are functionally relevant; the present results do not support clinical or therapeutic claims.
Disclosures
The author declares no conflicts of interest.
Acknowledgements
No external funding was received for this study. The public availability of the GSE36701 dataset and the STITCH, SwissTargetPrediction, SwissADME, STRING, RCSB Protein Data Bank, Gene Expression Omnibus, CHARMM-GUI, and Orientations of Proteins in Membranes (OPM) resources, as well as the AutoDock Vina, GROMACS, CHARMM36m, CGenFF, gmx_MMPBSA, Open Babel, PyMOL, and Discovery Studio Visualizer software, is gratefully acknowledged.
Materials
| Name | Company | Catalog Number | Comments |
|---|---|---|---|
| AutoDock Vina | Scripps Research / open source | v1.2.7; https://vina.scripps.edu/ | Molecular docking of metabolite ligands to target proteins. |
| CGenFF/ParamChem | SilcsBio / University of Maryland | v4.6; https://cgenff.com/ | Ligand force-field parameterization for molecular dynamics. |
| CHARMM36m force field | CHARMM developers / open source | CHARMM36m; https://www.charmm.org/charmm/resources/charmm-force-fields/ | Protein force field used for molecular dynamics simulations. |
| CHARMM-GUI Membrane Builder | CHARMM-GUI / Lehigh University | Web server; exact release not recoverable; https://www.charmm-gui.org/?doc=input/membrane | Construction and equilibration setup of the explicit POPC membrane system. |
| Discovery Studio Visualizer | BIOVIA (Dassault Systèmes) | 2021; https://discover.3ds.com/discovery-studio-visualizer-download | Two-dimensional ligand-residue interaction analysis. |
| GEO2R | NCBI Gene Expression Omnibus | Web tool; accessed Jan-May 2026; https://www.ncbi.nlm.nih.gov/geo/geo2r/ | Differential-expression analysis of GSE36701. |
| GeneCards | Weizmann Institute of Science | Web database; accessed Jan-May 2026; https://www.genecards.org/ | Gene-symbol and gene-information verification during target standardization. |
| gmx_MMPBSA | Open source (Valdés-Tresanco et al.) | 1.5.x; https://valdes-tresanco-ms.github.io/gmx_MMPBSA/ | MM-PBSA binding free-energy estimation and per-residue decomposition. |
| GROMACS | GROMACS development team / open source | 2024.2; https://www.gromacs.org/ | Molecular dynamics simulation engine. |
| GSE36701 transcriptomic dataset | NCBI Gene Expression Omnibus | GSE36701; https://www.ncbi.nlm.nih.gov/geo/query/acc.cgi?acc=GSE36701 | Public IBS-C rectal-mucosa expression dataset. |
| Open Babel | Open source | 3.2.0; https://openbabel.org/ | Chemical file-format conversion, three-dimensional ligand generation, and ligand preparation. |
| OPM database | University of Michigan | Web database; accessed Jan-May 2026; https://opm.phar.umich.edu/ | Orientation of Proteins in Membranes coordinates used to align HTR2A. |
| ParmEd | ParmEd developers / open source | 4.x; https://parmed.github.io/ParmEd/html/index.html | Hydrogen mass repartitioning and molecular-simulation topology processing. |
| PyMOL | Schrödinger / open source | 2.x; https://www.pymol.org/ | Three-dimensional structural visualization and receptor-ligand figures. |
| RCSB Protein Data Bank | RCSB PDB | Web database; accessed Jan-May 2026; https://www.rcsb.org/ | Source of experimental protein structures and PDB coordinates. |
| STITCH | STITCH consortium (EMBL) | v5.0; https://stitch.embl.de/ | Chemical-protein interaction target prediction. |
| STRING | STRING Consortium / ELIXIR | v12.0; https://version-12-0.string-db.org/ | Protein-protein interaction network construction and pathway enrichment. |
| SwissADME | SIB Swiss Institute of Bioinformatics / University of Lausanne | Web tool; accessed Jan-May 2026; https://www.swissadme.ch/ | Chemoinformatic descriptors, pharmacokinetic predictions, and PAINS assessment. |
| SwissTargetPrediction | SIB Swiss Institute of Bioinformatics / University of Lausanne | Web tool; accessed Jan-May 2026; https://www.swisstargetprediction.ch/ | Ligand-based prediction of human protein targets. |
| UniProt ID Mapping | UniProt Consortium | Web service; accessed Jan-May 2026; https://www.uniprot.org/id-mapping | Mapping protein identifiers to standardized HGNC-approved gene symbols. |
| NVIDIA RTX 3080 | NVIDIA Corporation | RTX 3080; ≥8 GB VRAM; CUDA/driver version not specified in manuscript | CUDA-capable graphics processing unit used for molecular dynamics simulations. |
| CUDA-compatible GPU | NVIDIA Corporation | CUDA toolkit version not specified in manuscript; ≥8 GB VRAM | CUDA-capable GPU with ≥8 GB VRAM; the workstation also required ≥32 GB RAM and a 6-core CPU. |
| Ubuntu Linux | Canonical Ltd. / open source | 22.04 LTS | 64-bit Linux operating system. |
| Python 3.9 | Python Software Foundation | 3.9 | General-purpose programming environment used for workflow scripting and analysis. |
| Gene Expression Omnibus (GEO) | NCBI / U.S. National Library of Medicine | Public web repository; no software version specified in manuscript | Public functional-genomics data repository. |
| AutoDockTools/MGLTools | Molecular Graphics Laboratory, Scripps Research | 1.5.7 | Molecular-structure and docking-input preparation toolkit. |
| GROMACS analysis tools | GROMACS development team / open source | 2024.2 | Molecular dynamics trajectory-analysis utilities. |
| CHARMM-GUI six-step protocol | CHARMM-GUI / Lehigh University | Web protocol; exact release not recoverable | Web-based multistage molecular-system preparation and equilibration workflow. |
| cgenff_charmm2gmx_py3.py | Open-source conversion script; source not specified in manuscript | Version not specified in manuscript | Force-field topology-conversion script. |
| Python | Python Software Foundation | 3.9 | General-purpose programming environment. |
| SciPy | SciPy community / open source | Version not specified in manuscript | Scientific-computing library. |
| scipy.stats.fisher_exact | SciPy community / open source | SciPy version not specified in manuscript | Fisher’s exact-test implementation. |
| R | R Foundation for Statistical Computing | 4.3.x | Statistical computing environment. |
| Bioconductor | Bioconductor project / open source | 3.18 | Bioinformatics software framework. |
| limma | Bioconductor project / open source | Version not specified in manuscript | Differential gene-expression analysis package. |
| Benjamini–Hochberg procedure | Statistical method | Not applicable (statistical procedure) | False-discovery-rate adjustment method. |
| NVIDIA RTX 3080 | NVIDIA Corporation | RTX 3080; ≥8 GB VRAM; CUDA/driver version not specified in manuscript | Graphics processing unit with at least 8 GB of video memory. |
| CUDA-compatible GPU | NVIDIA Corporation | CUDA toolkit version not specified in manuscript; ≥8 GB VRAM | Graphics processing unit supporting general-purpose parallel computation. |
| Ubuntu Linux 22.04 LTS | Canonical Ltd. / open source | 22.04 LTS | 64-bit Linux operating system. |
| TIP3P | CHARMM force-field developers / open source | TIP3P; no software version applicable | Three-site explicit water model. |
| MM/PBSA | gmx_MMPBSA developers / open source | gmx_MMPBSA 1.5.x | Molecular mechanics/Poisson–Boltzmann surface-area binding-energy method. |
References
- Ford AC, Lacy BE, Talley NJ. Irritable bowel syndrome. N Engl J Med. 2017;376(26):2566–2578.
- Sperber AD, et al. Worldwide prevalence and burden of functional gastrointestinal disorders: results of the Rome Foundation Global Study. Gastroenterology. 2021;160(1):99–114.e3.
- Chang L, et al. AGA clinical practice guideline on the pharmacological management of irritable bowel syndrome with constipation. Gastroenterology. 2022;163(1):118–136.
- Lacy BE, et al. ACG clinical guideline: management of irritable bowel syndrome. Am J Gastroenterol. 2021;116(1):17–44.
- Lavelle A, Sokol H. Gut microbiota-derived metabolites as key actors in inflammatory bowel disease. Nat Rev Gastroenterol Hepatol. 2020;17(4):223–237.
- Morrison DJ, Preston T. Formation of short-chain fatty acids by the gut microbiota and their impact on human metabolism. Gut Microbes. 2016;7(3):189–200.
- Ridlon JM, et al. Consequences of bile salt biotransformations by intestinal bacteria. Gut Microbes. 2016;7(1):22–39.
- Roager HM, Licht TR. Microbial tryptophan catabolites in health and disease. Nat Commun. 2018;9(1):3294. doi:10.1038/s41467-018-05470-4.
- Krautkramer KA, Fan J, Bäckhed F. Gut microbial metabolites as multi-kingdom intermediates. Nat Rev Microbiol. 2021;19(2):77–94.
- Pittayanon R, et al. Gut microbiota in patients with irritable bowel syndrome: a systematic review. Gastroenterology. 2019;157(1):97–108.
- Hopkins AL. Network pharmacology: the next paradigm in drug discovery. Nat Chem Biol. 2008;4(11):682–690.
- O’Boyle NM, et al. Open Babel: an open chemical toolbox. J Cheminform. 2011;3:33. doi:10.1186/1758-2946-3-33.
- Daina A, Michielin O, Zoete V. SwissADME: a free web tool to evaluate pharmacokinetics, drug-likeness, and medicinal chemistry friendliness of small molecules. Sci Rep. 2017;7:42717. doi:10.1038/srep42717.
- Szklarczyk D, et al. STITCH 5: augmenting protein–chemical interaction networks with tissue and affinity data. Nucleic Acids Res. 2016;44(D1):D380–D384.
- Daina A, Michielin O, Zoete V. SwissTargetPrediction: updated data and new features for efficient prediction of protein targets of small molecules. Nucleic Acids Res. 2019;47(W1):W357–W364.
- Barrett T, et al. NCBI GEO: archive for functional genomics data sets—update. Nucleic Acids Res. 2013;41(D1):D991–D995.
- Edgar R, Domrachev M, Lash AE. Gene Expression Omnibus: NCBI gene expression and hybridization array data repository. Nucleic Acids Res. 2002;30(1):207–210.
- Swan C, et al. Identifying and testing candidate genetic polymorphisms in irritable bowel syndrome: association with TNFSF15 and TNFα. Gut. 2013;62(7):985–994.
- Ritchie ME, et al. Limma powers differential expression analyses for RNA-sequencing and microarray studies. Nucleic Acids Res. 2015;43(7):e47. doi:10.1093/nar/gkv007.
- Szklarczyk D, et al. The STRING database in 2023: protein–protein association networks and functional enrichment analyses for any sequenced genome of interest. Nucleic Acids Res. 2023;51(D1):D638–D646.
- Kanehisa M, Goto S. KEGG: Kyoto Encyclopedia of Genes and Genomes. Nucleic Acids Res. 2000;28(1):27–30.
- Gillespie M, et al. The Reactome pathway knowledgebase 2022. Nucleic Acids Res. 2022;50(D1):D687–D692.
- Ashburner M, et al. Gene Ontology: tool for the unification of biology. Nat Genet. 2000;25(1):25–29.
- Gene Ontology Consortium, et al. The Gene Ontology knowledgebase in 2023. Genetics. 2023;224(1):iyad031. doi:10.1093/genetics/iyad031.
- Berman HM, et al. The Protein Data Bank. Nucleic Acids Res. 2000;28(1):235–242.
- Eberhardt J, Santos-Martins D, Tillack AF, Forli S. AutoDock Vina 1.2.0: new docking methods, expanded force field, and Python bindings. J Chem Inf Model. 2021;61(8):3891–3898.
- Trott O, Olson AJ. AutoDock Vina: improving the speed and accuracy of docking. J Comput Chem. 2010;31(2):455–461.
- Vanommeslaeghe K, et al. CHARMM general force field: a force field for drug-like molecules compatible with the CHARMM all-atom additive biological force fields. J Comput Chem. 2010;31(4):671–690.
- Huang J, MacKerell AD Jr. CHARMM36 all-atom additive protein force field: validation based on comparison to NMR data. J Comput Chem. 2013;34(25):2135–2145.
- Jorgensen WL, et al. Comparison of simple potential functions for simulating liquid water. J Chem Phys. 1983;79(2):926–935.
- Abraham MJ, et al. GROMACS: high-performance molecular simulations through multi-level parallelism from laptops to supercomputers. SoftwareX. 2015;1–2:19–25.
- Jo S, Kim T, Iyer VG, Im W. CHARMM-GUI: a web-based graphical user interface for CHARMM. J Comput Chem. 2008;29(11):1859–1865.
- Wu EL, et al. CHARMM-GUI Membrane Builder toward realistic biological membrane simulations. J Comput Chem. 2014;35(27):1997–2004.
- Lomize MA, et al. OPM database and PPM web server: resources for positioning proteins in membranes. Nucleic Acids Res. 2012;40(D1):D370–D376.
- Darden T, York D, Pedersen L. Particle mesh Ewald: an N log(N) method for Ewald sums in large systems. J Chem Phys. 1993;98(12):10089–10092.
- Hess B, Bekker H, Berendsen HJC, Fraaije JGEM. LINCS: a linear constraint solver for molecular simulations. J Comput Chem. 1997;18(12):1463–1472.
- Valdés-Tresanco MS, Valdés-Tresanco ME, Valiente PA, Moreno E. gmx_MMPBSA: a new tool to perform end-state free-energy calculations with GROMACS. J Chem Theory Comput. 2021;17(10):6281–6291.
- Fiorucci S, Distrutti E. Bile acid-activated receptors, intestinal microbiota, and the treatment of metabolic disorders. Trends Mol Med. 2015;21(11):702–714.
- Wahlström A, Sayin SI, Marschall HU, Bäckhed F. Intestinal crosstalk between bile acids and microbiota and its impact on host metabolism. Cell Metab. 2016;24(1):41–50.
- Gershon MD, Tack J. The serotonin signaling system: from basic understanding to drug development for functional gastrointestinal disorders. Gastroenterology. 2007;132(1):397–414.
- Kim K, et al. Structure of a hallucinogen-activated Gq-coupled 5-HT2A serotonin receptor. Cell. 2020;182(6):1574–1588.e19.
- Ballesteros JA, Weinstein H. Integrated methods for the construction of three-dimensional models and computational probing of structure–function relations in G protein-coupled receptors. In: Sealfon SC, editor. Receptor Molecular Biology. Methods in Neurosciences. Vol. 25. San Diego: Academic Press; 1995. p. 366–428.
- McCorvy JD, Roth BL. Structure and function of serotonin G protein-coupled receptors. Pharmacol Ther. 2015;150:129–142.
- Klauda JB, et al. Update of the CHARMM all-atom additive force field for lipids: validation on six lipid types. J Phys Chem B. 2010;114(23):7830–7843.
- Lee J, et al. CHARMM-GUI input generator for NAMD, GROMACS, AMBER, OpenMM, and CHARMM/OpenMM simulations using the CHARMM36 additive force field. J Chem Theory Comput. 2016;12(1):405–413.
- Genheden S, Ryde U. The MM/PBSA and MM/GBSA methods to estimate ligand-binding affinities. Expert Opin Drug Discov. 2015;10(5):449–461.
- Kollman PA, et al. Calculating structures and free energies of complex molecules: combining molecular mechanics and continuum models. Acc Chem Res. 2000;33(12):889–897.
- Cryan JF, et al. The microbiota–gut–brain axis. Physiol Rev. 2019;99(4):1877–2013.
- Koh A, De Vadder F, Kovatcheva-Datchary P, Bäckhed F. From dietary fiber to host physiology: short-chain fatty acids as key bacterial metabolites. Cell. 2016;165(6):1332–1345.
- Tan J, et al. The role of short-chain fatty acids in health and disease. Adv Immunol. 2014;121:91–119.
- Agus A, Planchais J, Sokol H. Gut microbiota regulation of tryptophan metabolism in health and disease. Cell Host Microbe. 2018;23(6):716–724.