This bibliometric analysis maps antimicrobial resistance research trends and emerging hotspots in China from 2016–2025 using CiteSpace. The findings highlight increasing attention to novel therapeutics and technology-enabled approaches, alongside contrasting MRSA and CRKP resistance trends, emphasizing the need for continued surveillance and targeted antimicrobial stewardship.
Research Article
Visual Bibliometric Analysis of Research Hotspots and Trends in Antimicrobial Resistance in China
In This Article
Summary
Abstract
To systematically analyze the research landscape of antimicrobial resistance (AMR) in China from 2016–2025, identify hotspots, and detect emerging trends using bibliometric visualization techniques. We compiled 3,096 publications from the Web of Science Core Collection (including Science Citation Index Expanded, SCI-E) and China National Knowledge Infrastructure (CNKI). Using CiteSpace, we performed co-authorship network analysis, keyword co-occurrence mapping, and cluster analysis employing the Log-Likelihood Ratio (LLR) algorithm. Burst detection via Kleinberg's algorithm identified research frontiers, while modularity Q (>0.3) and silhouette metrics validated network structural quality. Rising from 357 in 2016 to 365 in 2022, with accelerated growth following the 2019–2022 period. Six major research clusters emerged with significant structural validity (modularity Q = 0.8108). Burst analysis identified mobilized colistin resistance-1 (mcr-1, burst strength 9.12) and carbapenemase (8.52) as the strongest emerging signals. Resistance surveillance revealed divergent trends: carbapenem-resistant Klebsiella pneumoniae increased alarmingly from 5.6% to 20.0%, whereas methicillin-resistant Staphylococcus aureus declined from 48.8% to 25.8%. Author network analysis revealed a highly centralized structure with limited cross-regional collaboration. Novel therapeutics, including antimicrobial peptides, phage therapy, and machine learning applications, demonstrated significant emergence. Overall, the bibliometric patterns suggest that AMR research in China has evolved from descriptive surveillance toward mechanistic investigation and increasing attention to innovative interventions. The contrasting decline in methicillin-resistant Staphylococcus aureus and rise in carbapenem-resistant pathogens highlight the need for continued national surveillance, stronger inter-regional collaboration, targeted antimicrobial stewardship, and cautious translation of emerging technologies into clinical practice.
Introduction
Antimicrobial resistance (AMR) poses a critical threat to global public health, with the World Health Organization identifying it as one of the top ten health threats facing humanity1. The economic burden of AMR is substantial, with projections suggesting that by 2050, resistant infections could cause 10 million deaths annually worldwide if current trends continue2. The fundamental mechanisms of antimicrobial resistance in bacteria involve complex genetic and phenotypic adaptations, including enzymatic drug modification, target site alterations, efflux pump overexpression, and biofilm formation, which collectively threaten the efficacy of existing therapeutic armamentarium3. Recent global assessments have further emphasized the expansive scope of this challenge, with antimicrobial resistance now recognized as a complex ecological phenomenon requiring coordinated action across human health, animal agriculture, and environmental sectors4. AMR also has broader implications for sustainable development, including environmental and socioeconomic targets5. The challenge is particularly acute in combating resistance in malaria, HIV, and tuberculosis, where multidrug-resistant strains threaten decades of progress in infectious disease control6. Historical analyses of AMR epidemiology in China have documented distinctive characteristics compared to Western populations, including unique resistance gene profiles and transmission dynamics shaped by healthcare practices and antibiotic consumption patterns7.
China, with its large population and substantial antibiotic consumption, faces particularly severe AMR challenges. The per capita antibiotic use in China remains significantly higher than in many European countries, creating selective pressure that drives resistance development8. Recognizing the severity of this crisis, the Chinese government has implemented the National Action Plan to Contain Antimicrobial Resistance (2016–2020, 2022–2025) and established the China Antimicrobial Resistance Surveillance System (CARSS) to monitor resistance patterns nationwide9. From a regional perspective, Southeast Asia has emerged as a critical hotspot for AMR research and dissemination, with bibliometric analyses revealing rapidly growing research output paralleling China's trajectory10. Global trends and projections suggest that without decisive intervention, the mortality burden of AMR will disproportionately affect middle-income countries, with some projections indicating that the Asia-Pacific region may account for nearly half of all resistance-related deaths by mid-century11. These sobering forecasts have catalyzed international commitments to antimicrobial stewardship, though implementation gaps persist between policy formulation and clinical practice worldwide12. These initiatives have generated extensive data on resistance epidemiology, molecular mechanisms, and clinical outcomes, providing a rich source for bibliometric analysis. Recent One Health frameworks, therefore, emphasize coordinated interventions across human health, animal health, agriculture, and environmental sectors, supported by antimicrobial stewardship and rapid diagnostic technologies13.
Bibliometric analysis, utilizing mathematical and statistical methods to quantitatively analyze published literature, enables researchers to uncover research hotspots, track evolutionary trajectories, and predict future directions14. Visualization tools such as CiteSpace transform complex citation data into intuitive knowledge maps, revealing hidden patterns in scientific literature15. Previous bibliometric studies have mapped research trends in specific AMR domains, including global antifungal resistance research16. However, comprehensive bibliometric analysis integrating Chinese- and English-language research on AMR in China remains limited. In contrast to previous bibliometric analyses focused on specific AMR domains, the present study integrates Chinese-language CNKI and English-language Web of Science records and separately contextualizes the bibliometric findings using national CARSS surveillance trends. This study aims to provide a systematic bibliometric analysis of AMR research in China from 2016–2025, utilizing CiteSpace software to generate knowledge maps and provide evidence-based recommendations for future research priorities and policy development. This combined design provides a bilingual view of the research landscape while allowing bibliometric trends to be interpreted alongside, but independently from, national resistance-surveillance data.
Protocol
Data sources
A comprehensive literature search was conducted across both international and domestic databases to ensure global coverage of AMR research related to China. For international literature, we systematically searched the Web of Science Core Collection (including Science Citation Index Expanded, SCI-E) and the China National Knowledge Infrastructure (CNKI) from January 1, 2016, to December 31, 2025. Exact Boolean Query for SCI-E: TS = ((“antimicrobial resistance” OR “antibiotic resistance” OR “drug resistance”) AND (“China” OR “Chinese” OR “Mainland China”)). For CNKI, the Subject field was searched using the Chinese-language equivalents of “antibiotic resistance,” “antimicrobial resistance,” and “drug resistance,” combined with “China.” No formal keyword-synonym merging or thesaurus-based preprocessing was performed before the CiteSpace analysis. The final search was executed on April 28, 2026, to allow sufficient time for publications issued through December 31, 2025, to be indexed in the databases. The database publication-year filter was restricted to 2016–2025. Records labeled as Early Access were additionally checked during screening, and articles with a first online publication date in 2026 were excluded from the analysis. Keyword labels were checked against the original CiteSpace output to ensure consistent terminology in the text, tables, and figures.
For the CNKI search, 983 records were retrieved from the Peking University Core Journals (PKU Core), 802 from the Chinese Science Citation Database (CSCD), and 462 from the World Journal Clout Index (WJCI). Because a single article may be indexed in more than one of these categories, these numbers represent category-specific retrieval records and are not mutually exclusive publication counts. The three record sets were therefore merged before eligibility screening. Duplicate entries were identified first by exact DOI matching. For records without a DOI, normalized article titles were compared together with the first-author name and publication year. Records with incomplete or inconsistent metadata were reviewed manually. When the same article appeared in two or more CNKI indexing categories, it was retained only once in the combined CNKI dataset, irrespective of the number of categories in which it was indexed. After within-CNKI deduplication and eligibility screening, 1,096 unique Chinese-language articles were retained. No journal impact-factor threshold was applied, because the purpose of this study was to characterize the overall AMR research landscape rather than to restrict the corpus according to journal prestige. Formal methodological-quality or risk-of-bias assessment of individual publications was not performed because the objective of this study was to characterize the overall bibliometric landscape rather than to evaluate study-level methodological quality.
Across SCI-E and CNKI, 5,286 records were identified initially. The same DOI-, title-, author-, and year-based criteria were subsequently applied to identify potential overlaps between the CNKI and Web of Science datasets. A total of 2,190 records were removed during combined deduplication and eligibility screening, leaving 3,096 publications for analysis. The complete literature identification, screening, and inclusion process is presented in Supplementary Figure 1.
Inclusion criteria were: studies focusing on bacterial AMR in China; articles reporting resistance rates, molecular epidemiology, clinical outcomes, or intervention strategies; and publications between January 1, 2016, and December 31, 2025. Duplicate records, 2026 publications, reviews, or meta-analyses without original datasets, and studies limited to veterinary or environmental AMR without a human-health component were excluded. Reviews and meta-analyses without new primary datasets were excluded because the analysis was designed to characterize original research output. Restricting the corpus to original research improves the comparability of bibliometric indicators, including publication counts, co-authorship patterns, keyword frequencies, and citation-related measures, because evidence-synthesis articles aggregate prior studies and may have substantially different citation and keyword profiles. After removing duplicates across databases and screening titles/abstracts, a total of 3,096 publications were included for bibliometric analysis, comprising 1,096 Chinese-language articles (35.4%) and 2000 English-language publications (64.6%).
Analytical methods
CiteSpace (Drexel University, Philadelphia, PA, USA)17 was used for bibliometric analysis. The time span was 2016–2025 with a 1-year slice length. Node types were selected separately for author, institution, and keyword analyses. Node selection used the g-index with k = 10; the displayed configuration also used LRF = 2.5, L/N = 10, LBY = 5, and e = 1.0. Pathfinder pruning was applied to the author, keyword, and cluster networks to reduce redundant links while retaining the principal network structure. The 1-year time slice was selected to preserve annual changes within the 10-year study window.
Four main analytical modules were utilized: co-authorship analysis to map collaboration networks among authors and institutions; keyword co-occurrence analysis to identify research themes and their relationships; cluster analysis using the Log-Likelihood Ratio (LLR) algorithm to extract thematic clusters with automatic labeling; and burst detection using Kleinberg’s algorithm to identify emerging trends and research frontiers. Network metrics, including modularity Q and mean silhouette S, were used to evaluate cluster quality. A modularity Q value greater than 0.3 indicates a meaningful community structure, whereas a mean silhouette value greater than 0.7 indicates high within-cluster consistency and reliable cluster assignment18.
Statistical analysis of resistance trends
Resistance rate trends for major pathogens were derived from the China Antimicrobial Resistance Surveillance System (CARSS) annual reports (2016–2025), which aggregate data from participating sentinel hospitals nationwide. These surveillance data were analyzed independently of the bibliometric corpus and were not extracted from, pooled across, or included among the 3,096 Web of Science and CNKI publications used for the CiteSpace analyses.
For each pathogen–antimicrobial combination, we extracted the annual resistance rate (percentage of non-duplicate isolates resistant to the specified agent), the total number of isolates tested (denominator), and the number of sentinel hospitals contributing data. Susceptibility testing was performed using standardized broth microdilution or disk diffusion methods, with interpretations based on Clinical and Laboratory Standards Institute (CLSI) guidelines (M100 documents, editions 2016–2025).
To assess temporal trends, we performed linear regression analysis with the resistance rate as the dependent variable and year as the independent variable, covering the full 10-year period (2016–2025). The regression slope (β) and coefficient of determination (R2) were calculated for each pathogen–antimicrobial pair. To account for potential changes in surveillance coverage (e.g., expansion from 1,398 hospitals in 2016 to 2,349 hospitals in 2025), we also performed sensitivity analyses weighting each year's resistance rate by the inverse of the number of participating hospitals and by the geographic distribution of reporting sites. These weighted models yielded trend directions and significance levels consistent with the unweighted analyses; therefore, unweighted results are presented for simplicity and interpretability. All statistical analyses were performed using R version 4.3.2 (R Foundation for Statistical Computing, Vienna, Austria). A two-sided p-value <0.05 was considered statistically significant.
Results
Publication trends
A total of 3,096 publications were included in the analysis. Total annual output increased from 357 publications in 2016 to a peak of 365 in 2022 and subsequently declined continuously to 146 in 2025 (Figure 1). English-language output increased from 130 publications in 2016 to 295 in 2022 before decreasing to 69 in 2025. Chinese-language output decreased from 227 publications in 2016 to 93 in 2019, increased during 2020–2021, and ended at 77 in 2025 (Figure 1).
The linguistic distribution revealed interesting patterns: while Chinese-language publications dominated overall (63.6%) in 2016, English publications showed faster relative growth, increasing from merely 130 papers (36.4%) in 2016 to 295 papers (80.8%) in 2022. This shift reflects enhanced international collaboration and the growing global impact of Chinese AMR research.
Author and institutional collaboration networks
Network analysis identified the principal authors and collaboration patterns in the co-authorship network (Figure 2). Table 1 presents the 10 most prolific authors. Wang Juan from South China Agricultural University and Yue Min from Zhejiang University were tied for the highest publication output, with 44 publications each. Xu Xuebin from the Shanghai Municipal Center for Disease Control and Prevention and Wu Qingping from the Guangdong Academy of Sciences each published 42 papers, followed by Zhang Jumei from the Guangdong Academy of Sciences with 41 papers. Two authors from the same institution (Wu Qingping and Zhang Jumei at the Institute of Microbiology, Guangdong Academy of Sciences) are among the top five, indicating strong institutional research activity at this center. Publication count was interpreted as an indicator of research productivity, whereas betweenness centrality was interpreted separately as an indicator of an author’s bridging role within the collaboration network. Their betweenness centrality values were 0.01 and 0.04, respectively.
The author collaboration network comprised 248 nodes and 420 links, with a density of 0.0137. This low density indicates that only a small proportion of all possible author pairs were connected, suggesting that collaborations were concentrated within a limited number of research groups rather than broadly distributed across the network. Notably, cross-institutional collaborations were less frequent than intra-institutional partnerships, suggesting potential for enhanced inter-hospital cooperation. The leading institutions were concentrated primarily in major eastern metropolitan and research centers, particularly Beijing, Shanghai, Hangzhou, Guangzhou, and Yangzhou.
Institutional analysis showed that Zhejiang University ranked first, with 195 publications and 10,660 citations, followed by South China Agricultural University with 112 publications and China Agricultural University with 99 publications (Table 2). Among the top 10 institutions, five were located in Beijing, two in Shanghai, and one each in Yangzhou, Hangzhou, and Guangzhou. No formal East/Central/West China publication-output analysis was performed.
Research hotspots and keyword analysis
Keyword co-occurrence analysis identified 257 keyword nodes with 932 co-occurrence connections (Figure 3). The network density was 0.0283, with an average of approximately 7.3 connections per keyword, indicating moderate thematic coherence. Table 3 lists the top 10 high-frequency keywords. “Antimicrobial Resistance” appeared as the central node with 285 occurrences in the co-occurrence matrix and a centrality of 0.92, followed by “Carbapenem” (192 occurrences, centrality 0.78) and “ESBL” (extended-spectrum β-lactamase; 168; 0.72). The discrepancy between co-occurrence counts and total occurrence counts in Table 3 arises because Table 3 reports raw term frequencies from the full corpus, whereas the network co-occurrence matrix counts only co-occurrences within the same document; both metrics are reported for completeness.
The keyword network revealed distinct thematic clusters. Pathogen-specific keywords (K. pneumoniae, A. baumannii, P. aeruginosa) clustered tightly with resistance mechanisms (carbapenemases, biofilm), while clinical management terms (stewardship, combination therapy) formed a separate but connected cluster. This structure suggests that research has evolved from descriptive pathogen studies toward mechanistic understanding and intervention strategies.
Cluster analysis using the LLR algorithm identified 15 keyword clusters with a modularity Q of 0.8108 and a mean silhouette S of 0.9388 (Figure 4). The six principal clusters highlighted in the timeline were #0 “virulence gene,” #2 “Klebsiella pneumoniae,” #4 “antimicrobial resistance genes,” #5 “antibiotic resistance,” #6 “molecular epidemiology,” and #7 “Escherichia coli.” The timeline shows that broad antibiotic-resistance, pathogen-surveillance, and molecular-epidemiology themes were prominent during the earlier years, while virulence genes, antimicrobial-resistance genes, and Klebsiella pneumoniae remained active into the later period. The temporal overlap among the clusters indicates cumulative diversification of research themes rather than a strictly sequential replacement of one theme by another.
The high betweenness centrality of “Carbapenem” and “ESBL” indicates that β-lactam resistance served as an important connecting theme across the bibliometric network. This thematic prominence was consistent with, but analytically independent from, the external CARSS surveillance data presented below, which showed increasing carbapenem resistance in Klebsiella pneumoniae and persistently high carbapenem resistance in Acinetobacter baumannii.
Resistance trends and epidemiological patterns
In a separate analysis, the external CARSS surveillance data provided epidemiological context for the bibliometric prominence of carbapenem- and β-lactam-resistance topics and revealed divergent pathogen-specific resistance trends (Table 4). MRSA demonstrated a consistent and significant decline from 48.8% in 2016 to 25.8% in 2025 (β = –2.43% per year, R2 = 0.94, p < 0.001), representing a 47.1% relative reduction. The decline in MRSA was temporally consistent with the implementation of active surveillance, contact precautions, decolonization protocols, and antimicrobial-stewardship measures in Chinese hospitals19, although the present ecological analysis cannot attribute the trend to any single intervention. Previous nationwide studies have reported associations between the use of carbapenems and third-generation cephalosporins and resistance among Gram-negative pathogens20, providing a possible explanatory context for the observed trends. However, antimicrobial-consumption data were not directly analyzed in the present study.
Conversely, carbapenem resistance in Gram-negative pathogens showed alarming increases. CRKP rose dramatically from 5.6% (2016) to 20.0% (2025) (β = +1.61% per year, R2 = 0.97, p < 0.001), representing a 3.6-fold increase. carbapenem-resistant Acinetobacter baumannii (CRAB) maintained high-level epidemic status throughout the period, increasing from 56.0% to 76.5% (β = +2.35% per year, R2 = 0.92, p < 0.001), with some regions reporting rates exceeding 80%. vancomycin-resistant enterococci (VRE), though starting from a low baseline (1.5%), showed a consistent upward trend reaching 6.5% in 2025 (β = +0.56% per year, R2 = 0.89, p < 0.001). In contrast to the marked decline in MRSA, carbapenem-resistant Pseudomonas aeruginosa (CRPA) showed only a modest decrease from 25.0% to 19.9%. Overall, the resistance trajectories were pathogen-specific rather than uniform: MRSA and CRPA declined, whereas CRKP, CRAB, and VRE increased during the study period.
Emerging research frontiers
Burst detection identified the 10 keywords with the strongest burst signals (Table 5 and Figure 5). Mobilized colistin resistance-1 (mcr-1) showed the strongest burst (9.12; 2016–2022), whereas carbapenemase showed a slightly lower but longer-lasting burst (8.52; 2016–2024). The mcr-1 hotspot primarily represented a gene-centered research trajectory, progressing from the identification and molecular characterization of plasmid-mediated colistin resistance toward surveillance of its dissemination. In contrast, the longer carbapenemase burst reflected sustained attention extending from enzyme and resistance-gene mechanisms to molecular epidemiology, clinical transmission, and infection-control concerns. Because burst detection identifies the temporal concentration of research attention rather than discrete internal stages, separate subperiod boundaries were not assigned within each burst interval.
Antimicrobial peptides (burst strength 7.92; 2019–2024), phage therapy (6.54; 2020–2024), machine learning (5.83; 2021–2024), and clustered regularly interspaced short palindromic repeats (CRISPR; 4.92; 2022–2024) all showed sustained burst intervals ending in 2024. Their progressively later onset years indicate the sequential emergence of alternative therapeutic and technology-enabled research topics. Because separate annual keyword-frequency growth rates were not calculated, these terms are described as burst-detected research frontiers rather than as topics with demonstrated year-on-year growth.
DATA AVAILABILITY:
The bibliographic records analyzed in this study were retrieved from the Web of Science Core Collection and the China National Knowledge Infrastructure (CNKI) under their respective database access and licensing conditions. These source records are subject to database licensing restrictions and cannot be redistributed by the authors. The search strategy and screening procedures are reported in the manuscript and Supplementary Figure 1, while annual publication counts are provided in Supplementary Table 1. The bibliographic records of the 3,096 publications included in the final analysis are provided in Supplementary Table 2, comprising 2,000 Web of Science Core Collection records and 1,096 CNKI records. The antimicrobial-resistance surveillance data were derived from publicly available China Antimicrobial Resistance Surveillance System (CARSS) annual reports.
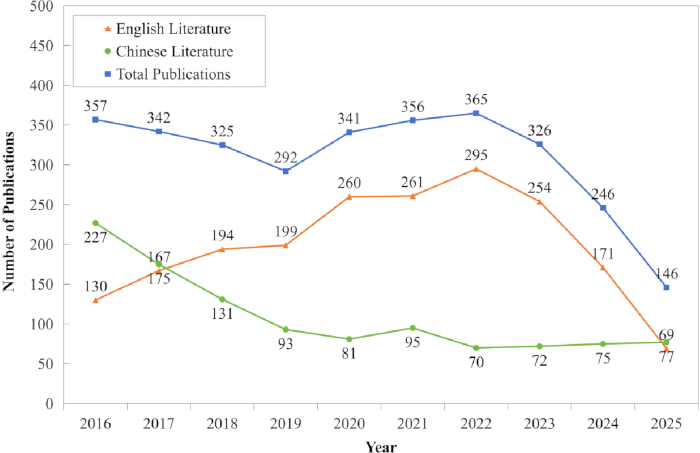
Figure 1: Annual publication output of antimicrobial resistance research in China from 2016 to 2025 (n = 3,096 publications). The figure presents annual English-language, Chinese-language, and total publication counts. English-language output increased from 130 publications in 2016 to 295 in 2022 and declined to 69 in 2025. Please click here to view a larger version of this figure.
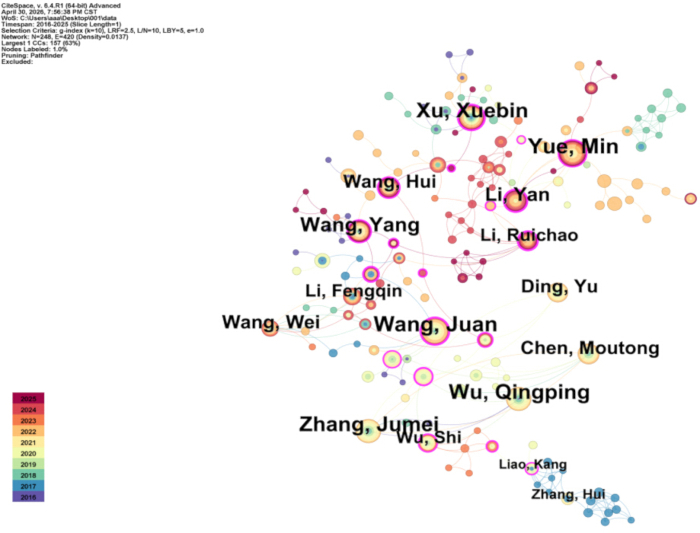
Figure 2: Author collaboration network generated from the 2,000 SCI-E publications on antimicrobial resistance in China included in the analysis (2016–2025). The network visualizes co-authorship relationships among authors publishing on AMR in China. Node size represents publication count; line thickness indicates collaboration frequency. Node colors follow the CiteSpace default time-zone gradient: purple nodes represent the earliest publications (2016–2017); blue nodes represent the middle period (2018–2021); and red/orange nodes represent the recent publications (2022–2025). Centrality is not explicitly encoded in node color; instead, nodes with high betweenness centrality (>0.1) are highlighted with an outer ring in the visualization. The network comprises 248 author nodes and 420 collaboration links (density = 0.0137). Prominent authors include Wang Juan, Yue Min, Xu Xuebin, Wu Qingping, and Zhang Jumei. The largest connected component contains 157 authors (63% of the network). Pruning was performed using the Pathfinder algorithm to enhance structural clarity. The relatively low network density indicates limited cross-institutional collaboration, with research activities concentrated within a few major research groups. Data source: Web of Science Core Collection; analyzed using CiteSpace. Please click here to view a larger version of this figure.
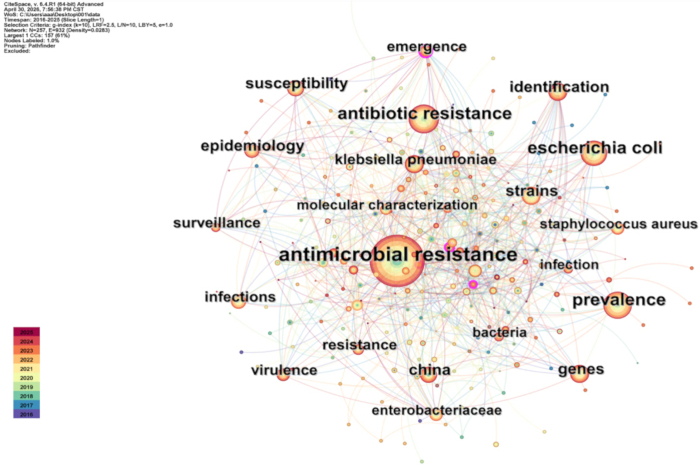
Figure 3: Keyword co-occurrence network generated from the 2,000 SCI-E publications included in the keyword analysis (2016–2025). Node size represents keyword frequency; line thickness indicates co-occurrence strength. Colors follow the CiteSpace time-zone gradient from purple (2016) through blue (2018–2021) to red/orange (2022–2025). Centrality values are not displayed as colors; instead, node labels are sized proportionally to betweenness centrality, with larger labels indicating greater bridging importance. The network comprises 257 keyword nodes and 932 co-occurrence links (density = 0.0283). The largest connected component contains 157 keywords (61% of the network). High-frequency keywords include “antimicrobial resistance,” “Klebsiella pneumoniae,” “Escherichia coli,” “Staphylococcus aureus,” “prevalence,” and “molecular characterization,” reflecting the dominant research themes of resistance surveillance and molecular epidemiology. The network demonstrates stronger interconnectivity compared to the author collaboration network, indicating thematic coherence across different research topics. Data source: Web of Science Core Collection; analyzed using CiteSpace. Please click here to view a larger version of this figure.
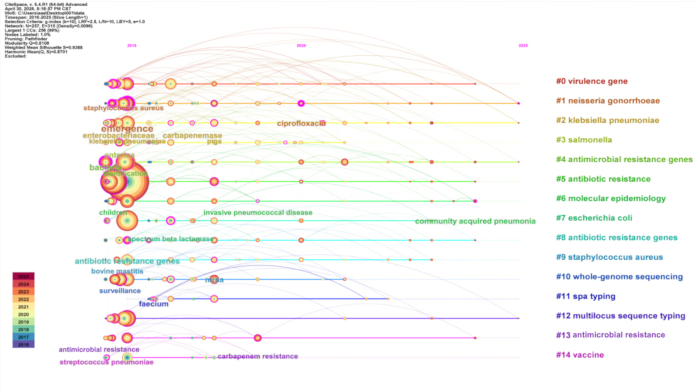
Figure 4: Keyword cluster timeline generated from the 2,000 SCI-E publications included in the keyword analysis (2016–2025). Each horizontal line represents a research cluster (#0–#14), with nodes indicating individual keywords appearing in that year. Node size represents keyword frequency. The clustering analysis was performed using the Log-Likelihood Ratio (LLR) algorithm, yielding 15 distinct clusters with excellent structural validity (modularity Q = 0.8108, mean silhouette S = 0.9388). The six major clusters discussed in the text represent the most prominent clusters (#0, #2, #4, #5, #6, #7). The timeline view reveals temporal shifts in research focus: early clusters (2016–2018) concentrated on surveillance and molecular epidemiology, while later-emerging clusters incorporated advanced genomic tools. The network comprises 257 keyword nodes and 315 co-occurrence links (density = 0.0096), with the largest connected component containing 256 nodes (99% of the network). Data source: Web of Science Core Collection; analyzed using CiteSpace. Please click here to view a larger version of this figure.
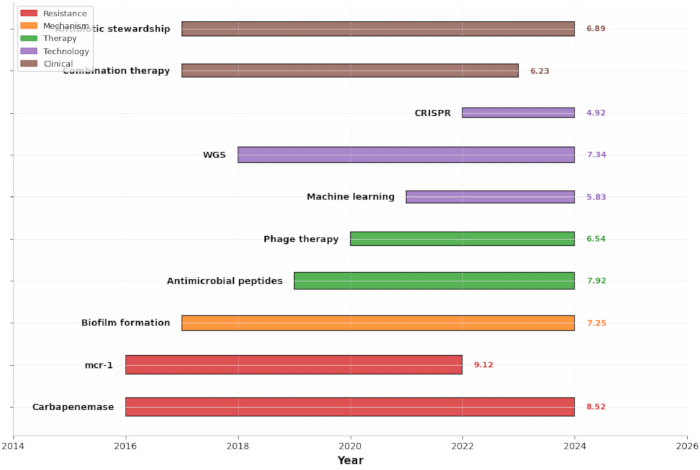
Figure 5: Top 10 burst keywords detected from the SCI-E publication dataset on antimicrobial resistance in China (2016–2025). Each bar represents a keyword with its burst strength (numerical value). Red segments indicate the detected burst intervals, and blue segments indicate years without a detected burst. The horizontal time axis covers the complete study period from 2016 to 2025. The beginning and ending years of each red segment correspond exactly to the “Begin” and “End” values reported in Table 5. The strongest bursts were observed for mcr-1 (9.12, 2016–2022) and carbapenemase (8.52, 2016–2024), reflecting their sustained dominance as research drivers. Burst keywords are categorized into five thematic groups: Resistance genes (mcr-1); Resistance mechanisms (carbapenemase, biofilm formation); Novel therapies (antimicrobial peptides, phage therapy); Clinical management (antimicrobial stewardship, combination therapy); and Technologies (WGS, machine learning, CRISPR). Keywords with burst strength >3.0 are considered significant. Data source: Web of Science Core Collection; analyzed using CiteSpace. Please click here to view a larger version of this figure.
| Rank | Author | Institution | Papers | Centrality |
| 1 | Wang Juan | South China Agricultural University | 44 | 0.2 |
| 2 | Yue Min | Zhejiang University | 44 | 0.15 |
| 3 | Xu Xuebin | Shanghai Municipal Center for Disease Control and Prevention | 42 | 0.2 |
| 4 | Wu Qingping | Institute of Microbiology, Guangdong Academy of Sciences | 42 | 0.01 |
| 5 | Zhang Jumei | Institute of Microbiology, Guangdong Academy of Sciences | 41 | 0.04 |
| 6 | Wang Yang | China Agricultural University | 35 | 0.11 |
| 7 | Li Yan | Zhejiang University | 30 | 0.23 |
| 8 | Wang Wei | China National Center for Food Safety Risk Assessment | 26 | 0.03 |
| 9 | Chen Moutong | Institute of Microbiology, Guangdong Academy of Sciences | 25 | 0.07 |
| 10 | Wang Hui | Peking University People's Hospital | 24 | 0.12 |
Table 1: Top 10 Most Prolific Authors in AMR Research (2016-2025). Publication count represents author productivity. Betweenness centrality measures the extent to which an author connects otherwise separate parts of the collaboration network; higher values indicate a stronger bridging role. Publication count and centrality were interpreted as separate bibliometric indicators.
| Rank | Institution | City | Publications | Total citations |
| 1 | Zhejiang University | Hangzhou | 195 | 10,660 |
| 2 | South China Agricultural University | Guangzhou | 112 | 7,496 |
| 3 | China Agricultural University | Beijing | 99 | 7,275 |
| 4 | Yangzhou University | Yangzhou | 97 | 2,227 |
| 5 | Shanghai Jiao Tong University | Shanghai | 94 | 3,437 |
| 6 | Chinese Academy of Medical Sciences - Peking Union Medical College | Beijing | 91 | 3,138 |
| 7 | Chinese Center for Disease Control & Prevention | Beijing | 84 | 2,657 |
| 8 | Chinese Academy of Sciences | Beijing | 84 | 4,903 |
| 9 | Chinese Academy of Agricultural Sciences | Beijing | 79 | 1,988 |
| 10 | Fudan University | Shanghai | 78 | 3,392 |
Table 2: Top 10 Research Institutions by Publication Output (2016-2025). Publication count and total citations are as of April 28, 2026. Geographic distribution shows Beijing (5 institutions in top 10: China Agricultural University, Chinese Academy of Medical Sciences – Peking Union Medical College, Chinese Center for Disease Control and Prevention, Chinese Academy of Sciences, and Chinese Academy of Agricultural Sciences), Shanghai (2: Shanghai Jiao Tong University and Fudan University), and one each in Hangzhou (Zhejiang University), Guangzhou (South China Agricultural University), and Yangzhou (Yangzhou University). The institutional network demonstrated clear geographic clustering, with Beijing and Shanghai accounting for 7 of the top 10 institutions, indicating a concentration of research capacity in eastern metropolitan regions.
| Rank | Keyword | Frequency | Centrality | Category |
| 1 | Antimicrobial Resistance | 1167 | 0.92 | General AMR concept |
| 2 | Carbapenem | 467 | 0.78 | Antimicrobial class |
| 3 | ESBL | 168 | 0.72 | Resistance mechanism/phenotype |
| 4 | MRSA | 156 | 0.68 | Resistant clinical pathogen |
| 5 | Biofilm | 134 | 0.65 | Resistance mechanism |
| 6 | CRE | 128 | 0.62 | Resistance phenotype/pathogen group |
| 7 | P. aeruginosa | 108 | 0.58 | Clinical pathogen |
| 8 | A. baumannii | 102 | 0.55 | Clinical pathogen |
| 9 | K. pneumoniae | 98 | 0.52 | Clinical pathogen |
| 10 | E. coli | 95 | 0.5 | Clinical pathogen |
Table 3: Top 10 High-Frequency Keywords in AMR Research (2016–2025). The category indicates the primary semantic role of each keyword in the antimicrobial-resistance literature. Keywords were classified as general AMR concepts, antimicrobial classes, resistance genes or mechanisms, resistance phenotypes, clinical pathogens, treatment or management terms, or surveillance and epidemiology terms, where applicable. In the present top-10 list, the represented categories were general AMR concepts, antimicrobial classes, resistance mechanisms or phenotypes, and clinical pathogens.
| Organism | 2016 | 2018 | 2022 | 2025 | Trend | p-value |
| MRSA | 48.80% | 35.80% | 27.20% | 25.80% | Declining | <0.001 |
| CRKP | 5.60% | 15.20% | 22.80% | 20.00% | Increasing | <0.001 |
| CRPA | 25.00% | 27.20% | 21.50% | 19.90% | Declining | 0.003 |
| CRAB | 56.00% | 64.50% | 76.80% | 76.50% | High-level | <0.001 |
| VRE | 1.50% | 2.90% | 5.20% | 6.50% | Increasing | <0.001 |
Table 4: Trends of Antimicrobial Resistance in Major Pathogens (2016–2025). Each horizontal line represents one of the 15 LLR-generated clusters (#0–#14), and each node represents a keyword appearing in the corresponding year. Node size represents keyword frequency. The six principal clusters discussed in the text are #0 “virulence gene,” #2 “Klebsiella pneumoniae,” #4 “antimicrobial resistance genes,” #5 “antibiotic resistance,” #6 “molecular epidemiology,” and #7 “Escherichia coli.” The clustering solution had a modularity Q of 0.8108 and a mean silhouette S of 0.9388.
| Rank | Keyword | Burst | Begin | End | Category |
| 1 | mcr-1 | 9.12 | 2016 | 2022 | Resistance gene |
| 2 | Carbapenemase | 8.52 | 2016 | 2024 | Resistance mechanism |
| 3 | Antimicrobial peptides | 7.92 | 2019 | 2024 | Novel therapy |
| 4 | Biofilm formation | 7.25 | 2017 | 2024 | Resistance mechanism |
| 5 | WGS | 7.34 | 2018 | 2024 | Molecular typing |
| 6 | Antibiotic stewardship | 6.89 | 2017 | 2024 | Clinical management |
| 7 | Phage therapy | 6.54 | 2020 | 2024 | Novel therapy |
| 8 | Combination therapy | 6.23 | 2017 | 2023 | Treatment strategy |
| 9 | Machine learning | 5.83 | 2021 | 2024 | Technology |
| 10 | CRISPR | 4.92 | 2022 | 2024 | Technology |
Table 5: Top 10 Burst Keywords Indicating Research Frontiers (2016–2025). Burst strength and burst duration were used as the quantitative indicators of frontier activity. Separate annual keyword-frequency growth rates were not calculated. Burst strength was calculated using CiteSpace burst detection algorithm (Kleinberg's algorithm) with default parameters (γ = 1.0, minimum duration = 2 years). Keywords with burst strength >3.0 are considered significant. “Begin” and “End” indicate the first and last year of the burst period, as visualized in Figure 5. The category column reflects the thematic classification of each burst keyword. The strongest bursts were observed for mcr-1 (9.12, 2016–2022) and carbapenemase (8.52, 2016–2024), indicating their central roles as research drivers. Notably, novel therapeutic approaches (antimicrobial peptides, phage therapy) and emerging technologies (machine learning, CRISPR) showed sustained burst activity through 2024, signaling a paradigm shift toward innovation-driven AMR research. The analytical time window was 2016–2025. A burst ending in 2024 indicates that no significant burst was detected for that keyword in 2025; it does not indicate that the overall analytical time window ended in 2024.
Supplementary Figure 1: PRISMA-style flow diagram of literature identification, screening, and inclusion. A total of 5,286 database records were initially identified, including 3,043 records from the Web of Science Core Collection Science Citation Index Expanded (SCI-E), 983 records from the Peking University Core Journals category of the China National Knowledge Infrastructure (CNKI), 802 records from the Chinese Science Citation Database category, and 462 records from the World Journal Clout Index category. Because the three CNKI categories were overlapping, category-specific records were consolidated before screening. Duplicate records were identified using DOI matching where available, followed by comparison of article titles, first-author names, and publication years, with manual review of uncertain matches. After combined deduplication and eligibility screening, 2,190 records were removed, and 3,096 publications were included, comprising 2,000 English-language SCI-E publications and 1,096 Chinese-language CNKI publications.Please click here to download this file.
Supplementary Table 1: Annual publication output of antimicrobial resistance research in China from 2016 to 2025. Annual numbers of English-language and Chinese-language publications included in the bibliometric analysis are presented together with the total publication count for each year. The final dataset comprised 3,096 publications.Please click here to download this file.
Supplementary Table 2: Bibliographic records of publications included in the final bibliometric analysis. The table lists the 3,096 publications included in the final analytical dataset, comprising 2,000 English-language records from the Web of Science Core Collection and 1,096 Chinese-language records from the China National Knowledge Infrastructure (CNKI). Please click here to download this file.
Discussion
The bibliometric patterns suggest that AMR research in China gradually broadened from descriptive surveillance and pathogen characterization toward resistance mechanisms, genomic approaches, and intervention-oriented research. The overlapping keyword clusters and burst periods indicate cumulative thematic diversification rather than three discrete and mutually exclusive stages. The timing of these changes overlapped with the National Action Plans to Contain Antimicrobial Resistance for 2016–2020 and 2022–2025, which provide relevant policy context; however, the present bibliometric analysis cannot establish that the policy releases caused the observed changes in publication themes. The increase in publications reflects both the growing (2019–2021) severity of the AMR crisis and increased governmental and institutional commitment to addressing this challenge. Accordingly, the proposed evolution of research themes should be interpreted descriptively and was not independently validated using milestone-paper or stage-specific highly cited-paper analysis. When placed in the global context, China's research output trajectory aligns with broader patterns observed across emerging economies, where AMR publication volume has expanded exponentially in response to rising resistance burdens21.
The decline in publication output after the 2022 peak coincided with the implementation period of the second National Action Plan to Contain Antimicrobial Resistance (2022–2025), whereas the earlier expansion followed the first action plan (2016–2020). This temporal correspondence may reflect changes in research priorities, funding allocation, and publication patterns across successive policy phases rather than a simple reduction in AMR research activity. However, publication and indexing lag, database coverage, and the study eligibility criteria may also have contributed to the apparent decline, particularly in the later years. The present bibliometric analysis, therefore, cannot establish a causal relationship between either the national action plan and publication output.
The collaborative network analysis reveals a highly centralized structure with Wang Juan, Yue, Min, and Zhejiang University serving as critical hubs connecting regional research centers. However, the limited cross-regional collaboration (network density = 0.0137) suggests that the low collaboration-network density is limited connectivity among research groups; however, no formal East/Central/West regional publication analysis was performed. A feasible cross-regional collaboration framework could use CARSS as the national surveillance and data-coordination backbone, regional medical consortia as the units for harmonizing specimen collection, susceptibility-testing procedures, and multicenter clinical validation, and university research platforms as centers for genomic sequencing, bioinformatics, and methodological development. Shared data dictionaries, de-identified interoperable datasets, regular cross-regional benchmarking, and joint early-warning projects could help translate surveillance signals into research priorities and locally adapted stewardship actions. This proposed framework represents an implementation pathway derived from the network findings rather than an intervention evaluated directly in the present study.
The divergent resistance trends identified in this study carry profound clinical implications. The dramatic decline in MRSA (48.8%→25.8%; β = –2.43% per year, p < 0.001) demonstrates that coordinated national interventions—including mandatory surveillance, hand hygiene campaigns, and antimicrobial stewardship—can effectively combat resistant pathogens22.
The divergent trajectories probably reflect differences among pathogens in antimicrobial selection pressure, resistance mechanisms, ecological persistence, transmission dynamics, and responsiveness to infection-control measures. The decline in MRSA may be associated with the broader implementation of surveillance and infection-control programs, whereas the increasing or persistently high resistance among CRKP and CRAB may reflect the continuing dissemination of carbapenem-resistance determinants and the difficulty of controlling multidrug-resistant Gram-negative organisms. The modest decrease in CRPA indicates that resistance trends cannot be generalized across all carbapenem-resistant pathogens. Similarly, the increase in VRE from a relatively low baseline requires continued monitoring. Because these factors were not directly measured, they should be regarded as plausible interpretations rather than demonstrated causal mechanisms.
Consistent with the burst analysis, mcr-1 and carbapenemase remained prominent research topics, reflecting sustained attention to mobile colistin resistance and carbapenem-resistant organisms. The emergence of antimicrobial peptides and phage therapy indicates growing interest in alternatives to conventional antibiotics, while whole-genome sequencing, machine learning, and CRISPR reflect increasing attention to genomic surveillance, resistance prediction, and gene-targeted approaches. Recent studies have further highlighted the potential applications of artificial intelligence in AMR surveillance, resistance-marker identification, biofilm analysis, diagnostics, and antimicrobial discovery12,23,24,25.
However, the detection of these terms as research frontiers does not indicate clinical readiness. Machine-learning models require standardized multicenter datasets, external and prospective validation, model interpretability, and integration with laboratory and clinical workflows. Phage therapy faces challenges involving strain specificity, manufacturing consistency, quality control, resistance evolution, and regulatory standardization, whereas CRISPR-based antibacterial strategies remain constrained by delivery efficiency, off-target effects, biosafety, and containment requirements. International research increasingly emphasizes multicenter validation, standardized manufacturing, and regulatory pathways; these dimensions should also be considered when evaluating the translational maturity of research conducted in China. Because the present study did not quantitatively compare domestic and international clinical-development stages, this interpretation remains qualitative.
Studies conducted across diverse clinical populations and infection settings demonstrate substantial variation in pathogen distribution and antimicrobial-resistance profiles26,27,28,29,30,31,32,33,34,35,36,37,38. Collectively, these reports indicate that resistance patterns are influenced by patient characteristics, infection sites, antimicrobial exposure, and local epidemiology. Carbapenem-resistant Gram-negative pathogens remain a recurring concern across multiple settings, while empirical treatment should be guided by local surveillance and standardized susceptibility testing. Evidence concerning combination therapy, β-lactam/β-lactamase inhibitor combinations, tetracycline derivatives, and other alternative treatments also provides a clinical context for the therapeutic themes identified by the keyword and burst analyses30,39.
Consistent with the keyword and cluster findings, biofilm formation remains an important phenotypic mechanism contributing to antimicrobial tolerance and therapeutic failure. Studies of Cutibacterium acnes illustrate how structured microbial communities can enhance tolerance through physical barriers and altered microenvironments40. Non-coding RNAs have also emerged as potential regulators of resistance-gene expression in Acinetobacter baumannii41. In parallel, next-generation β-lactamase inhibitors, tetracycline derivatives, and combination regimens have expanded research into therapeutic options for carbapenem-resistant organisms42. These developments remain clinically relevant given the persistent high-level resistance of Klebsiella pneumoniae and Acinetobacter baumannii reported in national surveillance data43.
Healthcare worker perspectives on antimicrobial resistance, particularly in specialized contexts such as chronic respiratory disease, emphasize the critical importance of human behavioral factors in stewardship success44. Furthermore, nationwide analyses of factors associated with clinical antimicrobial resistance have identified antibiotic consumption density as a primary driver, confirming that increased utilization of carbapenems and third-generation cephalosporins directly correlates with escalating resistance in Pseudomonas aeruginosa and other Gram-negative pathogens45.
Several limitations should be acknowledged. First, differences in database coverage, indexing practices, field structures, and Chinese- and English-language terminology may have introduced retrieval bias and may have prevented complete matching of semantically equivalent records. The present study did not conduct a separate thematic analysis of the Chinese- and English-language corpora; therefore, language-specific differences in research emphasis could not be quantitatively evaluated. Second, bibliometric indicators cannot directly evaluate the methodological quality or risk of bias of individual studies, and citation-based measures may favor older, highly visible, or internationally indexed publications. Third, the exclusion of veterinary and environmental studies without an explicit human-health component, together with the limited coverage of conference proceedings, institutional reports, theses, and other grey literature, may underrepresent the broader One Health AMR landscape, particularly evidence from community and rural settings. The exclusion of systematic reviews and meta-analyses without new primary datasets may also underrepresent the contribution of evidence synthesis to hotspot formation. Fourth, publication and indexing lags may have reduced the representation of studies published near the end of the study period. Fifth, the Kleinberg burst-detection algorithm may generate false-positive signals when keywords show short-lived or sporadic temporal fluctuations. In addition, a formal sensitivity analysis of the CiteSpace parameter settings was not performed; therefore, the robustness of the network, clustering, and burst results under alternative CiteSpace parameter choices was not assessed. The absence of formal synonym consolidation may have fragmented semantically equivalent keywords and may have affected keyword-frequency and network estimates. Because no formal East/Central/West China publication analysis was performed, regional differences in publication output could not be quantitatively assessed.
Future studies should test alternative burst-sensitivity parameters and minimum-duration thresholds, apply transparent synonym dictionaries, compare results across independent databases, and triangulate burst signals with annual keyword frequencies and expert review. A dedicated analysis of the top highly cited papers was not performed; future studies could incorporate milestone-paper analysis to further characterize and independently validate temporal changes in AMR research themes. A dual-map overlay analysis was also beyond the scope of the present study and may be considered in future work to characterize journal-level citation pathways.
The bibliometric patterns suggest that AMR research in China has increasingly shifted from descriptive surveillance toward mechanistic investigation and innovative intervention development. While significant progress has been made in controlling MRSA through comprehensive stewardship, carbapenem-resistant Gram-negative pathogens remain a critical threat requiring urgent attention. The emergence of AI-driven prediction models, phage therapy, and CRISPR-based interventions may provide future opportunities for addressing AMR, although their translation from laboratory research to clinical practice remains challenging. The findings support continued surveillance, stronger inter-regional collaboration, and sustained research into both conventional antibiotics and emerging therapeutic strategies.
Disclosures
The authors declare that generative artificial intelligence (AI) tools were used in the preparation of this manuscript as follows: Grammarly (version 1.2.3) was used for language polishing and grammatical correction of the final manuscript draft; OpenAI's ChatGPT (GPT-4, accessed via API on March 15, 2026) was used to assist with bibliometric data cleaning and to generate initial Python scripts for data preprocessing; No AI tool was used to generate the scientific findings, interpret results, or formulate the conclusions; All figures and tables were generated directly from CiteSpace and R 4.3.2 outputs without AI-assisted generation. The authors have reviewed and verified all content generated with AI assistance and take full responsibility for the accuracy and integrity of the manuscript.
Acknowledgements
The authors sincerely thank the Infectious Department at The Affiliated People’s Hospital of Ningbo University (Yinzhou People’s Hospital) for providing the administrative and technical support required to complete this manuscript.
This research was funded by Ningbo Medical and Health Leading Academic Discipline Project (Grant No.2026-A42).
Materials
| Name | Company | Catalog Number | Comments |
|---|---|---|---|
| CiteSpace | Drexel University, Philadelphia, PA, USA | version 6.4.R1 | To perform comprehensive bibliometric analysis, including co-authorship analysis, keyword co-occurrence analysis, cluster analysis, and burst detection. |
| China National Knowledge Infrastructure (CNKI) | China National Knowledge Infrastructure | Not applicable | To compile research articles provided by Chinese domestic sources. |
| R | R software | version 4.3.2 | |
| Web of Science Core Collection (SCI-E) | Web of Science | Not applicable | To systematically search and retrieve international literature. |
References
- World Health Organization. Global action plan on antimicrobial resistance. World Health Organization; Geneva; 2015.
- O’Neill J. Tackling drug-resistant infections globally: Final report and recommendations. 2016.
- Bockstael K, Van Aerschot A. Antimicrobial resistance in bacteria. Open Med. 2009;4(2):141–155.
- Okeke IN, de Kraker MEA, Van Boeckel TP. The scope of the antimicrobial resistance challenge. Lancet. 2024;403(10442):13.
- Bhattacharya R, et al. Impact of antimicrobial resistance on sustainable development goals and the integrated strategies for meeting environmental and socio-economic targets. Environ Prog Sustain Energy. 2024;43(1):e14320.
- Duffey M, Shafer RW, Timm J. Combating antimicrobial resistance in malaria, HIV and tuberculosis. Nat Rev Drug Discov. 2024;23(6):19.
- Xiao YH, et al. Epidemiology and characteristics of antimicrobial resistance in China. Drug Resist Updat. 2011;14(4):236–241.
- Yin X, et al. A systematic review of antibiotic utilization in China. J Antimicrob Chemother. 2013;68(11):2445–2452.
- National Health Commission of the People’s Republic of China. National action plan to contain antimicrobial resistance (2022–2025). 2022.
- Borromeo AS, Manaloto AM, Antonio RP. Southeast Asian landscape of antimicrobial resistance research (2014–2024): A bibliometric analysis. J Glob Antimicrob Resist. 2025;45(c):125–132.
- Fekadu A, Woldeamanuel Y, Hailu A. Global trends and projections in antimicrobial resistance. Lancet. 2025;(10493):405.
- Selvaraj V, Sudhakar S, Sekaran S. Global trends and projections in antimicrobial resistance. Lancet. 405(10493):413–414.
- Bhattacharya R, et al. A One health plan to combat antimicrobial resistance for improving global health through sustainable development. Discov Public Health. 2025;22(1):521.
- Chen C, Leydesdorff L. Patterns of connections and movements in dual-map overlays: A new method of publication portfolio analysis. J Assoc Inf Sci Technol. 2014;65(2):334–351.
- Persson O, Danell R, Schneider JW. Using the BIBLIOMETRIX package for bibliometric analysis. Scientometrics. 2009;80(2):253–275.
- Bhattacharya R, et al. Bibliometric assessment of the global research trends in antimicrobial resistance for fungal species. Ind Biotechnol. 2024;20(5):212–224.
- Zhu J, Zhou Y, Ding YQ. Visualization analysis of hotspots and trends of drug control institutions in China based on bibliometrics. Chin J Mod Appl Pharm. 2023;40(18):2591–2599.
- Chen C. Science mapping: A systematic review of the literature. J Data Inf Sci. 2017;2(2):1–40.
- Wang S, Shen J, Yang Y. MRSA in China: Epidemiology, resistance mechanisms, and control strategies. Chin J Antibiot. 2021;46(9):837–844.
- Zhou W, Wen Z, Zhu W. Factors associated with clinical antimicrobial resistance in China: A nationwide analysis. Infect Dis Poverty. 2025;14:27.
- Sweileh WM, Al-Jabi SW, Zyoud SH. Global research output in antimicrobial resistance among uropathogens: A bibliometric analysis (2002–2016). J Glob Antimicrob Resist. 2017;11:230–238.
- Cui L, Li Y, Cheng L. Effectiveness of an antimicrobial stewardship program in reducing antimicrobial use and microbial resistance in a tertiary hospital in China. J Glob Antimicrob Resist. 2019;17:168–174.
- Yang Y, Li Y, Wang Z. Machine learning-enabled prediction of antimicrobial resistance from whole-genome sequencing data. J Clin Microbiol. 2021;59(10):e00821-21.
- Bhattacharya R, et al. Artificial intelligence for sustainable solutions in combating antimicrobial resistance through data driven health innovations. Discov Public Health. 2026;23(1):10.
- Yosef I, Manor M, Kiro R. Temperate and lytic bacteriophages programmed to sensitize and kill antibiotic-resistant bacteria. Proc Natl Acad Sci U S A. 2015;112(23):7267–7272.
- Shou TJ, Cheng XQ, Gong S. Analysis of antimicrobial use strategy in childhood perforated appendicitis based on bacterial resistance changes. Chin Gen Pract. 2020;23(24):3070–3074.
- China Antimicrobial Resistance Surveillance System. Surveillance of antimicrobial resistance in bacteria isolated from cerebrospinal fluid specimens from 2020 to 2024. Chin J Infect Chemother. 2026;26(2):196–205.
- Gao YH, Ma XY, Wang DB. Distribution and drug resistance of pathogens causing acute bacterial conjunctivitis in children. J Pathog Biol. 2024;19(10):1194–1197.
- Zhang Y, Fan YY, Yao LH. Drug resistance and risk factors of multidrug-resistant bacteria in neonatal pneumonia. J Pathog Biol. 2020;15(11):1340–1343.
- Duan MB, He XZ, Qi JY. Research progress on anti-multidrug resistant bacteria drugs. J Shenyang Pharm Univ. 2023;40(12):1680–1690.
- Zhou LC, Li GQ, Xu BY. Distribution and drug resistance of pathogens in acute, delayed and chronic periprosthetic joint infections. Chin J Surg. 2021;59(6):484–490.
- Zhang XX, Ge W, Yang M. Analysis of resistance of 137 Neisseria gonorrhoeae strains to 5 antimicrobial agents. Chin J Dermatovenereol. 2022;36(2):199–203.
- Zhang XY, Han Y, Wang YM. Correlation analysis between antimicrobial resistance of Pseudomonas aeruginosa and antimicrobial use density. J Hebei Univ Nat Sci Ed. 2021;41(2):188–194.
- China Antimicrobial Resistance Surveillance System. Antimicrobial resistance surveillance report of common clinical isolates from elderly patients from 2014 to 2019. Chin J Infect Control. 2021;20(2):112–123.
- Ruan ZH, Huang AX, Wang XJ. Overview of CLSI, EUCAST and Chinese drug resistance judgment standards. Biotechnol Bull. 2022;38(9):47–58.
- Liu L, Feng CX, Wang Y. Analysis of bacterial resistance in the First Hospital of Qiqihar in 2016. Chin J Antibiot. 2021;46(12):1143–1147.
- Zhang XH, Chen JY, Yang H. Distribution and antimicrobial resistance of pathogens in early infection after lung transplantation in respiratory intensive care unit. Chin J Infect Control. 2020;19(9):785–790.
- Wang SS, Wu ZW, Zhao JP. Research progress on hospital infection, drug resistance and treatment of carbapenem-resistant Klebsiella pneumoniae. Chin J Antibiot. 2020;45(5):428–432.
- Lv YF, Xue M, Huang XY. Research progress on antimicrobial peptides combined with traditional antibiotics against bacterial resistance. Chin J Infect Control. 2023;22(10):1266–1273.
- Ma Y, Liu Y, Jiang M. Correlation analysis between biofilm formation and antimicrobial resistance of Cutibacterium acnes. Chin J Infect Chemother. 2021;21(6):703–707.
- Peng Q, Ling BD. Regulatory non-coding RNAs and antimicrobial resistance in Acinetobacter baumannii. Chin J Infect Control. 2021;20(12):1174–1178.
- Qin XH, Hao M, Wang MG. Research progress on new antimicrobial agents. Chin J Infect Chemother. 2024;24(4):489–496.
- Guo Y, Ding L, Hu FP. CHINET surveillance of bacterial resistance in China in 2024. Chin J Infect Chemother. 2025;25(6):597–607.
- Ananth S, Adeoti A, Ray A. Healthcare worker views on antimicrobial resistance in chronic respiratory disease. Eur Respir J. 2024;64(68):2.
- Holt KE. Microbial genomics for antimicrobial resistance ecology and action. Nat Rev Genet. 2026;27(1):7–8.