This retrospective cohort study aimed to develop and chronologically validate a three-variable model for predicting postoperative pulmonary complications after robotic-assisted anatomical segmentectomy. Age ≥ 65 years was the only statistically significant adjusted predictor. The model showed modest development-cohort discrimination and requires external multicenter validation before clinical implementation.
Research Article
Retrospective Nomogram Development for Postoperative Pulmonary Complications After Robotic-Assisted Anatomical Segmentectomy
In This Article
Summary
Abstract
Postoperative pulmonary complications (PPCs) remain among the most common adverse events following thoracic surgery, contributing to increased morbidity and prolonged hospital stay. With the growing adoption of robotic-assisted thoracic surgery for anatomical segmentectomy, procedure-specific data on PPC risk stratification remain limited. This retrospective cohort study aimed to evaluate risk factors for PPCs in patients undergoing da Vinci robotic-assisted anatomical segmentectomy and to develop and chronologically validate a nomogram-based prediction model using a homogeneous robotic cohort. The study included 200 patients in the development cohort and 102 patients in the temporal validation cohort. Univariable and multivariable logistic regression analyses were performed in the development cohort, and a three-variable prediction model incorporating age ≥65 years, smoking history, and forced expiratory volume in 1 second (FEV1) <70% predicted was evaluated. Model discrimination was assessed using the area under the receiver operating characteristic curve (AUC), and calibration was assessed using the Hosmer–Lemeshow test and calibration slope. Overall, 64 of 302 patients (21.2%) developed PPCs. In the development cohort, age ≥65 years was independently associated with PPCs (adjusted odds ratio [OR] 2.65, 95% confidence interval [CI] 1.29–5.44, P = 0.008), whereas smoking history (adjusted OR 1.91, 95% CI 0.93–3.91, P = 0.079) and FEV1 <70% predicted (adjusted OR 1.51, 95% CI 0.74–3.10, P = 0.259) were not statistically significant after adjustment. The three-variable model had an AUC of 0.69 (95% CI 0.60–0.78) in the development cohort and 0.85 (95% CI 0.76–0.92) in the temporal validation cohort. These findings support the potential value of a simple preoperative risk model, but external multicenter validation is required before broader clinical application.
Introduction
Postoperative pulmonary complications (PPCs) are among the most common and clinically significant adverse events following thoracic surgery. These complications include respiratory infection, pleural effusion, atelectasis, pneumothorax, bronchospasm, respiratory failure, and prolonged air leak. PPCs are associated with increased postoperative morbidity, prolonged hospitalization, greater intensive care utilization, delayed functional recovery, and higher healthcare costs1,2,3. Importantly, even non-fatal pulmonary complications can adversely affect early postoperative rehabilitation and quality of life following lung resection2. The reported incidence of PPCs after pulmonary resection ranges from approximately 15% to 30%, depending on patient characteristics, surgical approach, perioperative management strategies, and outcome definitions1,4,5. The development of PPCs is multifactorial, involving patient-related, anesthesia-related, and procedure-related factors. Established risk factors include advanced age, smoking history, chronic obstructive pulmonary disease (COPD), impaired preoperative pulmonary function, and higher perioperative risk status3,6,7,8. Intraoperative factors, such as prolonged operative duration, increased blood loss, and the effects of single-lung ventilation, may further compromise postoperative respiratory function9. Consequently, preoperative risk assessment, particularly using physiologic parameters such as forced expiratory volume in one second (FEV1), has become an integral component of surgical planning7,10. Despite advances in perioperative care and enhanced recovery pathways, PPCs remain a persistent clinical challenge4.
Over the past two decades, thoracic surgical practice has undergone substantial transformation with the adoption of minimally invasive techniques. Video-assisted thoracoscopic surgery (VATS) and, more recently, robotic-assisted thoracic surgery (RATS) have increasingly expanded the use of minimally invasive pulmonary resection11,12. Robotic platforms offer three-dimensional visualization, articulated instrumentation, and enhanced dexterity for anatomical dissection13,14. These technological advancements have facilitated the growing use of anatomical segmentectomy, particularly for small pulmonary nodules and early-stage non-small-cell lung cancer15,16. Comparative studies suggest that robotic pulmonary resection can achieve favorable perioperative outcomes, including shorter hospital stay and lower complication or conversion rates in selected settings12. However, the minimally invasive nature of robotic surgery does not eliminate the risk of PPCs. Intraoperative factors such as lung manipulation, temporary atelectasis during single-lung ventilation, and postoperative reductions in functional residual capacity continue to predispose patients to respiratory complications9. Moreover, smoking remains a clinically relevant patient-level determinant of postoperative pulmonary risk irrespective of the surgical platform2. As robotic-assisted anatomical segmentectomy becomes increasingly utilized for early-stage lung lesions, understanding the risk profile for PPCs in this specific population is of growing clinical importance.
Several predictive models for PPCs have been developed across diverse surgical populations. These models typically incorporate demographic, clinical, and perioperative variables to estimate the risk of postoperative respiratory complications5,17,18,19. However, most existing models were derived from heterogeneous cohorts that included open thoracotomy, VATS, and various pulmonary resection procedures. Differences in surgical techniques, perioperative management, and patient selection may limit the applicability of these models to contemporary robotic-assisted anatomical segmentectomy practice9. Furthermore, many models were developed before the widespread adoption of robotic techniques and lack validation in temporally independent cohorts. Nomograms provide a practical visual approach for translating multivariable regression models into individualized risk estimates. Although nomogram-based prediction tools have been applied in thoracic surgery, procedure-specific models developed and temporally validated within homogeneous robotic-assisted anatomical segmentectomy cohorts remain limited. This represents the principal research gap and provides the rationale for developing a simplified prediction model based on contemporary, procedure-specific data.
Therefore, the objectives of the present study were (1) to identify risk factors for PPCs in patients undergoing robotic-assisted anatomical segmentectomy and (2) to develop and temporally validate a nomogram-based prediction model using retrospective cohort data from a tertiary care center. The study was designed to evaluate whether readily available preoperative patient-level factors could provide a practical approach to PPC risk stratification in this contemporary surgical population.
Protocol
This retrospective observational cohort study was conducted at The People’s Hospital of Dazu Chongqing, China. Consecutive patients who underwent robotic-assisted anatomical segmentectomy for pulmonary nodules between May 2022 and May 2024 were retrospectively identified from institutional electronic medical records. Both the development and validation cohorts were assembled retrospectively; no prospective enrolment was performed. The study protocol was approved by the Ethics Committee of The People’s Hospital of Dazu Chongqing (Approval No. 2024LLSC083). Because only existing anonymized clinical data were used, the Ethics Committee waived the requirement for written informed consent. No participant was contacted for research-specific consent or additional study procedures. All procedures were conducted in accordance with the Declaration of Helsinki and relevant institutional guidelines. This study was reported in accordance with the TRIPOD statement20.
The institutional robotic surgical program was operational throughout the study period (May 2022–May 2024), and all robotic-assisted anatomical segmentectomies included in this study were performed using the da Vinci Xi robotic surgical system.
Cohort section
Study population and cohort definition:
Eligible patients were divided into two chronologically non-overlapping retrospective cohorts for model development and later-period validation. Patients who underwent surgery between May 2022 and May 2024 were retrospectively identified. Consecutive cases were identified by querying the institutional thoracic-surgery operative registry for all robotic-assisted anatomical segmentectomies performed during the study period and cross-checking the resulting list against the electronic medical record, anesthesia information system, and discharge records. Cases were screened in chronological order without sampling. According to chronological surgery date, patients treated from May 2022 through April 2023 formed the development cohort (n = 200), and patients treated from May 2023 through May 2024 formed the subsequent validation cohort (n = 102). The development cohort included operations performed from May 1, 2022, through April 30, 2023, and the validation cohort included operations performed from May 1, 2023, through May 31, 2024; these non-overlapping intervals accounted for all consecutive eligible cases during the study period. Thus, the validation cohort occurred after—not before—the development cohort. We use the term temporal validation to indicate later-period validation within the same institution; it is not external multicenter validation.
Inclusion and exclusion criteria
Inclusion criteria:
Patients were eligible if they had a radiologically confirmed pulmonary nodule on contrast-enhanced chest CT, underwent elective robotic-assisted anatomical segmentectomy, had complete perioperative clinical records, and met institutional criteria for adequate preoperative cardiopulmonary function. Adequate cardiopulmonary function was defined as the ability to tolerate elective segmentectomy after multidisciplinary assessment, including resting SpO2 ≥90% on room air, FEV1 ≥1.0 L or ≥40% predicted, New York Heart Association functional class I–II, and no decompensated heart failure, unstable coronary syndrome, or uncontrolled clinically significant arrhythmia.
Exclusion criteria:
Patients were excluded if the robotic procedure was converted to open thoracotomy, if a concurrent major surgical procedure was performed, if clinical or perioperative records required for the prespecified analyses were incomplete, or if the institutional perioperative management protocol could not be completed. Inability to complete the institutional perioperative management protocol was defined as failure to undergo the planned robotic segmentectomy under general anesthesia with lung isolation because of an uncorrectable airway-management problem, inability to tolerate OLV despite ventilatory rescue measures, or severe intraoperative hemodynamic instability requiring abandonment of the standardized pathway. A total of 302 patients met the eligibility criteria and were included in the final analysis.
Anesthetic and perioperative management
All procedures were performed under general anesthesia with one-lung ventilation (OLV). Anesthesia was induced with intravenous propofol (1.5–2.5 mg/kg), sufentanil (0.3–0.5 µg/kg), and rocuronium (0.6–0.9 mg/kg). A left-sided double-lumen endobronchial tube was used whenever feasible, and correct tube positioning was confirmed by fiberoptic bronchoscopy after intubation and again after lateral positioning when necessary. When a left-sided double-lumen tube was not feasible because of airway anatomy or surgical considerations, lung isolation was achieved with a bronchial blocker introduced through a single-lumen endotracheal tube; a right-sided double-lumen tube was used when clinically indicated. Anesthesia was maintained with propofol (4–8 mg/kg/h) and/or sevoflurane (0.5–1.0 minimum alveolar concentration), together with remifentanil (0.05–0.20 µg/kg/min), with additional neuromuscular blockade administered as clinically required.
During two-lung ventilation, tidal volume was generally maintained at 6–8 mL/kg predicted body weight. Predicted body weight was calculated from height as follows: male patients, 50 + 0.91 × [height (cm) − 152.4] kg; female patients, 45.5 + 0.91 × [height (cm) − 152.4] kg. During OLV, a lung-protective ventilation strategy was employed, with a tidal volume of 4–6 mL/kg predicted body weight and a positive end-expiratory pressure of approximately 5 cmH2O. The respiratory rate was generally adjusted within 12–18 breaths/min according to end-tidal carbon dioxide and arterial blood gas measurements. The inspired oxygen fraction was individually titrated to maintain adequate oxygenation, generally targeting an SpO2 of ≥92–94%. Airway pressures were monitored throughout OLV, with plateau pressure maintained below 30 cmH2O whenever feasible. Recruitment maneuvers and individualized adjustments of PEEP, tidal volume, respiratory rate, and FiO2 were performed when clinically indicated. The routine recruitment maneuver consisted of a sustained inflation to an airway pressure of 30 cmH2O for 10 s, repeated once if oxygenation or lung expansion remained inadequate, followed by restoration of the prescribed tidal volume and PEEP; the maneuver was stopped for hypotension or other hemodynamic intolerance. After completion of the thoracic procedure, bilateral ventilation was restored and lung recruitment was performed as appropriate.
A standardized multimodal analgesic strategy was routinely employed. Intraoperative opioid analgesia was primarily provided with remifentanil (0.05–0.20 µg/kg/min), with additional opioid administration when clinically indicated. Local anesthetic infiltration or intercostal nerve block with ropivacaine was performed according to the attending anesthesiologist's and surgeon's routine practice. Ropivacaine 0.375% (20–30 mL; maximum total dose 3 mg/kg) was used for port-site infiltration along the incision layers or for surgeon-performed intercostal nerve blocks at the involved interspaces, with approximately 3–5 mL injected per interspace after negative aspiration. Postoperative analgesia consisted of patient-controlled intravenous analgesia, generally maintained for 24–48 h, supplemented by non-opioid analgesics when not contraindicated. The standard patient-controlled intravenous analgesia solution contained sufentanil 2 µg/kg and ondansetron 8 mg diluted with 0.9% saline to 100 mL. The pump was programmed with a 2 mL/h background infusion, a 2 mL patient-controlled bolus, and a 15 min lockout interval; settings were reduced or temporarily suspended for excessive sedation, respiratory depression, hypotension, or severe nausea. Analgesic treatment was titrated to achieve adequate pain control, generally targeting a numerical rating scale (NRS) score of ≤3 at rest and ≤4 during coughing or mobilization.
At the completion of surgery, neuromuscular blockade was reversed as necessary.When residual neuromuscular blockade was present, neostigmine 0.04–0.05 mg/kg was administered intravenously with atropine 0.02 mg/kg, guided by clinical recovery and train-of-four monitoring when available. Tracheal extubation was considered when patients were awake and responsive to verbal commands, protective airway reflexes had recovered, spontaneous ventilation was adequate, hemodynamic status was stable, and body temperature was ≥36°C. Adequate recovery from neuromuscular blockade was confirmed by a train-of-four ratio ≥0.90 whenever quantitative monitoring was available. Respiratory criteria generally included a stable spontaneous respiratory pattern, a respiratory rate of approximately 10–25 breaths/min, clinically acceptable carbon dioxide elimination, and SpO2 ≥94% with low-level supplemental oxygen. Patients not meeting these criteria remained intubated and received further ventilatory support until clinically appropriate for extubation.
After extubation, supplemental oxygen was routinely administered by nasal cannula, generally at 2–4 L/min, and subsequently titrated according to oxygen saturation and clinical condition. SpO2, respiratory rate, hemodynamic variables, and signs of respiratory distress were monitored during the early postoperative period. Deep-breathing exercises, effective coughing, incentive spirometry when feasible, and early mobilization were encouraged as part of postoperative pulmonary care.
For patients who developed postoperative hypoxemia or were considered at increased risk of respiratory deterioration, respiratory support was escalated according to clinical need. High-flow nasal cannula oxygen therapy was generally initiated at a flow of approximately 30–50 L/min, with FiO₂ titrated according to oxygenation. Noninvasive ventilation was considered in patients with persistent respiratory insufficiency without contraindications. Arterial blood gas analysis was performed when clinically indicated. Reintubation and invasive mechanical ventilation were considered for progressive or refractory hypoxemia, clinically significant hypercapnic acidosis, respiratory muscle fatigue, impaired consciousness or airway protection, severe respiratory distress, or hemodynamic instability.
These perioperative management details are reported to improve reproducibility and describe the routine institutional approach to anesthesia, lung isolation, ventilation, analgesia, extubation, and postoperative respiratory care. They were not included as final preoperative prediction variables unless explicitly stated in the statistical analysis.
Definition and adjudication of postoperative pulmonary complications
PPCs were the primary outcome and included respiratory infection, atelectasis, pleural effusion, respiratory failure, pneumothorax, aspiration pneumonitis, bronchospasm, and persistent air leakage. Respiratory infection required antibiotic treatment for suspected infection plus at least one of new or changed sputum, new or progressive pulmonary opacity, fever >38°C, or leukocyte count >12 × 10^9/L. Atelectasis required radiographic lung opacification with volume loss. Pleural effusion required radiographic or ultrasonographic fluid accumulation with blunting of the costophrenic angle or compression of adjacent lung. Respiratory failure was defined as PaO2 <60 mmHg on room air, PaO2/FiO2 <300 mmHg, or SpO2 <90% requiring oxygen or ventilatory support. Pneumothorax required air in the pleural space on chest radiography or CT. Aspiration pneumonitis required a witnessed or strongly suspected aspiration event with new respiratory symptoms and compatible radiographic opacities. Bronchospasm required newly detected expiratory wheeze with increased airway resistance that prompted bronchodilator treatment. Complications were assessed during the postoperative hospitalization using information documented in the electronic medical record. Two thoracic surgeons independently reviewed postoperative progress notes, imaging reports, laboratory results, oxygen and ventilatory-support records, and treatment documentation using the prespecified criteria. Disagreements were resolved by consensus with a senior anesthesiologist. Persistent air leakage was defined in the analysis as air leakage lasting more than 5 postoperative days.
The analytic dataset recorded one adjudicated PPC-type category for each patient classified as having a PPC; therefore, the complication-type counts represent 64 PPC patients without double counting and total 64 events, with small percentage differences attributable to rounding. When more than one qualifying PPC occurred, the category judged to have caused the greatest escalation of respiratory support, therapeutic intervention, or prolongation of hospitalization was recorded as the primary PPC type; ties were resolved by consensus during adjudication. Standardized EPCO definitions and Clavien–Dindo grading were not documented in the available records for each PPC and were therefore not retrospectively imposed in this analysis.
Statistical analysis
Statistical analyses were performed using SPSS Statistics, version 26.0, and R, version 4.2.0. Continuous variables were summarized as mean ± standard deviation or median (interquartile range), as appropriate, and compared using Student’s t test or Mann–Whitney U test. Distributional assumptions were evaluated using the Shapiro–Wilk test together with inspection of histograms and Q–Q plots; approximately normally distributed variables were analyzed parametrically, whereas skewed variables were analyzed nonparametrically. Categorical variables were summarized as n (%) and compared using the chi-square test or Fisher’s exact test. Fisher’s exact test was used when any expected cell count was <5; otherwise, the chi-square test was used. In the development cohort, 44 PPC events were available. The final three-variable prediction model therefore had approximately 14.7 events per predictor (44/3). For the broader explanatory risk-factor analysis, candidate variables with univariable P < 0.25 were entered into multivariable logistic regression; backward stepwise elimination was not used for the final three-variable prediction model. Age ≥65 years, smoking history, and FEV1 < 70% predicted were retained a priori in the prediction model because they were preoperative, clinically interpretable variables supported by prior pulmonary-risk literature2,3,6,7,8. The age and FEV1 thresholds were clinically prespecified and were not selected by maximizing the ROC curve in this dataset. Adjusted odds ratios (ORs), 95% confidence intervals (CIs), regression coefficients, and the model intercept are reported. Multicollinearity was assessed by variance inflation factors (VIFs). In the final three-variable model, VIFs were 1.051 for age ≥65 years, 1.063 for smoking history, and 1.013 for FEV1 < 70% predicted. In the broader four-variable model including male sex, the corresponding VIFs were 1.056, 1.066, 1.016, and 1.009, respectively, indicating negligible multicollinearity.
Model development and validation
A three-variable nomogram-based prediction model incorporating age ≥65 years, smoking history, and FEV1 < 70% predicted was fitted in the development cohort using the rms package in R. These variables were prespecified for the prediction model on the basis of clinical availability, interpretability, and prior evidence, rather than retained solely because of individual P values. The broader risk-factor analysis additionally evaluated other candidate covariates identified through univariable screening. COPD was not retained in the final prediction model; using FEV1 as the pulmonary-reserve measure reduced the risk of simultaneously adjusting for two biologically related constructs. Procedural variables such as operative time and blood loss were not incorporated into the final model because the intended tool is preoperative; their associations were nevertheless described in the perioperative analyses.
A graphical nomogram was derived directly from the fitted three-variable logistic model. Calibration was assessed in both the development and temporal validation cohorts.
Model performance was assessed by discrimination (AUC), calibration, and resampling-based internal validation. Bootstrap resampling with 1,000 repetitions was used for internal validation. For each of 1,000 bootstrap samples drawn with replacement from the development cohort at the original sample size, the three-variable logistic model was refitted, and its AUC was calculated in both the bootstrap sample and the original development cohort. Optimism was defined as the bootstrap-sample AUC minus the test AUC in the original cohort; mean optimism across resamples was subtracted from the apparent development-cohort AUC to obtain the optimism-corrected AUC. The apparent development-cohort AUC was 0.688; mean bootstrap optimism was 0.020, yielding an optimism-corrected AUC of 0.668. Calibration intercept and slope were 0.00 and 1.00 in the development cohort and 0.97 and 2.09 in the validation cohort, respectively. The Hosmer–Lemeshow goodness-of-fit P value was also reported for both cohorts. The final model was then applied without coefficient re-estimation to the subsequent same-center validation cohort. This later-period validation is temporal/chronological internal validation and should not be interpreted as external multicenter validation.
Model discrimination was quantified using the area under the receiver operating characteristic curve (AUC), and calibration was evaluated using calibration plots, calibration intercept and slope, and the Hosmer–Lemeshow goodness-of-fit test. Internal validation used 1,000 bootstrap resamples for optimism correction. The final model was then applied without recalibration or coefficient re-estimation to the subsequent same-center validation cohort.
Final prediction model
The three-variable prediction model evaluated in this study included the preoperative variables age ≥65 years, smoking history, and FEV1 < 70% predicted. In the broader development-cohort multivariable risk-factor analysis, only age ≥65 years remained statistically significant after adjustment; smoking history and FEV1 < 70% predicted showed positive but non-significant adjusted associations. For prediction, the three prespecified model variables were refitted together in the development cohort. Each predictor was coded as 1 when present and 0 when absent. The final logistic regression equation was:
logit(P)=−2.1114 + 1.0009(Age≥65) + 0.6250(smoking history) + 0.4350(FEV1 < 70% predicted)
Worked clinical example:
For a patient aged ≥65 years with a smoking history and FEV1 < 70% predicted, all three predictor variables were coded as 1. The calculated logit was:
logit (P) = −2.1114 + 1.0009 + 0.6250 + 0.4350 = −0.0505
The corresponding predicted probability was:
P = 1 / (1 + e0.0505 ) ≈ 0.487
Thus, the model-estimated probability of a postoperative pulmonary complication for this example patient was approximately 48.7%.
Results
Patient characteristics
A total of 302 retrospectively collected patients were included, consisting of a development cohort (n = 200) and a subsequent same-center temporal validation cohort (n = 102). Overall, 64 patients (21.2%) developed PPCs. In the combined cohort, the mean age was 60.3 ± 10.3 years, and 166 patients (55.0%) were male. Compared with the non-PPC group, patients with PPCs were older, were less frequently male, had a higher prevalence of smoking history, and had lower mean FEV1 % predicted (Table 1 A).
| A. Overall cohort | ||||
| Variable | Total (n = 302) | PPC group (n = 64) | Non-PPC group (n = 238) | P value |
| Age (years), mean ± SD | 60.3 ± 10.3 | 65.3 ± 10.3 | 59.0 ± 9.8 | <0.001 |
| Male sex, n (%) | 166 (55.0) | 28 (43.8) | 138 (58.0) | 0.042 |
| BMI (kg/m²), mean ± SD | 24.7 ± 3.8 | 24.4 ± 3.3 | 24.8 ± 3.9 | 0.439 |
| Smoking history, n (%) | 130 (43.0) | 40 (62.5) | 90 (37.8) | <0.001 |
| COPD, n (%) | 58 (19.2) | 17 (26.6) | 41 (17.2) | 0.092 |
| ASA physical status ≥III, n (%) | 81 (26.8) | 20 (31.3) | 61 (25.6) | 0.368 |
| FEV₁ (% predicted), mean ± SD | 74.9 ± 11.5 | 71.6 ± 10.8 | 75.8 ± 11.5 | 0.007 |
| B. Development cohort | ||||
| Variable | Total (n = 200) | PPC group (n = 44) | Non-PPC group (n = 156) | P value |
| Age (years), mean ± SD | 60.1 ± 10.4 | 64.9 ± 10.1 | 58.8 ± 10.1 | 0.001 |
| Age ≥65 years, n (%) | 60 (30.0) | 22 (50.0) | 38 (24.4) | 0.001 |
| Male sex, n (%) | 103 (51.5) | 19 (43.2) | 84 (53.8) | 0.211 |
| BMI (kg/m²), mean ± SD | 24.7 ± 3.8 | 24.3 ± 3.4 | 24.8 ± 3.9 | 0.357 |
| Smoking history, n (%) | 90 (45.0) | 27 (61.4) | 63 (40.4) | 0.013 |
| COPD, n (%) | 39 (19.5) | 10 (22.7) | 29 (18.6) | 0.541 |
| ASA physical status ≥III, n (%) | 52 (26.0) | 10 (22.7) | 42 (26.9) | 0.575 |
| FEV₁ (% predicted), mean ± SD | 75.0 ± 11.7 | 72.6 ± 11.4 | 75.7 ± 11.7 | 0.119 |
| C. Temporal validation cohort | ||||
| Variable | Total (n = 102) | |||
| Age (years), mean ± SD | 60.7 ± 10.0 | |||
| Age ≥65 years, n (%) | 37 (36.3) | |||
| Male sex, n (%) | 63 (61.8) | |||
| BMI (kg/m²), mean ± SD | 24.6 ± 3.7 | |||
| Smoking history, n (%) | 40 (39.2) | |||
| COPD, n (%) | 19 (18.6) | |||
| ASA physical status ≥III, n (%) | 29 (28.4) | |||
| FEV₁ (% predicted), mean ± SD | 74.7 ± 11.2 | |||
Table 1: Baseline demographic and clinical characteristics. Baseline demographic and clinical characteristics are presented for (A) the overall cohort (n = 302), stratified according to the occurrence of postoperative pulmonary complications (PPCs); (B) the development cohort (n = 200); and (C) the temporal validation cohort (n = 102). Continuous variables are presented as mean ± standard deviation (SD) and categorical variables as n (%), as applicable. Between-group comparisons were performed using the statistical tests specified for the respective analyses. PPC, postoperative pulmonary complication; BMI, body mass index; COPD, chronic obstructive pulmonary disease; ASA, American Society of Anesthesiologists; FEV1, forced expiratory volume in 1 s.
Participant flow and missing data
Figure 1 summarizes cohort assembly. A total of 327 patients were screened. Twenty-five patients were excluded: 5 because of conversion to open thoracotomy, 17 because of incomplete clinical or perioperative records required for the prespecified analyses, and 3 because of concurrent major surgical procedures. The final analytic sample comprised 302 patients, with 200 assigned chronologically to the development cohort and 102 to the subsequent same-center temporal validation cohort. Among the 302 included patients, no missing values were present for the 18 variables contained in the final analytic dataset.
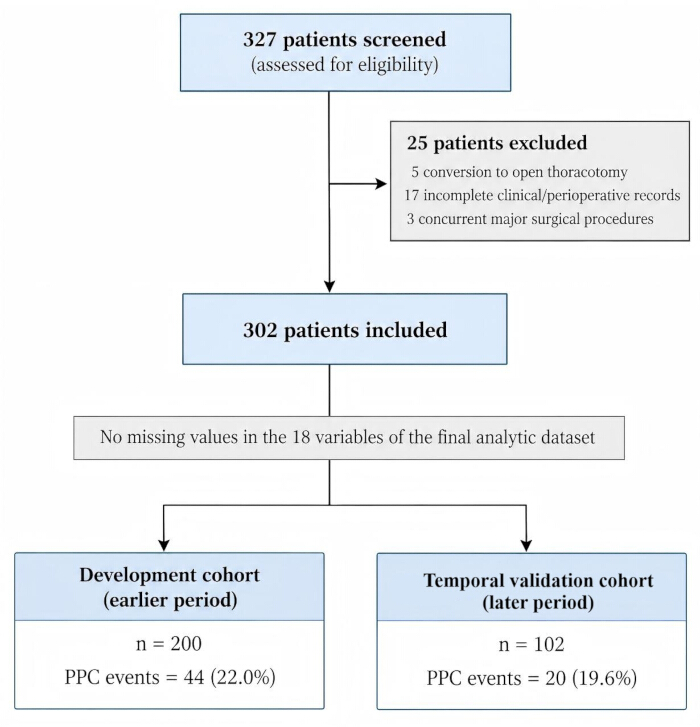
Figure 1. Participant flow diagram. Of 327 patients screened for eligibility, 25 were excluded, including 5 patients with conversion to open thoracotomy, 17 with incomplete clinical/perioperative records, and 3 who underwent concurrent major surgical procedures. A total of 302 patients were included in the final analysis and divided chronologically into the development cohort (n = 200; 44 PPC events, 22.0%) and the later-period same-center validation cohort (n = 102; 20 PPC events, 19.6%). No missing values were present for the 18 variables in the final analytic dataset. PPC, postoperative pulmonary complication. Please click here to view a larger version of this figure.
Baseline characteristics were also analyzed separately for the development cohort (n = 200) and the temporal validation cohort (n = 102). In the development cohort, PPCs occurred in 44 patients (22.0%), whereas 156 patients did not develop PPCs. Patients with PPCs were older (64.9 ± 10.1 vs. 58.8 ± 10.1 years, P = 0.001), were more frequently aged ≥65 years (50.0% vs. 24.4%, P = 0.001), and were more likely to have a smoking history (61.4% vs. 40.4%, P = 0.013). Sex, BMI, COPD, ASA class ≥III, and mean FEV1 % predicted did not differ significantly between groups. Detailed characteristics of the development cohort are summarized in Table 1 B, and those of the temporal validation cohort are summarized in Table 1 C.
Surgical data
Across the study population, mean operative time was 183.4 ± 36.4 min, mean anesthesia time was 222.6 ± 38.1 min, mean blood loss was 143.9 ± 63.5 mL, minimum postoperative SpO₂ was 91.2 ± 3.5%, and hospital stay was 6.6 ± 2.3 days. Operative time was longer in the PPC group than in the non-PPC group (190.8 ± 30.5 vs. 181.4 ± 37.6 min, P = 0.039), whereas the other perioperative variables did not differ significantly (Table 2).
| Parameter | Total (n = 302) | PPC group (n = 64) | Non-PPC group (n = 238) | P value |
| Operative time (min), mean ± SD | 183.4 ± 36.4 | 190.8 ± 30.5 | 181.4 ± 37.6 | 0.039 |
| Anesthesia time (min), mean ± SD | 222.6 ± 38.1 | 229.4 ± 33.8 | 220.8 ± 39.0 | 0.083 |
| Blood loss (mL), mean ± SD | 143.9 ± 63.5 | 146.0 ± 65.0 | 143.3 ± 63.2 | 0.767 |
| Minimum postoperative SpO₂ (%), mean ± SD | 91.2 ± 3.5 | 90.6 ± 3.9 | 91.3 ± 3.4 | 0.19 |
| Hospital stay (days), mean ± SD | 6.6 ± 2.3 | 6.3 ± 2.2 | 6.7 ± 2.4 | 0.268 |
Table 2: Intraoperative and postoperative variables. Intraoperative and postoperative variables are presented for the overall cohort (n = 302) and according to the occurrence of postoperative pulmonary complications (PPCs). Values are presented as mean ± standard deviation (SD), and comparisons between the PPC and non-PPC groups were performed using Welch’s t-test. SpO₂, peripheral oxygen saturation; PPC, postoperative pulmonary complication.
Incidence and distribution of pulmonary complications
Among the 64 patients with PPCs, respiratory infection was the most common recorded PPC type (22/64, 34.4%), followed by atelectasis (18/64, 28.1%), pleural effusion (12/64, 18.8%), respiratory failure (6/64, 9.4%), pneumothorax (3/64, 4.7%), aspiration pneumonitis (2/64, 3.1%), and bronchospasm (1/64, 1.6%); no persistent air leakage lasting more than 5 postoperative days was recorded. The analytic dataset contained one adjudicated PPC-type entry per PPC patient; therefore, patients were not double counted across categories. The counts totaled 64, and the percentages may total 100.1% because of rounding (Table 3).
| Complication | n (%) of PPC group | Total incidence (%) |
| Respiratory infection | 22 (34.4) | 7.3 |
| Atelectasis | 18 (28.1) | 6 |
| Pleural effusion | 12 (18.8) | 4 |
| Respiratory failure | 6 (9.4) | 2 |
| Pneumothorax | 3 (4.7) | 1 |
| Aspiration pneumonitis | 2 (3.1) | 0.7 |
| Bronchospasm | 1 (1.6) | 0.3 |
| Persistent air leakage | 0 (0.0) | 0 |
Table 3: Spectrum of postoperative pulmonary complications. The distribution of postoperative pulmonary complications (PPCs) is shown among the 64 patients classified as having a PPC and relative to the overall cohort of 302 patients. Each PPC case was assigned one primary PPC category in the analytic dataset; therefore, patients were not double counted across categories. Percentages in the PPC group were calculated using 64 PPC cases as the denominator, whereas total incidence percentages were calculated using all 302 patients as the denominator. PPC-category percentages may sum to 100.1% because of rounding. Persistent air leakage was defined as air leakage lasting more than 5 postoperative days.
Risk factor analysis
The three-variable logistic prediction model is summarized in Table 4. When age ≥65 years, smoking history, and FEV1 < 70% predicted were fitted together, age ≥65 years was significantly associated with PPCs (OR 2.72, 95% CI 1.33–5.56, P = 0.006), whereas smoking history (OR 1.87, 95% CI 0.91–3.82, P = 0.087) and FEV1 < 70% predicted (OR 1.54, 95% CI 0.76–3.15, P = 0.232) showed positive but non-significant associations. This three-variable model generated the predicted probabilities used for the model-performance analyses in Table 5 and the ROC analyses.
| Predictor | β coefficient | SE | OR | 95% CI for OR | P value |
| Intercept | −2.1114 | 0.3239 | — | — | <0.001 |
| Age ≥65 years | 1.0009 | 0.3649 | 2.72 | 1.33–5.56 | 0.006 |
| Smoking history | 0.625 | 0.3648 | 1.87 | 0.91–3.82 | 0.087 |
| FEV₁ <70% predicted | 0.435 | 0.3639 | 1.54 | 0.76–3.15 | 0.232 |
Table 4: Logistic regression estimates for the three-variable prediction model in the development cohort. The final prediction model was fitted in the development cohort (n = 200) with age ≥ 65 years, smoking history, and FEV1 < 70% predicted entered simultaneously. Each predictor was coded as 1 when present and 0 when absent. The reported β coefficients, including the intercept, define the final logistic regression prediction equation. OR, odds ratio; CI, confidence interval; SE, standard error; FEV1, forced expiratory volume in 1 s.
| Cohort | AUC (95% CI) | Sensitivity (%) | Specificity (%) | Hosmer–Lemeshow P value | Calibration intercept | Calibration slope |
| Development (n = 200) | 0.69 (0.60–0.78) | 70.5 | 67.3 | 0.49 | 0 | 1 |
| Temporal validation (n = 102) | 0.85 (0.76–0.92) | 90 | 67.1 | 0.059 | 0.97 | 2.09 |
Table 5: Predictive performance of the final three-variable model. Model performance is presented for the development cohort (n = 200) and the subsequent same-center temporal validation cohort (n = 102). Discrimination was assessed using the area under the receiver operating characteristic curve (AUC), with 95% confidence intervals (CIs) obtained by bootstrap resampling. Sensitivity and specificity were calculated using the development-cohort Youden-optimal probability threshold of 0.2478. Calibration was assessed using the Hosmer–Lemeshow goodness-of-fit test and the calibration intercept and slope, which were estimated by logistic recalibration of observed postoperative pulmonary complication (PPC) status on the model linear predictor. AUC, area under the receiver operating characteristic curve; CI, confidence interval; PPC, postoperative pulmonary complication.
Multivariable logistic regression model
The broader development-cohort multivariable risk-factor analysis is presented in Table 6. Variables with univariable P < 0.25 were entered into the multivariable model. Age ≥65 years had an adjusted OR of 2.65 (95% CI 1.29–5.44, P = 0.008), smoking history had an adjusted OR of 1.91 (95% CI 0.93–3.91, P = 0.079), and FEV1 < 70% predicted had an adjusted OR of 1.51 (95% CI 0.74–3.10, P = 0.259).
| Variable | Univariable OR (95% CI) | P value | Entered model | Multivariable OR (95% CI) | P value | Final status |
| Age ≥65 years | 3.11 (1.55–6.22) | 0.001 | Yes | 2.65 (1.29–5.44) | 0.008 | Retained |
| Smoking history | 2.34 (1.18–4.66) | 0.015 | Yes | 1.91 (0.93–3.91) | 0.079 | Not significant after adjustment |
| FEV₁ <70% predicted | 1.66 (0.84–3.29) | 0.148 | Yes | 1.51 (0.74–3.10) | 0.259 | Not significant after adjustment |
| Male sex | 0.65 (0.33–1.28) | 0.213 | Yes | 0.68 (0.34–1.37) | 0.278 | Not significant after adjustment |
| BMI ≥25 kg/m² | 0.85 (0.43–1.65) | 0.623 | No | — | — | Not entered |
| COPD | 1.29 (0.57–2.90) | 0.541 | No | — | — | Not entered |
Table 6: Univariable and multivariable logistic regression analysis for postoperative pulmonary complications in the development cohort. Univariable and broader multivariable risk-factor analyses were performed in the development cohort (n = 200). Variables with a univariable P value < 0.25 were entered into the multivariable logistic regression model. Age ≥ 65 years, smoking history, FEV1 < 70% predicted, and male sex met this criterion and were entered into the broader multivariable model. Age ≥ 65 years remained statistically significant after adjustment, whereas smoking history, FEV1 < 70% predicted, and male sex did not. This broader explanatory risk-factor analysis was distinct from the dedicated three-variable prediction model reported in Table 4. PPC, postoperative pulmonary complication; OR, odds ratio; CI, confidence interval; FEV1, forced expiratory volume in 1 s; BMI, body mass index; COPD, chronic obstructive pulmonary disease.
Age ≥65 years was the only one of these three variables that remained statistically significant after adjustment. Smoking history and FEV1 < 70% predicted were retained as components of the three-variable prediction model evaluated in Table 5 and are therefore described as model predictors rather than statistically significant independent predictors. The adjusted ORs and 95% CIs for these three model predictors are illustrated in Figure 2.
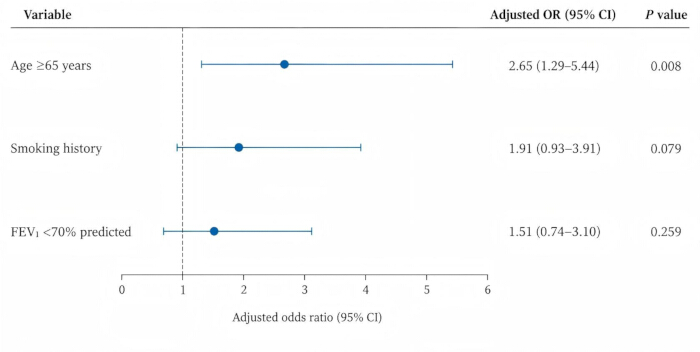
Figure 2. Forest plot of adjusted odds ratios for postoperative pulmonary complications in the development cohort. Adjusted odds ratios (ORs) and 95% confidence intervals (CIs) are shown for age ≥65 years, smoking history, and FEV1 < 70% predicted from the multivariable logistic regression analysis. Points represent adjusted ORs, and horizontal lines represent 95% CIs. The vertical reference line at OR = 1 indicates no association. Age ≥ 65 years was statistically significant after adjustment (OR, 2.65; 95% CI, 1.29–5.44; P = 0.008), whereas smoking history (OR, 1.91; 95% CI, 0.93–3.91; P = 0.079) and FEV1 < 70% predicted (OR, 1.51; 95% CI, 0.74–3.10; P = 0.259) were not statistically significant. FEV1, forced expiratory volume in 1 s; OR, odds ratio; CI, confidence interval. Please click here to view a larger version of this figure.
Nomogram construction and validation
A three-variable nomogram-based prediction model incorporating age ≥65 years, smoking history, and FEV1 < 70% predicted was fitted for individualized estimation of PPC risk following robotic-assisted anatomical segmentectomy. The coefficients from this model are reported in Table 4, and its predictive performance is summarized in Table 5. Smoking history and FEV1 < 70% predicted were not statistically significant in either the three-variable prediction model or the broader multivariable risk-factor analysis in Table 6.
Model discrimination was modest in the development cohort and higher in the temporal validation cohort. The AUC was 0.69 (95% CI 0.60–0.78) in the development cohort and 0.85 (95% CI 0.76–0.92) in the temporal validation cohort. Sensitivity and specificity were 70.5% and 67.3%, respectively, in the development cohort and 90.0% and 67.1%, respectively, in the temporal validation cohort. The corresponding Hosmer–Lemeshow P values were 0.490 and 0.059, and the calibration slopes were 1.00 and 2.09, respectively (Table 5). The corresponding ROC curves are shown in Figure 3 and Figure 4, and the overall-cohort ROC curve is shown in Figure 5. The nomogram for individualized estimation of PPC risk is shown in Figure 6.
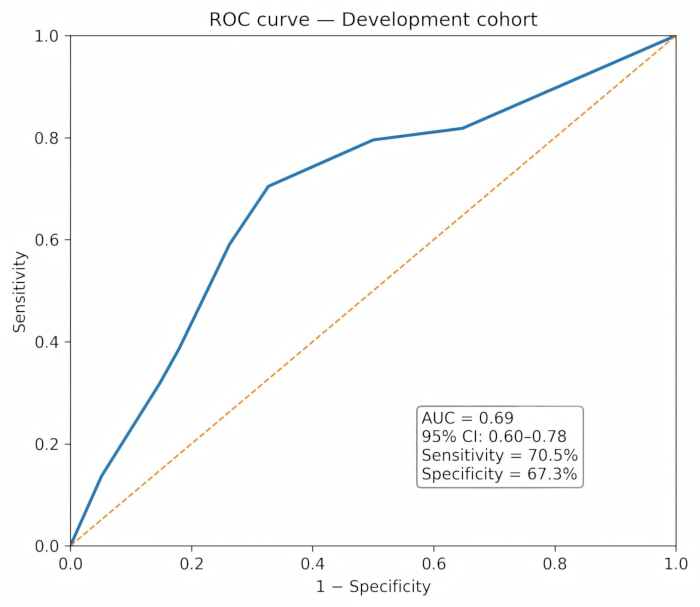
Figure 3. Receiver operating characteristic curve for the development cohort. The receiver operating characteristic (ROC) curve shows the discrimination of the final three-variable prediction model in the development cohort. The area under the curve (AUC) was 0.69 (95% CI, 0.60–0.78), with a sensitivity of 70.5% and specificity of 67.3%. The diagonal reference line represents discrimination expected by chance. AUC, area under the curve; CI, confidence interval; ROC, receiver operating characteristic. Please click here to view a larger version of this figure.
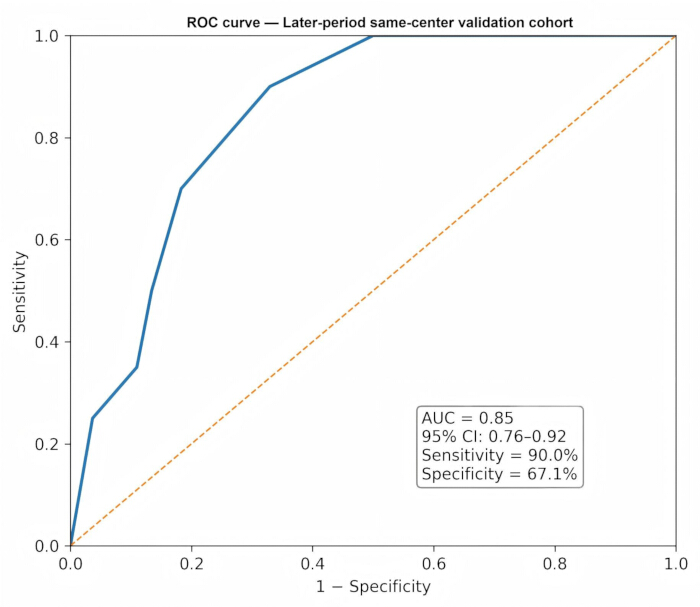
Figure 4. Receiver operating characteristic curve for the later-period same-center validation cohort. The receiver operating characteristic (ROC) curve shows the discrimination of the final three-variable prediction model in the later-period same-center validation cohort. The area under the curve (AUC) was 0.85 (95% CI, 0.76–0.92), with a sensitivity of 90.0% and specificity of 67.1%. The diagonal reference line represents discrimination expected by chance. AUC, area under the curve; CI, confidence interval; ROC, receiver operating characteristic. Please click here to view a larger version of this figure.
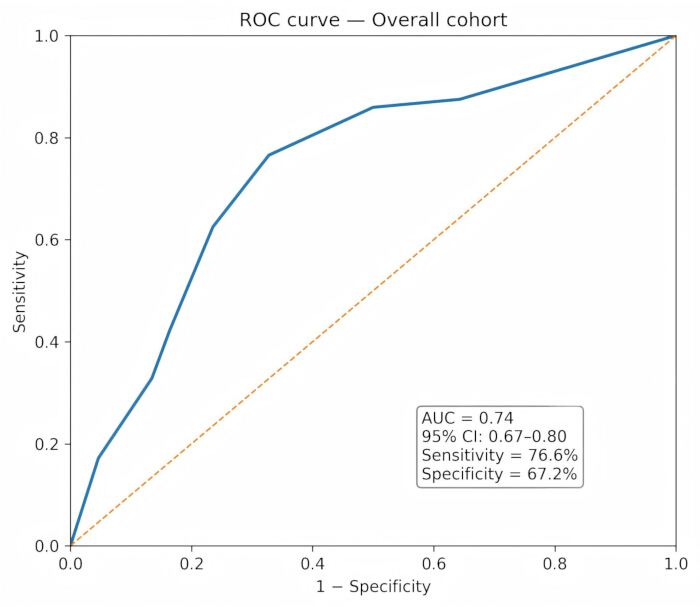
Figure 5. Receiver operating characteristic curve for the overall cohort. The receiver operating characteristic (ROC) curve shows the discrimination of the final three-variable prediction model in the overall cohort (n = 302). The area under the curve (AUC) was 0.74 (95% CI, 0.67–0.80), with a sensitivity of 76.6% and specificity of 67.2%. The diagonal reference line represents discrimination expected by chance. AUC, area under the curve; CI, confidence interval; ROC, receiver operating characteristic. Please click here to view a larger version of this figure.
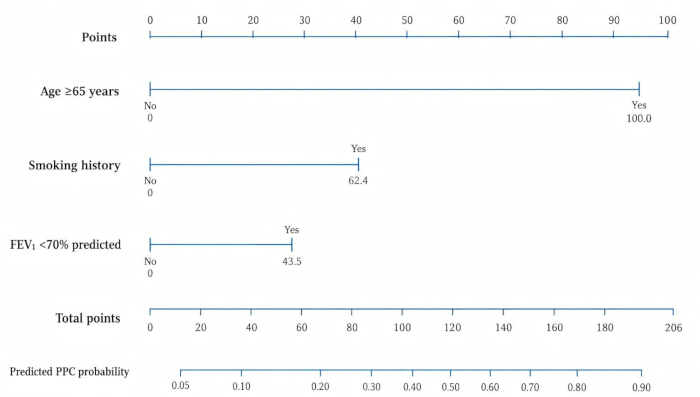
Figure 6. Nomogram for predicting postoperative pulmonary complications. The nomogram was derived from the final three-variable logistic regression model fitted in the development cohort and incorporated age ≥ 65 years, smoking history, and FEV1 < 70% predicted. Points assigned to each predictor are summed to obtain the total points, which correspond to the estimated probability of a postoperative pulmonary complication. FEV1, forced expiratory volume in 1 s; PPC, postoperative pulmonary complication. Please click here to view a larger version of this figure.
Model performance
Model performance in the development cohort:
The predictive performance of the nomogram was first evaluated in the development cohort (n = 200).
Discrimination: The model demonstrated modest discriminative ability in the development cohort, with an AUC of 0.69 (95% CI 0.60–0.78). Using the optimal cutoff determined by the Youden index, the model achieved a sensitivity of 70.5% and a specificity of 67.3%. The development-cohort ROC curve is shown in Figure 3, and the corresponding calibration plot is shown in Figure 7A. The performance estimates are summarized in Table 5.
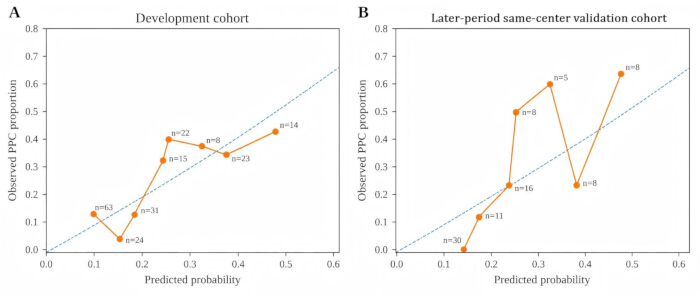
Figure 7. Calibration plots for the final three-variable prediction model. Calibration of the final model is shown for (A) the development cohort and (B) the later-period same-center validation cohort. The x-axis represents model-predicted probability, and the y-axis represents observed postoperative pulmonary complication (PPC) probability. Points represent observed PPC proportions for groups sharing the same model-predicted probability, and the diagonal reference line represents perfect calibration. PPC, postoperative pulmonary complication. Please click here to view a larger version of this figure.
Calibration: Calibration assessment in the development cohort showed a calibration slope of 1.00 and a Hosmer–Lemeshow goodness-of-fit P value of 0.490. The non-significant Hosmer–Lemeshow test provided no evidence of gross lack of fit in the development cohort.
Model performance in the temporal validation cohort:
The final model derived from the earlier 200-patient development cohort was applied, without re-estimation of regression coefficients, to the subsequent same-center temporal validation cohort (n = 102).
Discrimination: The model showed higher discrimination in the temporal validation cohort than in the development cohort, with an AUC of 0.85 (95% CI 0.76–0.92). The ROC curve for the temporal validation cohort is shown in Figure 4. Figure 5 presents the ROC curve for the overall cohort, with an AUC of 0.74 (95% CI 0.67–0.80).
Calibration: Calibration assessment in the temporal validation cohort showed a calibration slope of 2.09 and a Hosmer–Lemeshow goodness-of-fit P value of 0.059. The Hosmer–Lemeshow P value did not indicate statistically significant lack of fit; however, the calibration slope of 2.09 indicated less ideal calibration in the temporal validation cohort than in the development cohort and should be interpreted cautiously. The corresponding calibration plot is shown in Figure 7B.
Persistent air leak
No cases of persistent air leakage lasting more than 5 days were observed in either the development cohort or the temporal validation cohort.
Final prediction model
The final prediction model incorporated age ≥65 years, smoking history, and FEV1 < 70% predicted. The fitted intercept and coefficients were derived from the three-variable prediction model summarized in Table 4, and the resulting predicted probabilities were used for the model-performance analyses reported in Table 5. In the broader development-cohort multivariable risk-factor analysis (Table 6), age ≥ 65 years remained statistically significant after adjustment (adjusted OR 2.65, 95% CI 1.29–5.44, P = 0.008), whereas smoking history and FEV1 < 70% predicted had adjusted ORs greater than 1 but did not reach statistical significance. Male sex also did not remain statistically significant after adjustment, whereas BMI ≥ 25 kg/m2 and COPD were not entered into the multivariable model according to Table 6. Clinical use of the prediction model requires external validation before implementation.
Data Availability:
The de-identified participant-level analytic dataset used in this study is provided as Supplementary File 1. The workbook contains the complete 302-patient analytic dataset used for the development and temporal validation cohorts, including predictor variables, perioperative variables, postoperative pulmonary complication status, PPC type, and a variable dictionary describing the principal binary variables and their coding. No missing values were present among the 18 variables in the final analytic dataset. Data supporting the reported tables and model analyses can therefore be reproduced from the supplied participant-level dataset.
Supplementary File 1. Participant-level analytic dataset and variable dictionary. The workbook contains the de-identified analytic dataset used for the study and an accompanying variable dictionary. The Data worksheet includes 302 patients, comprising 200 patients in the development cohort and 102 patients in the temporal validation cohort, with 18 recorded variables including demographic characteristics, pulmonary function, perioperative variables, postoperative pulmonary complication status, and PPC type. A total of 64 patients were classified as having a PPC. No missing values were present among the 18 variables in the analytic dataset. The Variable_Dictionary worksheet provides definitions and binary coding for age ≥65 years, smoking history, chronic obstructive pulmonary disease, ASA class ≥III, FEV₁ <70% predicted, and PPC status. ASA, American Society of Anesthesiologists; FEV₁, forced expiratory volume in 1 second; PPC, postoperative pulmonary complication. Please click here to download this file.
Discussion
In this retrospective observational cohort study, age ≥ 65 years was the only one of the three preoperative model predictors that remained statistically significant after multivariable adjustment in the development cohort. Smoking history and FEV1 < 70% predicted showed positive but non-significant adjusted associations and were retained as components of the three-variable prediction model. The model showed modest discrimination in the development cohort and higher discrimination in the temporal validation cohort. Previous prediction models for postoperative pulmonary complications have largely been derived from broad or heterogeneous surgical populations rather than homogeneous robotic segmentectomy cohorts5,17,18,19. In contrast, the present model was evaluated within a homogeneous robotic-assisted segmentectomy cohort, thereby reflecting a contemporary minimally invasive surgical population. In this study, 64 of 302 patients (21.2%) developed PPCs, a frequency consistent with the range reported after thoracic surgery1,3. The development-cohort analysis showed that age ≥ 65 years remained independently associated with PPCs, whereas smoking history and FEV1 < 70% predicted did not remain statistically significant after adjustment. Nevertheless, these three readily available preoperative variables were incorporated into the prediction model. The model yielded an AUC of 0.69 (95% CI 0.60–0.78) in the development cohort and 0.85 (95% CI 0.76–0.92) in the temporal validation cohort. The difference in performance between cohorts, together with the validation calibration slope of 2.09, indicates that the model should be interpreted cautiously and requires external validation before clinical implementation. These results identify age ≥ 65 years as the most consistent statistically significant predictor in the development-cohort analyses. Smoking history and reduced FEV₁ should be interpreted as clinically relevant model predictors rather than statistically significant independent predictors in this study. Table 4 reports the dedicated three-variable prediction model used to generate predicted probabilities, whereas Table 6 reports the broader risk-factor model and Figure 2 illustrates the adjusted estimates for the three displayed model predictors; this distinction preserves consistency between model estimation, ROC performance, and risk-factor interpretation. A key strength of this study is that the model was derived from a homogeneous robotic segmentectomy population, avoiding extrapolation from heterogeneous cohorts that include open thoracotomy or video-assisted thoracoscopic surgery. As robotic-assisted procedures become increasingly adopted, procedure-specific risk assessment tools based on contemporary practice are needed12,15,16.
The observed incidence of PPCs in this study is within the range reported after thoracic surgery, although rates vary with procedure type, population, and PPC definition3. While minimally invasive approaches are generally associated with reduced surgical trauma and improved postoperative recovery, this study was not designed to compare surgical platforms, and no conclusions regarding the superiority of robotic surgery can be drawn. Consistent with prior literature, advanced age and impaired pulmonary function are clinically important considerations in preoperative pulmonary risk assessment6,7,8. In the present development cohort, age ≥ 65 years remained independently associated with PPCs after adjustment. Smoking history showed an elevated adjusted OR but did not reach conventional statistical significance in Table 6; nevertheless, its direction of association is biologically plausible and consistent with evidence linking smoking to postoperative pulmonary complications2. Reduced preoperative pulmonary function (FEV1 < 70% predicted) showed a positive but non-significant adjusted association with PPCs in the development-cohort model (adjusted OR 1.51, 95% CI 0.74–3.10, P = 0.259). Accordingly, it should not be described as the strongest independent predictor in this dataset. Its inclusion in the prediction model remains clinically plausible because preoperative pulmonary function is an established component of risk assessment before lung resection7,8. Comparison with established prediction tools is also important. ARISCAT was developed for broad surgical populations and includes age, preoperative oxygen saturation, respiratory infection, anemia, surgical incision, procedure duration, and emergency status5,17. The Gupta respiratory-failure calculator similarly uses broad perioperative predictors and targets postoperative respiratory failure rather than the full PPC spectrum19. In contrast, the present model was intentionally restricted to three readily available preoperative variables in a homogeneous robotic-assisted anatomical segmentectomy cohort. Its potential advantage is procedural specificity and simplicity; however, the present study did not perform a head-to-head net-benefit or reclassification comparison against ARISCAT or Gupta, so incremental value over established tools remains unproven.
COPD and FEV₁ are biologically related measures of chronic pulmonary disease and pulmonary reserve. To reduce potential overadjustment and preserve parsimony, COPD was not included together with FEV₁ in the final three-variable prediction model. FEV1 was retained because it provides a quantitative preoperative measure and is routinely used in lung-resection risk assessment7,8. No formal causal mediation analysis was performed; this should be considered when interpreting the model. Sensitivity analyses supported the robustness of the principal conclusion: replacing dichotomized FEV1 with continuous FEV1 % predicted yielded an AUC of 0.689; replacing FEV₁ with COPD yielded an AUC of 0.678; and including both COPD and FEV1 < 70% predicted yielded an AUC of 0.690. Across these models, age ≥ 65 years remained statistically significant. Operative time and blood loss were evaluated as procedural variables but were not retained in the final prediction model because the intended use is preoperative risk estimation. FVC (% predicted) and pathological tumor stage were not included in the supplied analytic dataset used for the reported model; their possible contribution could not be assessed and is acknowledged as a limitation. Persistent air leak is a recognized component of postoperative morbidity after thoracic surgery21. In the present study, no cases of persistent air leak (>5 days) were observed in either cohort. While this may reflect the limited extent of resection associated with segmentectomy, the relatively small sample size precludes definitive conclusions. Larger, multicenter studies are needed to determine whether robotic segmentectomy is associated with lower rates of prolonged air leak.
The proposed nomogram provides a practical and quantitative approach to individualized PPC risk assessment. By incorporating readily available clinical variables—age, smoking history, and FEV1—the model may support preoperative counseling and shared decision-making, risk stratification for perioperative planning, optimization of respiratory management strategies, and identification of higher-risk patients who may require closer postoperative monitoring. The model showed modest discrimination in the development cohort (AUC 0.69) and higher discrimination in the temporal validation cohort (AUC 0.85). Although the Hosmer–Lemeshow tests did not indicate statistically significant lack of fit, the validation calibration slope of 2.09 warrants caution. These findings support further evaluation of the model rather than immediate clinical adoption. Importantly, the model was derived from a robotic cohort and reflects patient-level risk factors rather than platform-specific physiological effects. Although robotic-assisted surgery offers technical advantages such as enhanced visualization and precision, this study did not include intraoperative ventilatory or gas-exchange parameters. Therefore, the findings should not be interpreted as evidence of platform-specific physiological effects. The results suggest that patient-related factors, particularly age, pulmonary reserve, and smoking-related airway vulnerability, remain clinically relevant to PPC risk2,6,7,8. In addition, mechanisms common to thoracic surgery, such as single-lung ventilation, intraoperative atelectasis, and postoperative reductions in functional residual capacity, remain relevant regardless of surgical approach9. Future studies incorporating intraoperative physiological monitoring may help clarify mechanistic pathways.
Several limitations should be acknowledged. First, this was a retrospective single-center study, which may limit generalizability and introduce selection bias. Excluding conversion-to-open cases may further select a lower-complexity cohort and may underestimate risk in patients who require conversion. Second, the later-period validation cohort came from the same institution; temporal validation is not equivalent to external multicenter validation, and institutional differences in anesthesia and ventilation practice, postoperative respiratory care, and surgical practice may affect transportability. Third, the sample size was modest, with 44 PPC events in the development cohort; although the final three-predictor model yielded approximately 14.7 events per predictor, estimates remain vulnerable to sampling variability. Fourth, patient-level intraoperative ventilation and gas-exchange measurements were not included in the analytic dataset. Fifth, FVC (% predicted), tumor stage, and other potentially relevant pulmonary or oncological variables were not included in the analytic model. Sixth, sensitivity analyses using continuous FEV1 % predicted, COPD in place of FEV1 < 70%, and a model including both COPD and FEV1 < 70% produced materially similar conclusions: age ≥65 years remained significant, whereas smoking and pulmonary-function variables were less stable. The corresponding development-cohort AUCs were 0.689, 0.678, and 0.690. Penalized regression was not performed. Seventh, decision curve analysis was not performed, so clinical net benefit relative to established tools such as ARISCAT or Gupta was not quantified. These limitations reinforce the need for external validation before clinical implementation.
The primary contribution of this study is the development and temporal validation of a predictive model specifically derived from a robotic-assisted anatomical segmentectomy cohort, rather than extrapolating risk estimates from mixed populations that include open or conventional thoracoscopic procedures. As robotic segmentectomy becomes more widely implemented, procedure-specific risk assessment tools may help reflect contemporary surgical practice more accurately. Although the da Vinci system provides enhanced visualization and instrument articulation, the present study does not aim to demonstrate platform-specific physiological advantages. Instead, it focuses on identifying clinically relevant patient-level predictors within a homogeneous robotic cohort and translating these into a practical risk prediction model. The constructed nomogram offers a quantitative and visual method for individualized risk estimation and, by integrating routinely available clinical variables, may support preoperative evaluation and perioperative planning. Future multicenter studies are needed to externally validate the nomogram and assess its integration into clinical workflows, including digital decision-support systems. Incorporation of larger multicenter datasets, additional perioperative variables, and intraoperative physiological variables may further refine predictive accuracy, clarify mechanistic pathways, and expand the applicability of such models. In conclusion, this retrospective single-center study found that age ≥ 65 years was the most consistent statistically significant predictor of PPCs in the development-cohort multivariable analysis. Smoking history and FEV1 < 70% predicted showed positive but non-significant adjusted associations and were retained as clinically relevant variables in the three-variable prediction model. The proposed nomogram may provide a preliminary tool for risk stratification; however, external multicenter validation, calibration assessment, and prospective evaluation are required before clinical implementation.
Disclosures
Conflict of Interest:
The authors declare that they have no financial conflicts of interest. Generative AI tools were used during manuscript revision for language polishing and consistency checking. The authors take full responsibility for the scientific content, numerical results, references, and figure outputs.
Author Contributions:
Shuai Shi and Guangrui Wen developed and planned the study, conducted the study, interpreted the results, and edited and refined the manuscript with a focus on critical intellectual contributions.
Chengqiang Lei and Xiaoqiang Yin participated in data collection, assessment, and interpretation.
Xiangyong Liu, Xuelin Jiang, and Zhi Yang made substantial contributions to data interpretation and manuscript preparation.
Jian Liu, Renqiang Wang, and Qingqiang Yang provided substantial intellectual input during manuscript drafting and revision
Acknowledgements
This work was supported by the Dazu District Science and Health Joint Medical Research Project (No. DZKJ2024JSYJ-KWXM1046).
Materials
| Name | Company | Catalog Number | Comments |
|---|---|---|---|
| Anesthesia workstation with mechanical ventilator | Shenzhen Mindray Bio-Medical Electronics Co., Ltd., Shenzhen, China | WATO EX-65 | Used for general anesthesia and lung-protective two-lung and one-lung ventilation. |
| Arterial blood gas analyzer | Radiometer Medical ApS, Brønshøj, Denmark | ABL90 FLEX PLUS | Used for arterial blood gas measurements when clinically indicated. |
| Computed tomography system | Siemens Healthineers, Forchheim, Germany | SOMATOM Definition AS+ | Used for preoperative contrast-enhanced chest computed tomography and radiologic confirmation of pulmonary nodules. |
| da Vinci Xi Surgical System | Intuitive Surgical, Sunnyvale, CA, USA | IS4000 | Robotic surgical platform used for robotic-assisted anatomical segmentectomy. |
| Fiberoptic bronchoscope | Zhuhai Mindhao Medical Technology Co., Ltd., Zhuhai, China | LF38 | Used to confirm double-lumen endobronchial tube position after intubation and, when necessary, after lateral positioning. |
| High-flow nasal cannula oxygen delivery system | Fisher & Paykel Healthcare Ltd., Auckland, New Zealand | AIRVO 2 | Used for escalation of postoperative respiratory support when clinically indicated. |
| Incentive spirometer | Teleflex Medical Inc., Morrisville, NC, USA | Voldyne 5000 | Used for postoperative pulmonary care when feasible. |
| Left-sided double-lumen endobronchial tube | Henan Tuoren Medical Device Group Co., Ltd., Henan, China | L-Fr35 | Used for lung isolation and one-lung ventilation. |
| Multiparameter patient monitor | Shenzhen Mindray Bio-Medical Electronics Co., Ltd., Shenzhen, China | BeneVision N12 | Used for continuous perioperative monitoring, including peripheral oxygen saturation and other vital signs. |
| Neuromuscular monitoring system | Shenzhen Mindray Bio-Medical Electronics Co., Ltd., Shenzhen, China | NMT module | Used, when available, to assess train-of-four recovery before extubation. |
| Noninvasive ventilation system | Philips Respironics, Murrysville, PA, USA | V60 | Used for postoperative respiratory support in patients with persistent respiratory insufficiency when clinically indicated. |
| Patient-controlled intravenous analgesia pump | Jiangsu Apon Medical Technology Co., Ltd., Jiangsu, China | ZZB-I | Used for postoperative patient-controlled intravenous analgesia, generally for 24–48 h. |
| Propofol | Sichuan Guorui Pharmaceutical Co., Ltd., Sichuan, China | NMPA drug approval number:H20030115 | Used for intravenous induction and maintenance of general anesthesia. |
| Pulmonary function testing system/spirometer | Vyaire Medical GmbH, Höchberg, Germany | MasterScreen PFT | Used for preoperative measurement of forced expiratory volume in 1 second and percentage predicted values. |
| R, version 4.2.0 | R Foundation for Statistical Computing, Vienna, Austria | N/A | Used for statistical analysis, model fitting, internal validation, nomogram construction, and figure generation. |
| Remifentanil Hydrochloride for Injection | Yichang Humanwell Pharmaceutical Co., Ltd., China | NMPA drug approval number: H20030197 | Used for intraoperative opioid analgesia and anesthesia maintenance. |
| rms package for R | CRAN (Comprehensive R Archive Network) | Version 6.7-1 | Used to fit the prediction model and construct the nomogram. |
| Rocuronium Bromide Injection | Zhejiang Xianju Pharmaceutical Co., Ltd., China | NMPA drug approval number:H20203315 | Used for neuromuscular blockade during anesthesia induction and as clinically required. |
| Ropivacaine Hydrochloride Injection | Guangdong Jiabo Pharmaceutical Co., Ltd., China | NMPA drug approval number:H20050325 | Used for local anesthetic infiltration or intercostal nerve block. |
| Sevoflurane | Lunan Better Pharmaceutical Co., Ltd., China | NMPA drug approval number:H20080681 | Used for inhalational maintenance of general anesthesia. |
| SPSS Statistics, version 26.0 | IBM Corp., Armonk, NY, USA | N/A | Used for statistical analyses. |
| Sufentanil Citrate Injection | Yichang Humanwell Pharmaceutical Co., Ltd., China | NMPA drug approval number:H20054171 | Used for opioid analgesia during anesthesia induction. |
References
- Agostini PJ, et al. Risk factors and short-term outcomes of postoperative pulmonary complications after VATS lobectomy. J Cardiothorac Surg. 2018;13(1):28. doi:10.1186/s13019-018-0717-6.
- Lugg ST, et al. Long-term impact of developing a postoperative pulmonary complication after lung surgery. Thorax. 2016;71(2):171-176.
- Agostini P, et al. Postoperative pulmonary complications following thoracic surgery: are there any modifiable risk factors? Thorax. 2010;65(9):815-818. doi:10.1136/thx.2009.123083.
- Batchelor TJP, et al. Guidelines for enhanced recovery after lung surgery: recommendations of the Enhanced Recovery After Surgery (ERAS®) Society and the European Society of Thoracic Surgeons (ESTS). Eur J Cardiothorac Surg. 2019;55(1):91-115. doi:10.1093/ejcts/ezy301.
- Canet J, et al. Prediction of postoperative pulmonary complications in a population-based surgical cohort. Anesthesiology. 2010;113(6):1338-1350. doi:10.1097/ALN.0b013e3181fc6e0a.
- Yang R, et al. Risk factors of postoperative pulmonary complications after minimally invasive anatomic resection for lung cancer. Ther Clin Risk Manag. 2019;15:223-231. doi:10.2147/TCRM.S195010.
- Brunelli A, et al. Physiologic evaluation of the patient with lung cancer being considered for resectional surgery: diagnosis and management of lung cancer, 3rd ed: American College of Chest Physicians evidence-based clinical practice guidelines. Chest. 2013;143(5 Suppl):e166S-e190S. doi:10.1378/chest.12-2395.
- Ferguson MK. Preoperative assessment of pulmonary risk. Chest. 1999;115(5 Suppl):58S-63S. doi:10.1378/chest.115.suppl_2.58S.
- Serpa Neto A, et al. Protective versus conventional ventilation for surgery: a systematic review and individual patient data meta-analysis. Anesthesiology. 2015;123(1):66-78. doi:10.1097/ALN.0000000000000706.
- Brunelli A, et al. Peak oxygen consumption during cardiopulmonary exercise test improves risk stratification in candidates to major lung resection. Chest. 2009;135(5):1260-1267. doi:10.1378/chest.08-2059.
- Yang CFJ, D’Amico TA. Open, thoracoscopic and robotic segmentectomy for lung cancer. Ann Cardiothorac Surg. 2014;3(2):142-152. doi:10.3978/j.issn.2225-319X.2014.02.05.
- Oh DS, et al. Robotic-assisted, video-assisted thoracoscopic and open lobectomy: propensity-matched analysis of recent Premier data. Ann Thorac Surg. 2017;104(5):1733-1740. doi:10.1016/j.athoracsur.2017.06.020.
- Pardolesi A, et al. Robotic anatomic segmentectomy of the lung: technical aspects and initial results. Ann Thorac Surg. 2012;94(3):929-934. doi:10.1016/j.athoracsur.2012.04.086.
- Musgrove KA, et al. Robotic pulmonary segmentectomy. J Thorac Dis. 2021;13(10):6179-6186. doi:10.21037/jtd.2019.12.68.
- Altorki NK, et al. Perioperative mortality and morbidity after sublobar versus lobar resection for early-stage non-small-cell lung cancer: post-hoc analysis of an international, randomised, phase 3 trial (CALGB/Alliance 140503). Lancet Respir Med. 2018;6(12):915-924. doi:10.1016/S2213-2600(18)30411-9.
- Saji H, et al. Segmentectomy versus lobectomy in small-sized peripheral non-small-cell lung cancer (JCOG0802/WJOG4607L): a multicentre, open-label, phase 3, randomised, controlled, non-inferiority trial. Lancet. 2022;399(10335):1607-1617. doi:10.1016/S0140-6736(21)02333-3.
- Mazo V, et al. Prospective external validation of a predictive score for postoperative pulmonary complications. Anesthesiology. 2014;121(2):219-231.
- Arozullah AM, et al. Multifactorial risk index for predicting postoperative respiratory failure. Ann Surg. 2000;232(2):242-253.
- Gupta H, et al. Development and validation of a risk calculator for predicting postoperative respiratory failure. Arch Surg. 2011;146(11):1193-1198.
- Collins GS, et al. Transparent reporting of a multivariable prediction model for individual prognosis or diagnosis (TRIPOD). Ann Intern Med. 2015;162(1):55-63.
- Seely AJE, et al. Systematic classification of morbidity and mortality after thoracic surgery. Ann Thorac Surg. 2010;90(3):936-942. doi:10.1016/j.athoracsur.2010.05.014.