Here, we present a protocol to link visitor route records, ecological disturbance indicators, QR-code backend logs, and on-site questionnaires to identify location-specific environmental communication gaps in agricultural heritage landscapes.
Method Article
A Field Workflow to Assess Environmental Communication in Agricultural Heritage Landscapes
July 17th, 2026
Opens in a new tab
In This Article
Summary
Loading...
$$\rightleftharpoonup{xx}$$
$$\longleftharp{xx}$$,
$$\longrightharp{xx}$$,
Abstract
Loading...
$$\rightleftharpoonup{xx}$$
$$\longleftharp{xx}$$,
$$\longrightharp{xx}$$,
Agricultural heritage landscapes are living socio-ecological systems where tourism intersects with agricultural production and biodiversity conservation. Evaluating environmental communication in these settings requires spatially explicit evidence rather than relying only on post-visit satisfaction surveys. This protocol integrates four data streams: station-passage visitor route records, repeated station-level ecological disturbance observations, anonymized QR-code interpretation backend logs, and on-site visitor questionnaires. The workflow is designed for compact, walkable agricultural heritage sites where stable observation stations can be established, and daily digital-log exports are available. Researchers first zone the site and establish fixed sampling stations, then deploy station-specific QR-code interpretation pages, record visitor station sequences without continuous GPS tracking, monitor ecological disturbance indicators, and link anonymized route and questionnaire records for analysis. In a 30-day representative application, the workflow identified three visitor route typologies, quantified station-level disturbance, screened QR-code data quality, and located relative communication gaps where ecological pressure was high compared with digital engagement. QR-code exposure was positively associated with heritage understanding and perceived ecological sensitivity, whereas satisfaction showed no statistically robust association. This method provides a reproducible field protocol for managers who need to align digital interpretation, route management, and ecological monitoring in living agricultural heritage landscapes.
Introduction
Loading...
$$\rightleftharpoonup{xx}$$
$$\longleftharp{xx}$$,
$$\longrightharp{xx}$$,
Agricultural heritage landscapes function as active socio-ecological systems characterized by the coexistence of agrobiodiversity, traditional knowledge, landscape practices, and local livelihoods1. Because tourism in these settings occurs within working production spaces, such as irrigation networks, village paths, and field margins, its development must remain aligned with the ecological and cultural functions of the site to support dynamic conservation2,3. Evaluating the sustainability of such tourism requires studying the continuous interactions among land use, biodiversity, and visitor behavior4. Consequently, environmental communication in these landscapes should be assessed not only through general visitor satisfaction, but by examining whether interpretive messages successfully reach the specific locations where ecological sensitivity and visitor pressure overlap.
Effective heritage interpretation must be purposeful and site-specific, revealing localized meanings rather than merely transmitting factual information5,6. In agricultural tourism, this implies that visitors need a clear context to understand why a field margin requires protection or why a rice-fish plot holds conservation value7. Digital interpretation tools, particularly QR codes, offer a practical mechanism to deliver location-linked messages without cluttering working landscapes with intrusive physical signage8,9. More importantly, the backend logs generated by QR-code scans provide traceable behavioral data on interpretation exposure, allowing researchers to evaluate engagement objectively.
Conventional assessments of visitor interpretation have typically relied on post-visit questionnaires. While useful for capturing cognitive outcomes like heritage understanding or perceived ecological sensitivity10, single-instrument surveys often introduce common-method bias when simultaneously measuring exposure, perception, and behavioral intention11. Furthermore, traditional methodologies struggle to capture the spatial dimension of visitor impacts. Although continuous GPS tracking can map visitor distribution and off-route movement12, it often raises privacy and feasibility concerns in inhabited heritage villages. Similarly, while recreation ecology emphasizes that visitor impacts are shaped by site resistance, activity type, and spatial concentration rather than mere visitor volume13, these physical indicators are rarely integrated with communication assessment data14.
To bridge these methodological gaps, this article presents an integrated field workflow designed to map and assess environmental communication. The workflow is most suitable for compact, walkable agricultural heritage landscapes in which 8–12 stable observation stations can be maintained, visitor flow is sufficient for systematic exit sampling, and a QR-code backend can export daily station-level logs. The primary goal of this protocol is to establish a verifiable spatial linkage between visitor movement, site-level ecological conditions, digital interpretation usage, and cognitive outcomes. By combining station-passage route records, standardized ecological disturbance observations (e.g., trampling, litter, and bare soil), QR-code backend logs, and targeted on-site surveys, the method enables researchers to evaluate environmental communication as a continuous, localized field process. Ultimately, this workflow provides site managers with a practical diagnostic framework to identify specific communication gaps-landscape nodes where relative ecological disturbance is high but interpretive engagement remains insufficient-thereby guiding more precise monitoring, intervention planning, and post-intervention evaluation in agricultural heritage tourism.
Protocol
Loading...
$$\rightleftharpoonup{xx}$$
$$\longleftharp{xx}$$,
$$\longrightharp{xx}$$,
All procedures involving human participants were reviewed and approved by the Institutional Review Board of Communication University of China (IRB Approval Number: CUC2026A002; approval date: January 5, 2026). The study was conducted in accordance with the Declaration of Helsinki, the Measures for the Ethical Review of Life Sciences and Medical Research Involving Humans, and relevant institutional guidelines. Written or electronic informed consent was obtained from each participant before visitor-route recording and questionnaire administration.
1. Site zoning and sampling station setup
- Execute the field-based assessment workflow to evaluate environmental communication and capture both visitor communication outcomes and site-level environmental conditions15. Refer to Figure 1 for the complete visual representation of the field procedure.
- Select a compact, walkable agricultural heritage site comprising active agricultural production spaces, such as terraced fields, rice-fish plots, irrigation channels, and village lanes.
- Before fieldwork, record the site name, administrative region, approximate route scale, seasonal context, and central World Geodetic System 1984 (WGS84) coordinate in the station log. For the representative application, use a rice-fish terraced heritage landscape with a designated visitor route of approximately 0.5–3.9 km and ten stable observation nodes.
- Establish 10 fixed sampling stations across the landscape and code them as S01 through S10. Define these stations to ensure that the protocol remains general and applicable to other agricultural heritage landscapes.
- Select stations that represent major visitor-use areas and ecologically or culturally important features of the study site.
- Ensure that the selected stations represent major visitor-use areas and ecologically or culturally significant features, such as entrance and exit points, primary landscape viewing areas, agricultural production zones, and sensitive path segments16.
NOTE: In this representative application, ten stations were established to cover the visitor entrance (S01), terraced-field viewing points (S02 and S03), an irrigation-channel node (S04), a rice-fish co-cultivation plot (S05), a traditional farming-tool display area (S06), a village lane (S07), a pond-edge viewing platform (S08), a sensitive field-margin path (S09), and the exit orientation point (S10). - Retain a station for the final protocol only if it meets three specific criteria. Verify that it is accessible to visitors without entering private farmland, possesses a stable boundary for repeated observation, and allows observation without interrupting local farming activity.
- Georeference each station using a GPS-enabled mobile device with approximately ≤ 5 m horizontal accuracy. Record the coordinates in WGS84 format, verify them on two separate pre-field days, and retain a station only when the repeated coordinates and visible boundary markers remain within 5 m of the predefined observation boundary. Refer to Table 1 for the detailed sampling stations and field observation arrangement.
2. QR-code environmental interpretation deployment and tracking
- Install QR-code interpretation points at all 10 sampling stations prior to formal fieldwork. Use a QR-code backend system capable of exporting daily CSV or XLSX files with station ID, timestamp, anonymized or hashed device ID, total scans, unique users, dwell time, scroll depth, repeat scans, and technical-error fields.
- Link each QR code to a dedicated mobile page containing one short text, one site photograph, one environmental or heritage message, one behavioral reminder, and an optional audio explanation.
- Limit the text on each interpretation page to 180–260 Chinese characters and focus on a single theme per station. Design the S04 page to explain irrigation-channel heritage and water conservation, while using the S09 page to explain field-margin protection and visitor-route discipline. Use neutral phrasing for all behavioral reminders.
- Configure the backend access logs to record total scans, unique users, median dwell time, content completion rate, repeat scans, technical errors, and investigator test-device exclusions. Export the log in CSV or XLSX format at the same time each day and retain an unedited raw copy before screening.
- Apply strict validity rules to the QR-code tracking data. Consider a scan valid only when the interpretation page remains open for at least 5 s. Define a completed interpretation exposure as a dwell time of at least 30 s or a scroll depth reaching at least 80% of the page.
- Treat multiple scans from the same hashed device at the same station within a 10-min window as a single unique station-level exposure and exclude investigator test-device scans before analysis.
3. Investigator training and field quality control
- Conduct a two-day training session for all investigators prior to formal fieldwork. Dedicate the first day to covering station boundaries, route coding, ecological indicators, QR-code log definitions, questionnaire administration, and data-entry rules.
- Perform a field rehearsal on the second day using 20 pilot visitors. Exclude these pilot data from the final analytical dataset.
- Check inter-observer consistency during the pilot phase. Ensure that the absolute difference in visually estimating bare-soil proportion between two investigators remains within 10 percentage points. Maintain a difference of no more than one level for the trampling score17 and no more than two persons or two litter items for paired visitor-count and litter-count records.
- Proceed with the formal field protocol only when at least 85% of the paired pilot observations meet the predefined consistency criteria. Initiate immediate discussion and re-training if visitor count and litter count discrepancies exceed two persons or two items, respectively.
- Evaluate the digital questionnaire during the pilot phase. Retain the final version of the survey only after confirming the average completion time falls between 6 min and 10 min.
4. Fieldwork scheduling and visitor route recording
- Conduct the daily fieldwork from 09:00 to 17:30 over a 30-day continuous period. Divide each day into four observation blocks comprising 09:00–10:30, 10:45–12:15, 13:30–15:00, and 15:15–16:45.
- Export the QR-code log data from the backend system at 18:00 each day.
- Record visitor routes continuously during the fieldwork period using a station-passage method to assess spatial behavior without continuous personal GPS tracking18. At entry or recruitment, assign each consenting participant a non-identifying alphanumeric route token. Record this token at each station passage and again at questionnaire completion; do not collect names, telephone numbers, or full personal GPS trajectories.
- Record the anonymous route token, entry station, station sequence, start time, end time, number of stations visited, QR-code stops, route deviation, and exit location for each consenting participant. Store the temporary route-token linkage file separately from the analytical dataset and remove direct identifiers before analysis.
- Validate route record based on four explicit conditions. Verify that the visitor enters S01 or joins the formal route before S03, records at least three distinct stations, spends a total route duration between 20 and 240 min, and completes exit confirmation at S10 or an authorized temporary exit.
- Estimate route length using pre-measured distances between adjacent station segments. Measure each segment independently with a GPS-enabled mapping application and a measuring wheel or laser distance meter where terrain permits. Repeat the measurement when the two estimates differ by more than 5% and use the average verified segment length for route-distance calculation.
- Code route deviation as 0 when the visitor remains on designated paths and 1 when the visitor enters sensitive non-designated spaces such as field margins or pond edges. Calculate sensitive zone overlaps as the percentage of the recorded route located within 10 m of active ecological fields.
5. Ecological disturbance monitoring and index calculation
- Measure ecological disturbance at the station level utilizing repeated short-interval observations to link visitor pressure directly with observable environmental indicators19. Execute these ecological observations specifically during the middle 15 min of each daily observation block.
- Define the formal observation area at each station as a 10 m × 10 m plot. Mark an equivalent 100 m2 observation area to maintain consistency if the station topography does not allow for a square plot.
- Record prevailing weather conditions for each block. Exclude the ecological observation from the disturbance-index calculation if continuous rainfall lasts longer than 30 min. Retain the data and code for light rain lasting less than 30 min as a field-condition variable.
- Count the precise number of visitors entering the observation area during the 15-min window. Count visible visitor-generated waste items, including plastic and paper, to determine the litter count. Estimate the bare-soil proportion visually in 5% increments.
- Score visible trampling on a discrete scale from 0 to 4. Assign 0 for no visible trampling, 1 for slight vegetation flattening, 2 for repeated footmarks, 3 for continuous soil exposure along informal walking lines, and 4 for severe trampling with vegetation loss or visible soil compaction.
- Measure water turbidity exclusively at the water-related stations (S04, S05, and S08) using a portable turbidity meter covering at least 0–25 NTU with 0.1 NTU resolution; verify the meter each field day with 0 NTU and 20 NTU calibration standards or manufacturer-equivalent standards.
- Use an A-weighted sound-level meter meeting Class 2 or equivalent performance, calibrate it at 94 dB and 1 kHz before daily use, place it 1.5 m above the ground and at least 2 m away from the investigator, and measure ambient noise for 60 s. Record the number of visible or audible birds detected within a 50 m radius.
- Calculate a composite ecological disturbance index for each station-observation record20. Standardize each raw indicator to a 0–1 scale using fixed reference bounds rather than site-specific min-max values: visitor count, 0–35 visitors per 15 min; litter count, 0–8 items; bare-soil proportion, 0%–40%; trampling score, 0–4; noise, 45–70 dBA; turbidity, 0–25 NTU; and bird count, 15–0 birds within 50 m after reverse coding. Truncate standardized values below 0 or above 1 to the 0–1 range before weighing.
- Apply a fixed weighting scheme consisting of 20% for visitor count, 20% for trampling score, 15% for bare-soil proportion, 15% for litter count, 10% for noise level, 10% for water turbidity, and 10% for the reverse-coded bird count. For non-water stations, code turbidity as not applicable and redistribute its 10% weight equally to trampling score and bare-soil proportion.
- Report a sensitivity check using a common six-indicator index that excludes turbidity to confirm that the station ranking is not driven by heterogeneous weighting.
- Classify the final index, which ranges mathematically from 0 to 100, into discrete disturbance levels. Define low disturbance as less than 35, moderate disturbance as 35 to 59.9, and high disturbance as 60 or above.
- Treat weekly station means of 60 or higher, station-day mean exceedances of 60, and any single observation above 75 as separate monitoring prompts; do not use the relative communication-gap matrix as a substitute for these absolute management thresholds. Consult Table 2 and Supplementary Table S2 for operational variables, coding rules, fixed standardization bounds, and threshold values.
6. Participant recruitment and on-site questionnaire administration
- Administer a structured on-site questionnaire using tablet devices and a survey platform capable of exporting CSV or XLSX files. Measure visitor background, route experience, QR-code exposure, perceived interpretation quality, heritage understanding, perceived ecological sensitivity, place attachment, pro-environmental behavioral intention, satisfaction, and willingness to pay21. Provide the questionnaire domains and coding rules in Table 2.
- Measure all attitudinal and cognitive items on a five-point Likert scale ranging from strongly disagree to strongly agree. Measure stated willingness to pay utilizing six ordered numerical categories.
- Recruit participants via systematic intercept sampling at the main exit (S10) strictly after visitors complete the main interpretive route. Conduct secondary recruitment at S07 only when the visitor flow at S10 proves insufficient.
- Invite every third eligible adult visitor to participate in the study. Approach the next eligible visitor immediately and restart the sampling interval if the selected visitor refuses.
- Screen all potential participants based on four inclusion criteria. Ensure the participant is at least 18 years old, has completed a minimum of three stations, presents a route duration of at least 20 min, and demonstrates the cognitive ability to complete the questionnaire independently. Explicitly exclude local staff, vendors, tour guides, researchers, and site management personnel from the sample.
- Continue field data collection until reaching the planned valid sample size of 240 questionnaires to effectively balance analytical needs with visitor-flow feasibility22. Restrict collection to a maximum of 12 valid questionnaires per weekday and 16 valid questionnaires per weekend or public holiday day to prevent temporal sampling bias.
Results
Loading...
$$\rightleftharpoonup{xx}$$
$$\longleftharp{xx}$$,
$$\longrightharp{xx}$$,
The successful implementation of this protocol is evidenced by the seamless integration of multi-source data streams. Specifically, the coherence between visitor movement patterns, real-time ecological disturbance observations, and QR-code engagement logs demonstrates that the workflow effectively captures location-specific environmental communication gaps in complex agricultural heritage landscapes.
Visitor route characteristics and spatial distribution
During the 30-day field application, 267 visitors were approached, 252 agreed to participate, and 240 valid questionnaires were retained after data screening, yielding a 94.4% response rate among approached visitors and a 95.2% valid response rate among consenting participants. The station-passage recording method identified three primary spatial trajectories: the heritage core loop (106 visitors), the short loop (74 visitors), and the ecology-extended loop (60 visitors), the distribution of which is visualized in Figure 2. As evidence of the workflow's sensitivity to visitor behavior, participants spent an average of 81.7 min on-site and traversed 4.9 designated stations, confirming that the station-passage recording method provides sufficient spatial resolution to differentiate diverse visitor engagement patterns. The protocol captured physical route deviations in 43 visitors (17.9%), indicating entry into non-designated sensitive areas such as field margins and pond edges. Descriptive statistics detailing the visitor sample and route typologies are summarized in Table 3.
Station-level ecological disturbance and interpretation engagement
The field observation protocol yielded 1,156 valid station-level ecological records from 1,200 potential observation slots at stations. Forty-four ecological observations were excluded because continuous rainfall lasted longer than 30 min, while 96 light-rain observations were retained as a field-condition variable. Pilot quality control met the predefined inter-observer consistency criterion for bare-soil estimation, trampling score, visitor count, and litter count before formal data collection. All 10 station boundaries were rechecked against WGS84 coordinates before the field period and remained within the predefined observation boundaries. The QR-code backend returned all 300 expected station-day log files; 938 repeat scans were filtered within the 10-min station window, 64 technical errors were recorded, and no station-day exceeded the replacement rule of more than three technical errors. The observed spatial variation in the composite ecological disturbance index across the ten stations (Figure 2) validates the efficacy of our repeated, short-interval observation protocol in capturing micro-scale environmental impacts, which are critical for identifying relative communication gaps. Station S09, a sensitive field-margin path, had the highest mean disturbance index (57.6) and approached, but did not cross, the absolute high-disturbance mean threshold of 60. Across all station observations, 49 records reached 60 or higher, five station-day means reached 60 or higher, and no single observation exceeded 75. By mapping backend QR-code engagement to these physical indicators, the workflow classified S09 as a distinct node in the communication-gap matrix, characterized by upper-tertile station disturbance and below-median QR engagement. (Figure 3).
Reliability of questionnaire constructs
Self-reported survey data generated moderate to high construct scores across all perceptual domains (Table 5). Internal consistency tests confirmed the reliability of the measurement instruments, with Cronbach’s alpha values exceeding the acceptable 0.70 threshold for environmental interpretation quality (0.84), heritage understanding (0.80), perceived ecological sensitivity (0.82), and overall satisfaction (0.72). Pro-environmental behavioral intention exhibited a high mean score (4.60) but limited statistical dispersion (Cronbach’s alpha = 0.61), prompting its appropriate recalibration as a secondary outcome in subsequent adjusted analyses.
Associations between interpretation exposure and cognitive outcomes
The integrated dataset confirms that the workflow successfully links backend engagement logs with on-site visitor cognitive outcomes, demonstrating that QR-code interpretation exposure is statistically associated with heritage understanding and perceived ecological sensitivity. Participants who completed at least one valid QR-code scan (n = 168) reported higher mean scores for heritage understanding (3.94 vs. 3.60) and perceived ecological sensitivity (3.91 vs. 3.59) than non-users (n = 72), as illustrated in Figure 4. Adjusted regression models (Table 6 and Supplementary Table S1) showed that the number of QR-code stations scanned was positively associated with heritage understanding (standardized beta = 0.460, 95% CI = 0.349 to 0.571, p < 0.001) and perceived ecological sensitivity (standardized beta = 0.352, 95% CI = 0.234 to 0.470, p < 0.001). The association with pro-environmental behavioral intention was positive but interpreted cautiously because this outcome showed near-ceiling scores and lower internal consistency. Overall satisfaction was not statistically associated with QR-code scanning. Sensitivity analyses using alternative QR-exposure definitions produced consistent positive associations for the cognitive metrics (Figure 5).
All raw data, anonymized QR-code backend logs, route-recording files, ecological observation records, and analyzed datasets generated during this study are publicly available in the Zenodo repository at https://zenodo.org/records/20345777.
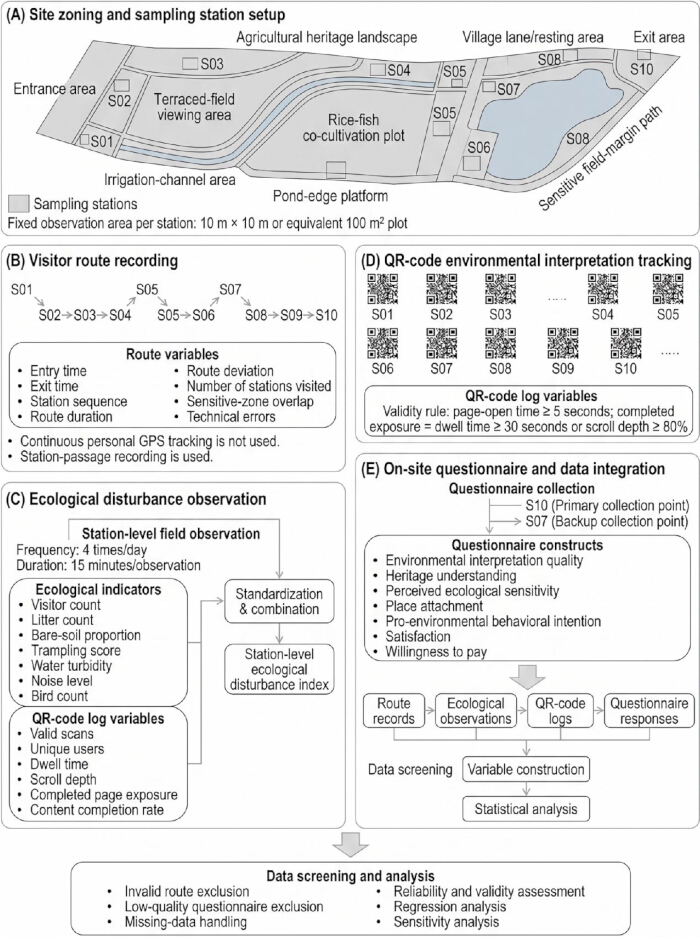
Figure 1: Field workflow for assessing environmental communication in an agricultural heritage landscape. The workflow integrated five field modules: (A) site zoning and fixed sampling-station setup, (B) visitor route recording using a station-passage method, (C) station-level ecological disturbance observation, (D) QR-code environmental interpretation tracking, and (E) on-site questionnaire collection and data integration. Ten sampling stations were established across the entrance area, terraced-field viewing areas, irrigation-channel node, rice-fish co-cultivation plot, heritage interpretation node, village lane, pond-edge platform, sensitive field-margin path, and exit area. Ecological disturbance was observed four times per day at each station using 15-minute observation windows. QR-code engagement was recorded through anonymized backend logs, and visitor questionnaires were collected mainly at the route exit point. The integrated dataset was screened before variable construction, reliability and validity assessment, regression analysis, and sensitivity analysis. No personal GPS trajectories or identifiable visitor information were collected. Please click here to view a larger version of this figure.
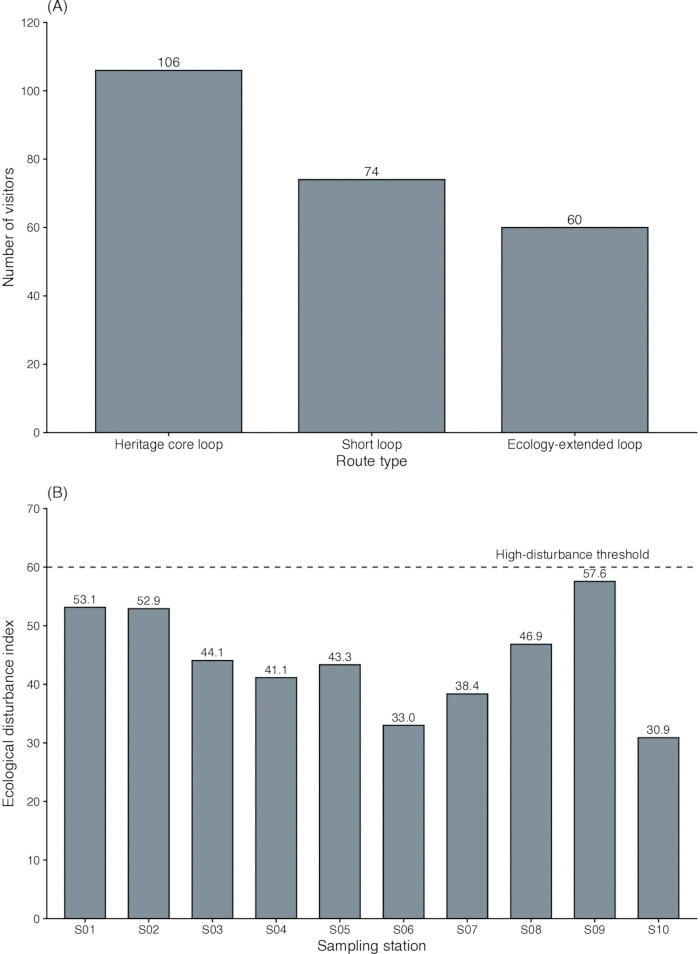
Figure 2: Visitor route pattern and ecological disturbance distribution. (A) Number of visitors using the heritage core loop, short loop, and ecology-extended loop among 240 valid questionnaire participants. (B) Mean ecological disturbance index across S01–S10 calculated from 1,156 valid station-observation records. The dashed horizontal line indicates the pre-specified absolute high-disturbance threshold of 60. Please click here to view a larger version of this figure.
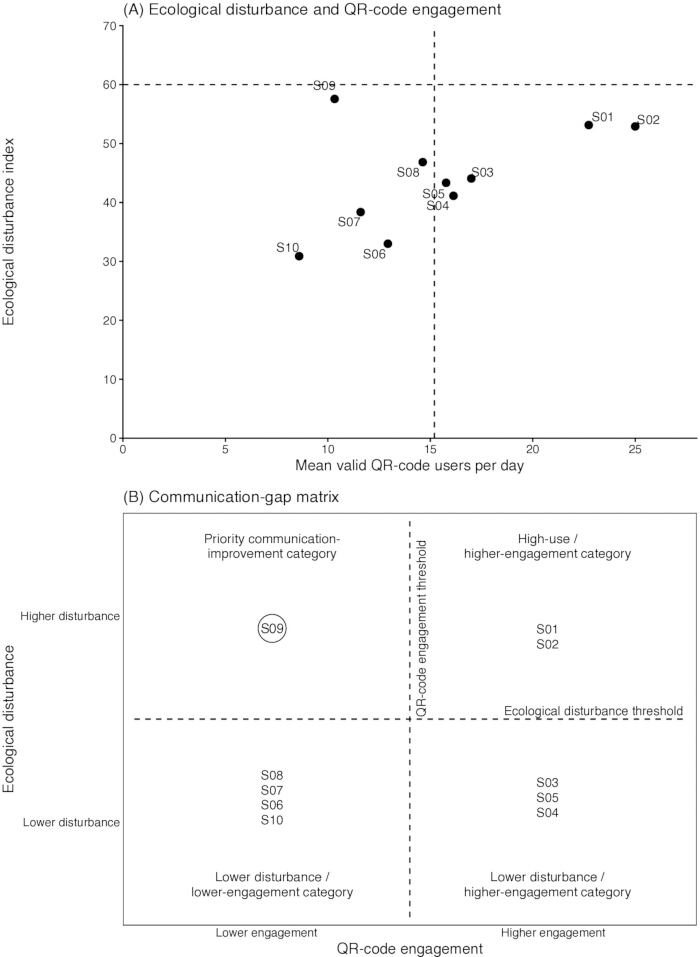
Figure 3: Station-level ecological disturbance, QR-code engagement, and communication-gap screening. (A) Scatter plot of mean ecological disturbance index and mean daily unique QR users across S01–S10. The dashed horizontal line indicates the absolute high-disturbance threshold of 60; dotted lines indicate the relative screening boundaries used for the communication-gap matrix. (B) Communication-gap matrix classifying stations by relative station disturbance and QR-code engagement. The priority communication-improvement screening category is intended for monitoring and intervention planning and does not replace the absolute management threshold. Please click here to view a larger version of this figure.
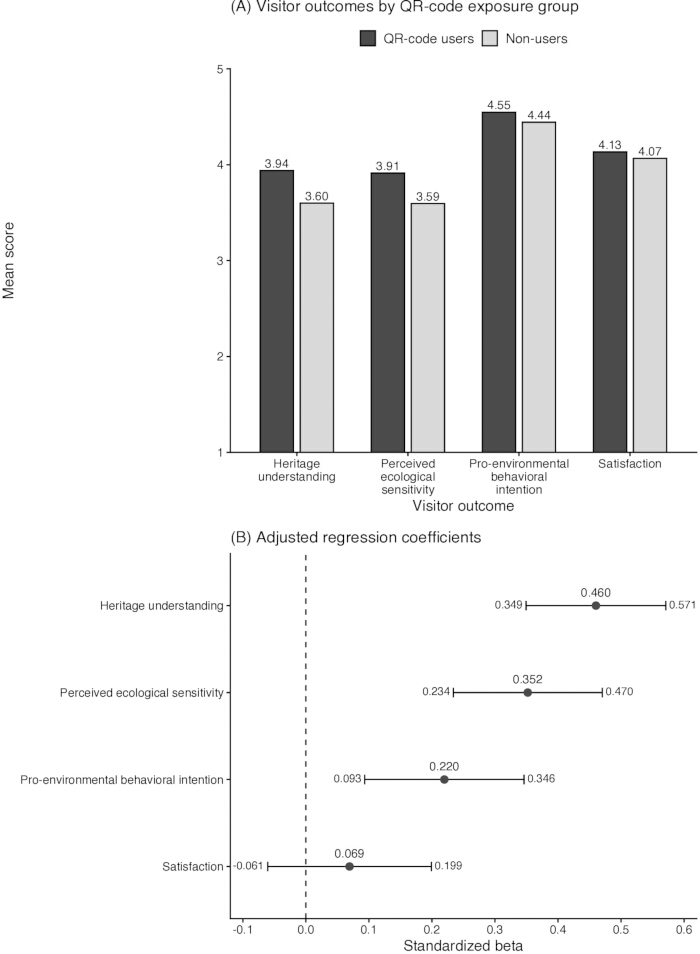
Figure 4: QR-code exposure and visitor outcomes. (A) Mean scores for heritage understanding, perceived ecological sensitivity, pro-environmental behavioral intention, and satisfaction among QR-code users (n = 168) and non-users (n = 72). (B) Standardized regression coefficients for the association between the number of QR-code stations scanned and visitor outcomes after adjustment for demographic and route-related covariates. Error bars indicate 95% confidence intervals. Please click here to view a larger version of this figure.
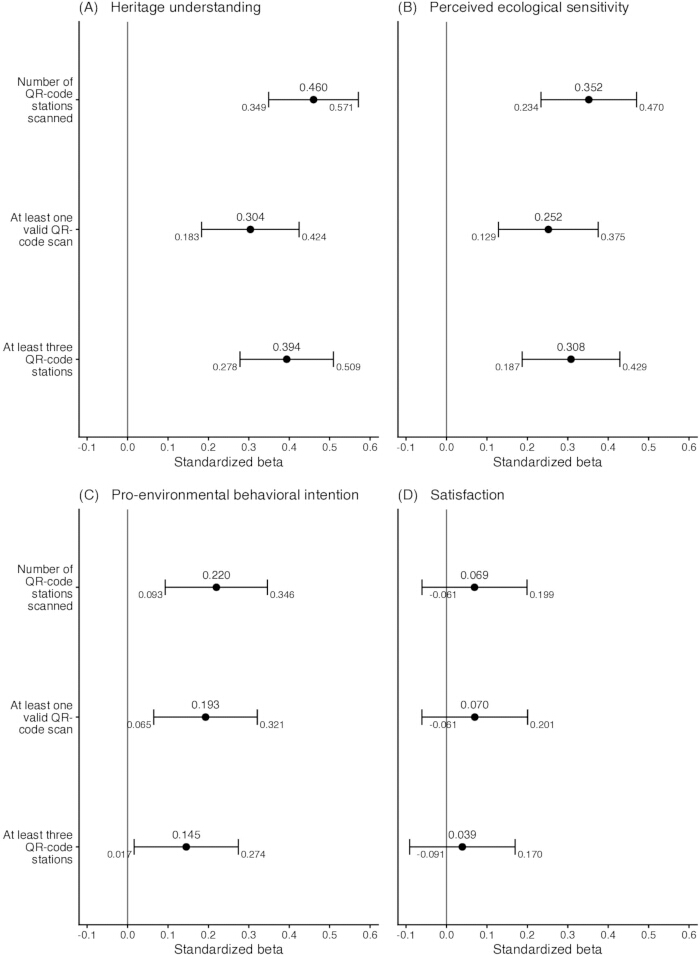
Figure 5: Sensitivity analysis of QR-code exposure definitions. Forest plots show standardized beta values and 95% confidence intervals for three QR-code exposure definitions: number of QR-code stations scanned, at least one valid QR-code scan, and scanning at least three QR-code stations. Separate panels are used for heritage understanding, perceived ecological sensitivity, pro-environmental behavioral intention, and satisfaction. Please click here to view a larger version of this figure.
Table 1: Sampling stations and field observation arrangement. Fieldwork was conducted from 6 April 2026 to 5 May 2026. Each station was observed four times per day. Each ecological observation lasted 15 min and was conducted during the middle part of one of four daily fieldwork blocks: 09:00–10:30, 10:45–12:15, 13:30–15:00, and 15:15–16:45. QR-code logs were exported daily at 18:00. Questionnaire collection was conducted mainly at S10 and secondarily at S07 only when visitor flow at S10 was insufficient. Please click here to download this Table.
Table 2: Variable definitions, coding rules, and pre-specified thresholds. All coding rules, exclusion criteria, and thresholds were specified before statistical analysis. This table belongs to the Methods section and should not include descriptive statistics, group differences, regression coefficients, p-values, or any station-level results. Please click here to download this Table.
Table 3: Visitor characteristics and route-recording results. The response rate was calculated as the number of consenting visitors divided by the number of visitors approached. The valid response rate was calculated as the number of retained questionnaires divided by the number of consenting participants. Route types were identified from station-passage records. QR-code exposure was defined as at least one valid QR-code scan, following the pre-specified minimum page-open time rule. Please click here to download this Table.
Table 4: Station-level ecological disturbance and QR-code engagement. The disturbance index ranged from 0 to 100. Higher values indicate greater ecological disturbance at the station level. Turbidity was measured only at water-related stations. QR engagement was summarized as the mean daily unique users after validity screening and repeat-scan filtering. The pre-specified high-disturbance threshold was 60. Please click here to download this Table.
Table 5: Questionnaire construct scores and reliability assessment. All constructed items were measured on a five-point Likert scale. Cronbach’s alpha ≥0.70 was treated as acceptable. Place attachment was interpreted cautiously due to its borderline reliability. Pro-environmental behavioral intention was treated as a secondary outcome because its Cronbach’s alpha was below the preferred threshold. Please click here to download this Table.
Table 6: QR-code exposure and adjusted associations with visitor outcomes. QR-code users were defined as visitors with at least one valid QR-code scan. Regression coefficients are standardized β values for the number of QR-code stations scanned. Models were adjusted for age group, education level, first-time visit status, route duration, perceived crowding, number of stations visited, and sensitive zone overlap. Pro-environmental behavioral intention was interpreted as a secondary outcome because its internal consistency was below the preferred threshold. Please click here to download this Table.
Supplementary Table S1: Full adjusted regression models for visitor outcomes. Values are standardized regression coefficients with 95% confidence intervals and p-values. All models included the same covariates: number of QR-code stations scanned, route duration, number of stations visited, sensitive-zone overlap, perceived crowding, first-time visit status, age group, and education level. Pro-environmental behavioral intention was treated as a secondary outcome because of near-ceiling scores and lower internal consistency. Please click here to download this file.
Supplementary Table S2: The table reports the fixed standardization bounds and weighting rules used to construct the ecological disturbance index. Please click here to download this file.
Discussion
Loading...
$$\rightleftharpoonup{xx}$$
$$\longleftharp{xx}$$,
$$\longrightharp{xx}$$,
The presented protocol establishes an integrated field workflow for assessing environmental communication in agricultural heritage landscapes. By combining visitor route records, ecological disturbance indicators, QR-code backend logs, and on-site surveys, the method bridges the analytical gap between digital communication exposure, localized environmental conditions, and visitor cognitive outcomes. Representative results show that QR-code interpretation exposure was associated primarily with cognitive and perceptual outcomes, especially heritage understanding and perceived ecological sensitivity, rather than with overall satisfaction.
Executing this protocol requires strict adherence to several critical steps. The initial site zoning and fixed sampling-station setup must accurately reflect the specific socio-ecological dynamics of the living landscape23,24. Stations must be strategically positioned to capture both high-flow visitor areas and ecologically vulnerable nodes, such as narrow field margins or irrigation channels. Furthermore, the rigorous application of backend log validity rules—such as enforcing a minimum 5 s page-open time and a 30 s completion threshold—is essential to filter out accidental scans and ensure that the recorded digital engagement reflects genuine interpretation exposure25,26.
During field applications, researchers must be prepared for dynamic modifications and troubleshooting. Weather events, such as continuous rainfall exceeding 30 min, necessitate the temporary suspension of ecological disturbance observations to prevent data distortion. Similarly, technical failures with QR-code access must be monitored daily; any station exceeding three loading errors per day requires immediate physical replacement of the code and backend linkage verification. When visitor flow at the primary exit station (S10) is insufficient to meet daily sampling targets, recruitment should systematically shift to validated secondary checkpoints (e.g., S07) to maintain sample diversity without compromising route-completion criteria.
Several limitations inherent to this method must be acknowledged. Primarily, the observational field design precludes definitive causal inferences between QR-code engagement and visitor outcomes. Visitors demonstrating higher digital engagement also exhibited longer route durations, suggesting that QR scanning may partially reflect a pre-existing broader interest in the site. Additionally, while the workflow triangulates objective backend logs and physical observations, the perceptual outcomes remain reliant on self-reported questionnaire data. Despite rigorous data screening, common-method bias remains a potential threat when cognitive processing, satisfaction, and behavioral intentions are measured via a single instrument27,28. Future iterations of this protocol could incorporate unobtrusive observation of route compliance or post-visit recall tests to further mitigate this bias.
Despite these limitations, this methodology offers significant advantages over conventional assessment techniques. While recent spatial research has highlighted the utility of continuous smartphone GPS tracking to capture precise visitor mobility29, full trajectory tracking often raises severe privacy and logistical concerns in actively inhabited heritage villages. By using discrete station-passage recording coupled with anonymized digital interpretation logs30, this protocol isolates high-pressure zones without requiring continuous participant surveillance. The communication-gap matrix is intended primarily as a monitoring and intervention-planning tool and can be repeated after new interpretation or route-management actions to evaluate change. The workflow can be applied realistically to other compact agricultural heritage landscapes, Globally Important Agricultural Heritage Systems, protected-area villages, irrigation-heritage corridors, wetland-agriculture tourism routes, and community-managed cultural landscapes where stable observation stations, basic ecological indicators, and daily digital-log exports are available. Furthermore, by evaluating interpretation alongside physical site conditions31, the workflow operationalizes the Limits of Acceptable Change framework32, allowing managers to identify relative communication gaps such as the high-relative-disturbance, lower-engagement profile of station S09. Ultimately, this protocol provides a replicable, field-tested approach for site managers seeking to align digital visitor education, spatial route management, and ecological protection in living heritage systems33,34.
Disclosures
Loading...
$$\rightleftharpoonup{xx}$$
$$\longleftharp{xx}$$,
$$\longrightharp{xx}$$,
The authors have nothing to disclose. The authors used an AI-assisted editing tool during revision to support language polishing, consistency checking, and organization of reviewer-response materials. The authors verified all scientific content, data analyses, figure revisions, and interpretations, and take full responsibility for the final manuscript.
Acknowledgements
Loading...
$$\rightleftharpoonup{xx}$$
$$\longleftharp{xx}$$,
$$\longrightharp{xx}$$,
We thank the staff and local communities of the study site for their assistance during the 30-day field observation period. We also express our gratitude to the anonymous reviewers for their constructive feedback on the workflow design and analytical framework.
Funding: This research is supported by "the Fundamental Research Funds for the Central Universities" (CUC26BS18).
Materials
| Name | Company | Catalog Number | Comments |
|---|---|---|---|
| Data visualization software | Tableau | Desktop 2024 | Optional software for figure preparation; any equivalent visualization software may be used. |
| Digital survey software | Qualtrics | Research Core | Tablet-based questionnaire platform capable of exporting CSV/XLSX files. |
| Handheld GPS receiver | Garmin | GPSMAP 66i | GPS-enabled device with approximately less than or equal to 5 m horizontal accuracy. |
| Portable sound-level meter | Equivalent Class 2 sound-level meter manufacturer | Model/catalog number to be confirmed by authors | A-weighted meter meeting Class 2 or equivalent performance. |
| Portable turbidity meter | Equivalent portable turbidity meter manufacturer | Model/catalog number to be confirmed by authors | Portable meter with calibration standards covering the observed NTU range. |
| QR-code interpretation system | CLIAO | Enterprise Edition | QR-code backend capable of exporting station ID, timestamp, hashed device ID, dwell time, scroll depth, repeat scans, and technical errors. |
| Statistical analysis software | R Foundation | v4.3.0 or later | Statistical computing environment used for analysis. |
| Tablet computer | Any tablet manufacturer | Model/catalog number to be confirmed by authors | Tablet device used for on-site questionnaire administration. |
Reprints and Permissions
Request permission to reuse the text or figures of this JoVE article
Request Permission