This reproducible bibliometric workflow maps perianal fistulizing Crohn’s disease research through 2025 while explicitly evaluating retrieval sensitivity, terminology normalization, counting choices, citation-age effects, and reference-network stability.
Research Article
A Reproducible Bibliometric Analysis of Perianal Fistula in Crohn’s Disease Research (1992–2025): Retrieval Sensitivity and Knowledge Structure
In This Article
Summary
Abstract
Perianal Fistula in Crohn’s Disease (PFCD) spans gastroenterology, colorectal surgery, imaging, and regenerative medicine, making bibliometric findings sensitive to retrieval and normalization choices. A reproducible Web of Science Core Collection (WoSCC) analysis was conducted on PFCD publications from 1992 through 2025. The prespecified Primary title, abstract, and Author Keyword search retrieved 1,694 records; after document-type and topical screening, 769 eligible publication records formed the Primary corpus. Two alternative retrieval strategies were evaluated as sensitivity analyses. Author Keywords were normalized using a documented terminology dictionary, deduplicated within records, and analyzed separately from Keywords Plus. R was used for descriptive bibliometrics, citation-age indicators, retrieval sensitivity analyses, and the full-window reference co-citation workflow; VOSviewer 1.6.21 was used for Author Keyword co-occurrence and country-, institution-, and author-level co-authorship networks. Publication output reached 80 papers in 2025. The United States contributed the most publications (n = 225), while Imperial College London (n = 53) and Ailsa L. Hart (n = 43) led institution- and author-level output, respectively. The most frequent cleaned Author Keywords were “Crohn’s disease” (n = 462), “perianal fistula” (n = 246), and “fistula” (n = 102). At a minimum occurrence threshold of five, the VOSviewer Author Keyword network contained 63 items, 561 links, six clusters, and a total link strength of 2,235. The reference co-citation network contained 913 cited references, 88,364 edges, and 12 Leiden communities (Q = 0.319199; mean standard silhouette = 0.068155), indicating modest modularity with substantial thematic overlap. Sensitivity analyses showed high concordance in annual trends and leading entities, supporting a stable core PFCD knowledge structure while underscoring the importance of transparent retrieval, normalization, counting, and citation procedures.
Introduction
Perianal Fistula in Crohn’s Disease (PFCD) is a clinically challenging phenotype of Crohn’s disease (CD) that often requires coordinated medical, surgical, and radiologic assessment. Its management has evolved from drainage, seton placement, immunosuppression, and anti-tumor necrosis factor (anti-TNF) therapy toward increasingly multimodal care incorporating cross-sectional imaging, treatment optimization, sphincter-preserving procedures, and regenerative approaches1,2,3,4,5,6. This breadth is reflected in a literature spanning multiple specialties, treatment eras, and terminologies.
Bibliometric analysis can quantify publication growth, influential contributors, collaboration structures, citation patterns, and thematic evolution across a scientific field7. However, the apparent structure of a bibliometric landscape depends on methodological choices such as database fields, search synonyms, document eligibility, name disambiguation, full versus fractional counting, keyword normalization, and citation-network construction. bibliometrix and VOSviewer provide complementary tools for science mapping and network analysis8,9, while Bradford’s law provides an established approach for describing the concentration of articles among core journals10. Transparent screening and reporting principles can also be adapted from the Preferred Reporting Items for Systematic Reviews and Meta-Analyses (PRISMA) framework to make corpus construction auditable11.
Two PFCD-related bibliometric studies published in 2025 underscore both the value of science mapping and the sensitivity of results to analytical scope. Jin et al. analyzed 1,608 WoSCC records from 1994 to May 2024, focusing on surgery-based treatment12, whereas Liang et al. analyzed 692 records from 2004 through 2024 and emphasized research hotspots and trends13. Because bibliometric conclusions can shift with search terminology, field selection, observation window, and metadata cleaning, the present study focuses on retrieval robustness and reproducibility. A prespecified Primary strategy excluded the nonspecific isolated abbreviation “CD,” extended the observation window through the last complete calendar year (2025), documented record-level exclusions, separated Author Keywords from Keywords Plus, and incorporated retrieval, counting, citation-age, and network-parameter sensitivity analyses. The objective was to determine the robustness and reproducibility of the PFCD research landscape when retrieval strategies, terminology normalization, counting methods, and citation procedures are made explicit.
Protocol
All data were bibliographic publication records. No human participants, animal subjects, interventions, identifiable clinical information, or individual-level health data were analyzed; therefore, institutional ethics approval and informed consent were not required for this bibliometric study. Software, data sources, versions, providers, access information, and analytical roles used in this study are listed in the Table of Materials.
1. Data source, observation window, and eligibility framework
The Web of Science Core Collection (WoSCC; Editions: All) was used as the bibliographic source. The final search was executed on August 14, 2026, with eligible publications restricted to complete calendar years from 1992 through 2025 based on the Web of Science (WoS) Publication Year (PY) field. Records with PY = 2026 were excluded to avoid an incomplete-year denominator. The unit of analysis was defined as one eligible WoS publication record. Separate publications arising from the same clinical cohort were not collapsed, and only true duplicate bibliographic records were removed. Records whose WoS document-type field contained Article and/or Review were eligible, including multi-tag records such as Article; Proceedings Paper or Article; Early Access. No language restriction was imposed.
2. Literature retrieval strategy
The prespecified Primary strategy searched the title (TI), abstract (AB), and Author Keyword (AK) fields in WoS Advanced Search using the following query: TI=(Crohn* AND (((perianal OR "peri-anal") NEAR/3 fistul*) OR "fistula in ano" OR "fistula-in-ano")) OR AB=(Crohn* AND (((perianal OR "peri-anal") NEAR/3 fistul*) OR "fistula in ano" OR "fistula-in-ano")) OR AK=(Crohn* AND (((perianal OR "peri-anal") NEAR/3 fistul*) OR "fistula in ano" OR "fistula-in-ano")). The isolated abbreviation “CD” was not used as a disease synonym in the Primary strategy because of its nonspecificity. Full records with cited references were exported in WoS plain-text format, and the raw export and the exact query were retained for audit purposes.
Two sensitivity searches were performed using the archived exact search strings provided in Supplementary File 1. Sensitivity A used explicit Crohn disease formulations, whereas Sensitivity B broadened fistula-location terminology. The same eligibility criteria were applied to each sensitivity corpus. For reproducibility assessment, the archived historical 1992–2023 strategy was rerun separately, and its results were retained only for historical reproducibility check, not as an analytical corpus.
3. Record screening and eligibility assessment
Records outside the publication window and records with ineligible document types were mechanically removed before topical screening. The remaining records were screened using title, abstract, Author Keywords, and bibliographic metadata. Full text was consulted only when these fields were insufficient to establish eligibility. Human Crohn’s disease (CD) publications were retained when perianal fistula represented a substantive focus, separately identifiable subgroup, outcome, diagnostic target, intervention, complication, or management problem. For mixed cohorts, PFCD-specific results or discussion were required to be separately identifiable. Veterinary or non-human studies, records not addressing established CD, isolated nonperianal or internal Crohn fistulas, perianal manifestations without a substantive fistula component, and records in which PFCD appeared only as a background statement, baseline variable, list item, or non-separable subgroup were excluded.
Exactly one primary exclusion reason was assigned according to the prespecified hierarchy: duplicate record; outside publication window; ineligible document type; non-human/veterinary; not Crohn’s disease; no eligible perianal fistula phenotype; PFCD incidental/not substantive; or insufficient information. The PRISMA-style flow was generated directly from the record-level screening log. PRISMA reporting principles were used to make identification and eligibility decisions transparent, although the workflow represented bibliometric corpus selection rather than a systematic review of intervention effects11.
4. Terminology and entity normalization
Author Keywords (WoS DE field) and Keywords Plus (WoS ID field) were preserved as separate data elements, with DE denoting the Author Keywords field and ID denoting Keywords Plus. Before tokenization, malformed apostrophes and HyperText Markup Language (HTML) artifacts in DE strings were repaired. The documented terminology dictionary was applied only to high-confidence spelling, punctuation, singular/plural, and synonym variants, while clinically distinct concepts were preserved when equivalence was uncertain. Concepts were deduplicated within each publication before keyword-frequency and co-occurrence counting.
Author names were canonicalized conservatively using exact normalized-name variants, consistent Open Researcher and Contributor ID (ORCID) identifiers, and manually audited high-frequency aliases. ResearcherID was not used as a sole merge key when identifiers conflicted. This procedure was treated as disambiguation rather than perfect author-identity resolution. The WoS C3 (Organization-Enhanced) field was used as the primary institution entity, with a conservative C1 address/affiliation fallback applied only when C3 was unavailable. Parent and child organizations were not automatically collapsed. Country and geographic labels were derived from C1 addresses. England, Scotland, Wales, and Northern Ireland were combined as the United Kingdom for country-level analysis, while Hong Kong and Taiwan were retained as separate WoS geographic labels for analytical consistency. Full terminology and entity-normalization audit tables are provided in Supplementary File 2.
5. Bibliometric indicators and counting methods
R (version 4.5.2) and bibliometrix (version 5.4.1) were used for bibliographic data handling and descriptive analyses8. Annual publication output, source/journal output, author output, institution output, country output, and global WoS Times Cited (TC) were computed. Bradford’s law was applied to describe the concentration of articles among core journals10. Full counting was used as the Primary productivity approach. Fractional output was calculated as a sensitivity analysis for authors, institutions, and countries by allocating 1/n credit to each of n canonical entities on a publication. For country collaboration, a single-country publication (SCP) for country X was defined as a paper involving X and exactly one unique country overall, whereas a multiple-country publication (MCP) was defined as a paper involving X and more than one unique country. The MCP ratio was calculated as MCP/(SCP + MCP).
Global TC, local citations, co-citations, and VOSviewer total link strength (TLS) were treated as distinct metrics. Publication-age bias was contextualized by calculating Citation_Age_Years = max(1, 2026 − PY) and TC/year = global TC/Citation_Age_Years. The available WoS export did not provide a reliable global TC measure excluding self-citations; therefore, self-citation-adjusted TC was not estimated using author-name heuristics.
6. Keyword and collaboration network analysis
The cleaned Author Keyword co-occurrence network was constructed in VOSviewer (version 1.6.21) from the same normalized DE object used for keyword frequencies9. Co-occurrence analysis used Author Keywords as the unit of analysis, full counting, and a minimum occurrence threshold of five. Because the DE field had already been normalized and deduplicated within records, a second VOSviewer thesaurus file was not applied. Association-strength normalization, attraction = 2, repulsion = −1, clustering resolution = 1.00, and minimum cluster size = 1 were used. The final VOSviewer map and network outputs, including node coordinates, cluster assignments, link strengths, total link strength, and average publication year, were saved. For publication-quality Figure 3 rendering, the exported VOSviewer results were imported into R without recalculating the network structure, cluster assignments, node coordinates, or link strengths.
VOSviewer (version 1.6.21) was also used for country-, institution-, and author-level co-authorship networks9. Full counting and the same association-strength mapping framework were applied, with attraction = 2, repulsion = −1, clustering resolution = 1.00, and minimum cluster size = 1. Entities with at least five publications were retained, and average publication year was used for temporal overlays. Cluster assignments and VOSviewer TLS were reported only from saved VOSviewer outputs.
7. Reference co-citation and temporal analyses
Cited references were parsed from the original WoS Cited References (CR) field. References were canonicalized primarily by exact normalized digital object identifier (DOI), with conservative bibliographic keys used for references lacking a DOI. DOI/year and duplicate candidates were audited before construction of the final network. The 1992–2025 observation window was divided into one-year slices. Within each slice, cited references were ranked by annual citation frequency (f_i), and the modified g-index with k = 25 was applied by selecting the largest g for which g2 ≤ k × Σ(i = 1 to g)f_i. References selected across yearly slices were combined by union. A binary citing-document × cited-reference incidence matrix was constructed, raw co-citation counts were derived, and each co-citation edge was normalized by cosine similarity, Cij/sqrt(fi × fj).
Weighted Leiden modularity clustering was performed in igraph using resolution = 1.0 and seed = 20260814. The Leiden algorithm was selected to obtain connected communities in the weighted reference network14. Modularity Q and standard silhouette coefficients were calculated using cosine distance between binary citing-document profiles. These values represent standard R-based silhouette coefficients and are not CiteSpace silhouette values. Community timing was summarized using first and subsequent local citing years. Candidate thematic labels were generated from cleaned Author Keywords and citing-paper titles and were reviewed against highly cited and high-strength references. Small or low-silhouette communities were interpreted cautiously.
Citation bursts were detected using a two-state Kleinberg-style model implemented in R with s = 2, gamma = 1.0, and a minimum duration of 1 year15. Bursts beginning in 1992 were treated as left-censored because 1992 represented the first observation year. Burst detection was repeated with gamma = 0.5 and gamma = 2.0 as sensitivity analyses. CiteSpace 6.4.R2 Basic was evaluated as an alternative analysis environment. The selectable analysis window in the available CiteSpace Basic environment covered 1996–2025 and therefore did not encompass the complete 1992–2025 Primary corpus. Rather than truncating eligible early publications solely to accommodate that environment, the final reference co-citation, community, timeline, and citation-burst analyses were conducted in R over the full observation window.
8. Sensitivity analysis and reproducibility
The Primary corpus was compared with Sensitivity A and Sensitivity B using retrieval overlap, eligible-corpus overlap, annual-count Spearman correlations, Top-k overlap, and rank changes for leading journals, authors, institutions, countries, Author Keywords, and citation indicators (Supplementary Tables 1, 2). Concordance was interpreted alongside observed changes in rank and membership rather than using an arbitrary correlation cutoff. The reference-selection and co-citation workflow was repeated at k = 15 and k = 35 while retaining k = 25 as the Primary setting. Node and edge counts, Q, standard silhouette, and Top-20 local-citation/network-strength overlap were compared.
Record-level screening decisions, permitted derived data, terminology dictionaries, disambiguation tables, software/package versions, parameters, R scripts, quality-control outputs, and figure/table source data were preserved. Raw WoS records remain subject to Clarivate licensing restrictions. The reproducibility package is provided as Supplementary File 3.
Results
Corpus selection and publication growth
The prespecified Primary search retrieved 1,694 records. No duplicate WoS unique accession numbers were detected. Eleven records fell outside the prespecified publication window, and 588 had ineligible document types, leaving 1,095 records for title, abstract, Author Keyword, and metadata screening. At this stage, 325 records were excluded: 11 non-human/veterinary records, 20 records not addressing Crohn’s disease, 15 records without an eligible perianal fistula phenotype, and 279 records in which PFCD was incidental or not a substantive focus. Three records required targeted full-text clarification; two were included, and one was excluded because the diagnosis of established Crohn’s disease was not confirmed. The final Primary corpus comprised 769 publications, with 925 total exclusions (Figure 1; Supplementary File 1).
The 769 publications spanned 222 journals and included 580 Articles, 152 Reviews, 31 Article/Proceedings Paper records, 4 Article/Early Access records, and 2 Review/Early Access records (Table 1). Publication output increased in the later years of the series, reaching 69 publications in 2024 and a peak of 80 in 2025. A total of 371 publications, representing 48.2% of the corpus, appeared during 2020–2025 (Figure 2).
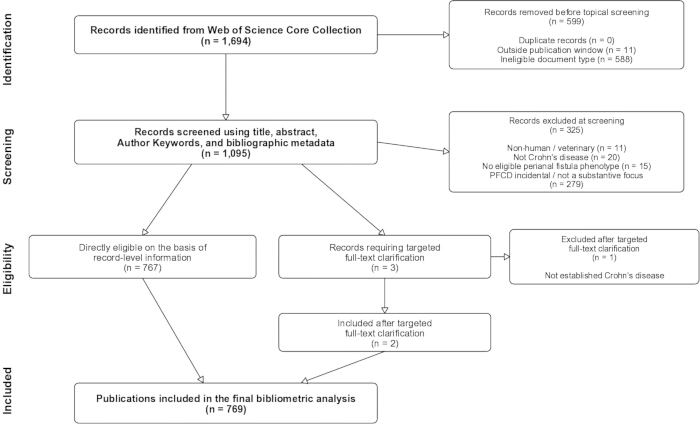
Figure 1: Study identification and screening flow for PFCD. The Web of Science Core Collection (WoSCC) search identified 1,694 records. Before content screening, 599 records were removed, including 11 records outside the prespecified publication window and 588 records with ineligible document types, leaving 1,095 records for title, abstract, Author Keyword, and metadata screening. Of these, 325 were excluded: 11 non-human/veterinary records, 20 records not addressing Crohn’s disease, 15 records without an eligible perianal fistula phenotype, and 279 records in which PFCD was incidental or not a substantive focus. Seven hundred sixty-seven records were directly included, and three borderline records underwent targeted full-text clarification. Two were included, and one was excluded because established Crohn’s disease was not confirmed under the prespecified eligibility criteria, yielding 769 final records. The flow diagram documents targeted clarification rather than universal full-text review. Please click here to view a larger version of this figure.
Table 1: Corpus and analytical framework. Summary of the bibliographic database, search date, publication window, corpus size, eligible document types, source, author, institution, and country entities, citation metrics, counting approaches, keyword handling, entity normalization procedures, and software and network-analysis specifications used in the Primary analysis. Please click here to download this file.
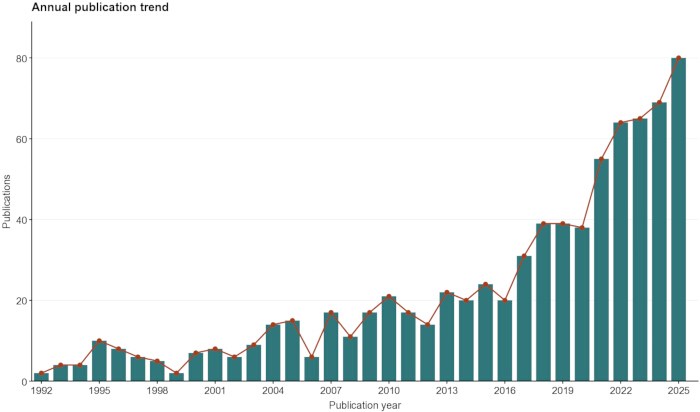
Figure 2: Annual publication output in PFCD research, 1992–2025. Annual publication counts were calculated from the Web of Science publication-year (PY) field for the 769-record Primary corpus. Complete calendar years through 2025 were retained, and 2026 records were excluded to avoid an incomplete-year denominator. Please click here to view a larger version of this figure.
Leading journals, authors, institutions, and countries
Inflammatory Bowel Diseases was the most productive journal (n = 60), followed by Diseases of the Colon & Rectum (n = 45) and Journal of Crohn’s & Colitis (n = 39). The first seven journals in the ranked distribution accounted for 248 publications and constituted Bradford Zone 1 in the prespecified partition (Table 2).
After conservative name normalization, 4,107 canonical authors were represented. Ailsa L. Hart (n = 43), Philip J. Tozer (n = 33), Christianne J. Buskens (n = 31), Willem A. Bemelman (n = 27), and Amy L. Lightner (n = 23) were the five most productive authors. Among 847 canonical institution entities, Imperial College London (n = 53), the University of Amsterdam (n = 49), Mayo Clinic (n = 33), Cleveland Clinic Foundation (n = 31), and Inserm (n = 30) had the highest publication counts. Country-level analysis identified 45 canonical geographic labels. The United States contributed 225 publications, followed by the United Kingdom (n = 108), the Netherlands (n = 87), Italy (n = 82), and Spain (n = 60). Fractional counts and single-country publication/multiple-country publication (SCP/MCP) patterns provided a collaboration-sensitive view of these rankings (Table 2, Supplementary Table 3).
Table 2: Leading sources, authors, institutions, and countries in the Primary corpus. Ranked publication output for leading journals, canonical authors, canonical institutions, and countries. Country-level results include full counts, fractional counts, single-country publications (SCP), multiple-country publications (MCP), and MCP ratios. The first seven ranked journals constitute Bradford Zone 1 in the prespecified Bradford partition. Please click here to download this file.
Citation impact and publication-age context
The corpus accumulated 30,790 global WoS citations at the August 14, 2026 export snapshot, with a mean of 40.039 citations per publication (Table 1). The most cited publication was the 1999 infliximab trial by Present et al. (2,193 global citations)16, followed by the 2004 infliximab maintenance study by Sands et al. (1,752 citations)17 and the 2016 Cx601 phase 3 trial by Panés et al. (866 citations)18 (Table 3). Because older publications had longer exposure to citation accrual, TC/year was reported as a descriptive age-normalized indicator. The Panés 2016 trial had 86.60 citations/year at the export snapshot, illustrating the change in relative citation impact after age normalization.
Table 3: Leading papers by global Web of Science citations with publication-age context. Leading publications ranked by global Web of Science Times Cited (TC), with publication year, source, global TC, and TC/year. Citation age was calculated as max(1, 2026 − publication year). A global Web of Science citation count excluding self-citations was not available in the exported records and was not reconstructed using author-name heuristics. Please click here to download this file.
Keyword landscape and collaboration networks
After final terminology cleaning, 647 of the 769 publications contained Author Keywords. The most frequent cleaned Author Keywords were “Crohn’s disease” (n = 462), “perianal fistula” (n = 246), “fistula” (n = 102), “inflammatory bowel disease” (n = 83), “anal fistula” (n = 70), “perianal Crohn’s disease” (n = 64), “magnetic resonance imaging” (n = 63), and “infliximab” (n = 58) (Table 4). Mesenchymal stem/stromal cells (n = 43), surgery (n = 41), anti-TNF therapy (n = 39), seton (n = 26), PFCD (n = 25), adalimumab (n = 22), and biologic therapy (n = 21) were also prominent. Malformed apostrophe/HTML-derived fragments were removed during terminology normalization before the final analysis.
Table 4: Most frequently cleaned Author Keywords and VOSviewer network characteristics. Frequencies of the most common cleaned Web of Science Author Keywords and summary characteristics of the Author Keyword co-occurrence and country-, institution-, and author-level co-authorship networks. Author Keywords were analyzed separately from Keywords Plus after terminology normalization and within-record deduplication. Please click here to download this file.
The final VOSviewer Author Keyword co-occurrence network retained 63 items at a minimum occurrence threshold of five and contained 561 links across six clusters, with a total link strength of 2,235. The average-publication-year overlay placed infliximab and seton toward earlier portions of the mapped period, whereas mesenchymal stem/stromal cells, the explicit PFCD phrase, and ustekinumab appeared later on average (Figure 3). The country co-authorship network contained 26 items, 158 links, six clusters, and a total link strength (TLS) of 734; the institution network contained 155 items, 2,292 links, 12 clusters, and a TLS of 4,590; and the author network contained 104 items, 612 links, 15 clusters, and a TLS of 1,668 (Supplementary Table 4).
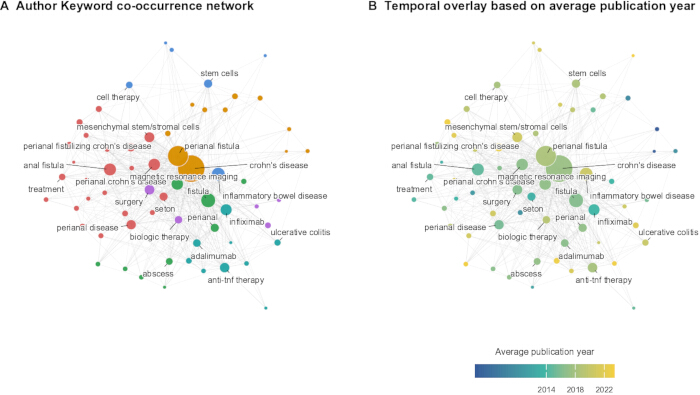
Figure 3: Author Keyword co-occurrence network and temporal overlay in PFCD research. (A) Co-occurrence network of cleaned Web of Science Author Keywords constructed in VOSviewer 1.6.21 using full counting and a minimum occurrence threshold of five. Sixty-three keywords met the threshold, forming 561 co-occurrence links and six VOSviewer clusters, with a total link strength of 2,235. Node size reflects keyword occurrence frequency, edge width reflects link strength, and node color denotes VOSviewer cluster membership. (B) Temporal overlay of the same Author Keyword network, with node color representing average publication year. Author Keywords were analyzed separately from Keywords Plus and were normalized and deduplicated within individual records before network construction. Publication-quality rendering was performed in R using the network structure, coordinates, cluster assignments, link strengths, and overlay scores exported from VOSviewer; the underlying network was not recalculated in R. Please click here to view a larger version of this figure.
Reference co-citation structure, timeline, and citation bursts
After final DOI-based reference canonicalization, annual modified g-index selection at k = 25 yielded 913 cited-reference nodes connected by 88,364 positive co-citation edges in three components; the largest component contained 910 nodes. Weighted Leiden clustering identified 12 communities with modularity Q = 0.319199 and an overall mean standard silhouette of 0.068155 (Figure 4; Table 5). The four largest communities broadly represented contemporary multimodal management/mesenchymal stromal-cell therapy (n = 325; silhouette = 0.023), anti-TNF/biologic and multidisciplinary management (n = 159; silhouette = 0.041), imaging-based diagnosis/activity assessment (n = 106; silhouette = 0.050), and historical medical/seton-pharmacologic management (n = 160; silhouette = 0.033). Other communities captured anorectal malignancy, infliximab efficacy/maintenance, sphincter-preserving surgery, and smaller historical or mechanistic themes. The low silhouette values of the largest communities indicated substantial thematic overlap rather than sharply separated research domains.
The timeline showed a shift from historical surgical and medical-management references toward biologic therapy, multimodal management, imaging, and regenerative interventions (Figure 5A). The strongest citation bursts included Panés 2016 (strength = 23.371; 2018–2024)18, Schwartz 2001 (strength = 19.255; 2003–2015)19, Gecse 2014 (strength = 18.808; 2017–2022)20, Panés 2018 (strength = 18.697; 2019–2024)21, and several 2022 publications with bursts extending into 2025 (Figure 5B). Bursts beginning in 1992 were treated as left-censored rather than as true burst onsets.
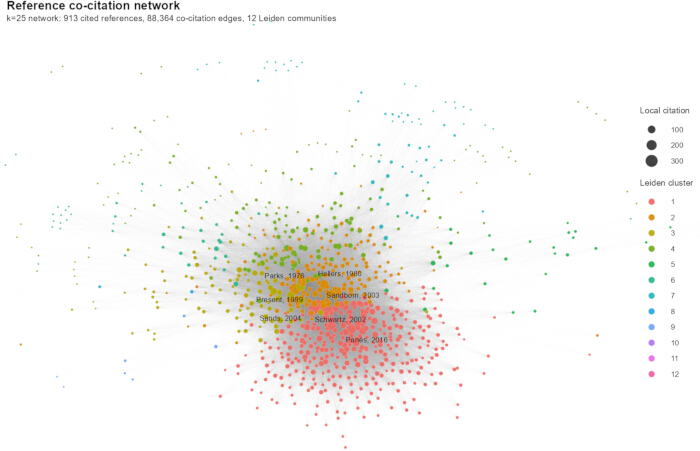
Figure 4: Reference co-citation network of the PFCD knowledge base. Annual modified g-index selection at k = 25 identified 913 canonical cited references. The full network contained 88,364 positive co-citation edges and three connected components. The largest component contained 910 nodes, with a two-node component and a singleton component displayed separately at the network periphery. Edge weights represent cosine-normalized co-citation weights. Weighted Leiden clustering using resolution = 1.0 and seed = 20260814 identified 12 clusters with modularity Q = 0.319199. The overall mean standard silhouette coefficient, based on cosine distance between binary citing-document profiles, was 0.068155. These values are R-based standard silhouette coefficients. Low silhouette values in the largest clusters indicate substantial thematic overlap, and the clusters are treated as exploratory thematic communities rather than sharply separated domains. Please click here to view a larger version of this figure.
Table 5: Reference co-citation clusters at k = 25. Summary of the reference co-citation communities identified after annual modified g-index selection at k = 25 and weighted Leiden clustering. Reported characteristics include cluster size, thematic label, temporal characteristics, and silhouette values derived from cosine distance between binary citing-document profiles. Please click here to download this file.
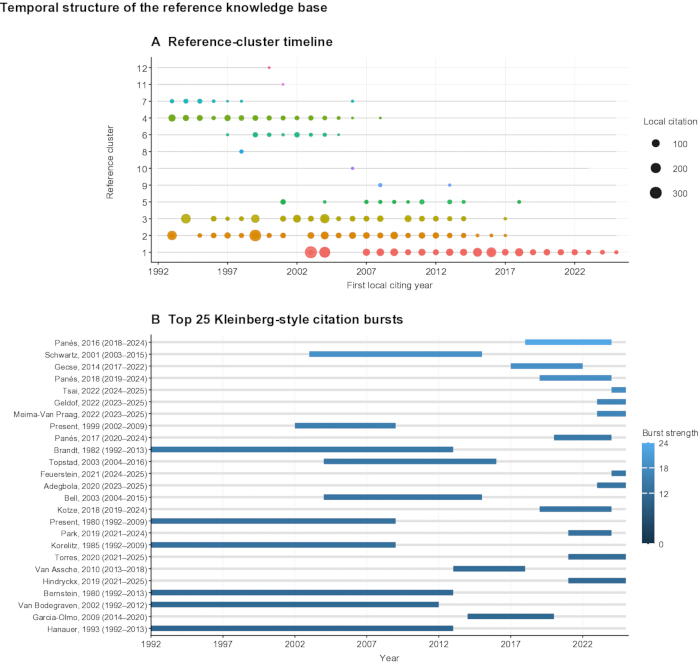
Figure 5: Temporal structure of the PFCD reference knowledge base. (A) Reference-cluster timeline based on the first local citing year within the 769-record Primary corpus. Bubble size reflects local citation frequency, and colors denote final Leiden cluster membership. Clusters are ordered by weighted mean local-citation year, weighted by local citation events, rather than by cluster number. (B) Top 25 citation bursts detected using the prespecified two-state Kleinberg-style R model with s = 2, gamma = 1.0, and a minimum duration of 1 year. Bars show burst intervals, and color intensity reflects burst strength. Bursts beginning in 1992 were considered left-censored because 1992 represents the beginning of the observation window. Burst values represent R-based burst-strength values. Please click here to view a larger version of this figure.
Retrieval and parameter sensitivity
Sensitivity A retrieved 1,530 records and yielded 740 eligible publications, retaining 96.23% of the 769 Primary publications. Sensitivity B retrieved 2,060 records and yielded 905 eligible publications, adding 136 eligible publications to the Primary corpus. The archived 1992–2023 historical strategy was rerun in the current Web of Science Core Collection environment and returned 445 records. These records were used only to evaluate reproducibility of the original search strategy and were not included in the final analytical corpus. Retrieval-set Jaccard similarity was 90.32% for Primary versus Sensitivity A and 82.23% for Primary versus Sensitivity B; the eligible-corpus Jaccard similarity between Primary and Sensitivity B was 84.97%. Annual publication trajectories were highly concordant, with Spearman’s ρ = 0.996 for Primary versus Sensitivity A and ρ = 0.991 for Primary versus Sensitivity B. Leading journals, countries, institutions, authors, Author Keywords, and common-record citation counts remained broadly stable despite larger rank shifts for some entities under the broader strategy (Supplementary Figures 1–3). The country co-authorship temporal overlay is provided in Supplementary Figure 4.
The co-citation sensitivity analyses selected 617 references at k = 15, 913 at k = 25, and 1,198 at k = 35, with modularity Q values of 0.265, 0.319, and 0.352 and mean standard silhouette values of 0.044, 0.068, and 0.069, respectively. All Top-20 locally cited references were retained across the three settings, while Top-20 network-strength overlap with k = 25 was 19/20 for both k = 15 and k = 35. Citation-burst sensitivity preserved most leading bursts, with 24/25 overlap for gamma = 0.5 and 23/25 for gamma = 2.0 relative to gamma = 1.0, supporting the stability of the principal temporal signals (Supplementary Table 5). Definitions and bias handling for the citation metrics are summarized in Supplementary Table 6.
DATA AVAILABILITY:
Derived analysis-ready data permitted for redistribution, the complete record-level screening log, exact search documentation, terminology dictionary, author, institution, and country normalization tables, software parameters, R scripts, quality-control outputs, and figure and table source data are provided in Supplementary Files 1–3.
Supplementary Figure 1: Annual-publication sensitivity across PFCD retrieval strategies. Annual publication patterns for the Primary, Sensitivity A, and Sensitivity B eligible corpora across the observation window. Values are presented as the share of each eligible corpus published in each year.Please click here to download this file.
Supplementary Figure 2: Author Keyword normalized-frequency sensitivity in PFCD research. Normalized frequencies of leading cleaned Author Keywords across the Primary, Sensitivity A, and Sensitivity B eligible corpora. Frequencies are expressed as occurrences per 100 eligible records.Please click here to download this file.
Supplementary Figure 3: Concordance summary across PFCD retrieval strategies. Spearman rank correlations comparing the Primary corpus with Sensitivity A and Sensitivity B across annual raw counts, country output, institution output, journal output, author output, Author Keyword frequencies, and global Times Cited among records common to the compared corpora.Please click here to download this file.
Supplementary Figure 4: Country co-authorship temporal overlay in PFCD research. Temporal overlay of the country co-authorship network. Node color represents the average publication year for each country or geographic entity retained in the network.Please click here to download this file.
Supplementary Table 1: Search-strategy and eligible-corpus robustness. Comparison of the Primary, Sensitivity A, and Sensitivity B retrieval strategies, including retrieved records, eligible records, corpus overlap, and similarity measures used to assess retrieval robustness.Please click here to download this file.
Supplementary Table 2: Rank and trajectory stability across retrieval strategies. Comparison of annual publication trajectories and rankings of leading journals, authors, institutions, countries, Author Keywords, and citation indicators across the Primary and sensitivity corpora.Please click here to download this file.
Supplementary Table 3: Selected full-counting versus fractional-counting country results. Country-level publication output under full and fractional counting, including single-country publications, multiple-country publications, and MCP ratios for selected leading countries.Please click here to download this file.
Supplementary Table 4: VOSviewer network definitions and parameters. Definitions and analytical settings used for Author Keyword co-occurrence and country-, institution-, and author-level co-authorship networks, including counting method, thresholds, normalization, attraction, repulsion, clustering resolution, and minimum cluster size.Please click here to download this file.
Supplementary Table 5: Reference co-citation parameter sensitivity and burst robustness. Comparison of reference co-citation results across modified g-index settings of k = 15, k = 25, and k = 35, together with citation-burst sensitivity results across the prespecified gamma values.Please click here to download this file.
Supplementary Table 6: Citation metric definitions and bias handling. Definitions of the citation indicators used in the analysis, including global Times Cited, TC/year, local citations, co-citations, and network-strength measures, together with procedures used to address publication-age effects and unavailable self-citation-adjusted counts.Please click here to download this file.
Supplementary File 1. Search and Screening Log. Exact search documentation and record-level screening information, including retrieval strategies, eligibility decisions, exclusion reasons, and screening outputs used to construct the Primary and sensitivity corpora.Please click here to download this file.
Supplementary File 2. Terminology and Disambiguation Dictionary. Terminology-normalization and entity-disambiguation documentation for Author Keywords, authors, institutions, and countries or geographic labels used in the analysis.Please click here to download this file.
Supplementary File 3. Reproducibility Package. R scripts, analytical parameters, permitted derived data, quality-control outputs, and figure and table source data used to reproduce the reported bibliometric and network analyses.Please click here to download this file.
Discussion
This analysis maps 769 PFCD publications from 1992 through 2025 and shows a field that expanded most rapidly during the recent period, with publication output peaking at 80 papers in 2025. The research base is internationally distributed but remains concentrated among a relatively small set of journals, institutions, and collaborative groups. The cleaned keyword and citation results place biologic therapy, imaging-based assessment, surgery, and mesenchymal stromal-cell approaches at the center of the literature, consistent with the clinical evolution from single-modality treatment toward multidisciplinary management22,23,24. Publication productivity, global WoS citations, age-normalized citations, VOSviewer total link strength (TLS), local citation frequency, and reference co-citation were treated as distinct metrics rather than used interchangeably.
The findings overlap with, but are not redundant with, the two PFCD-related bibliometric studies published in 2025. Jin et al. examined 1,608 WoSCC records from 1994 to May 2024 under a surgery-based scope and identified surgery, biologic therapy, imaging, and emerging biological treatments as key themes12. Liang et al. analyzed 692 records from 2004 through 2024 and emphasized mesenchymal stem cells, anti-TNF therapy, surgical interventions, diagnostic strategies, and treatment outcomes13. Differences in corpus size among these studies are attributable to variation in search fields, observation windows, terminology, and eligibility criteria. The present analysis extends the observation window through 2025, excludes the nonspecific isolated abbreviation “CD,” documents exclusions at the record level, distinguishes Author Keywords from Keywords Plus, and quantifies how alternative Crohn and fistula terminology affects the retrieved and eligible corpora.
The reference-network findings support cautious thematic interpretation. The final co-citation network exhibited modest modularity (Q = 0.319199) and a low overall standard silhouette (0.068155), particularly in the largest communities. This pattern is consistent with overlapping PFCD domains in which influential articles on anti-TNF therapy, multidisciplinary care, imaging, surgery, and regenerative treatment are repeatedly cited together. Classic infliximab trials remain dominant in global citation counts16,17, while studies on natural history, comparative imaging, multidisciplinary classification, and mesenchymal stromal cells connect clinical and methodological subfields18,19,20,21,22,23,24,25,26,27. Accordingly, the 12 communities are best regarded as exploratory thematic groupings rather than strictly separated specialties.
The robustness analyses address bibliometric stability across alternative methodological choices. Sensitivity A retained 96.23% of the Primary eligible corpus, whereas Sensitivity B added 136 eligible papers; however, annual production trends and most leading entities remained consistent. Separation of Author Keywords from Keywords Plus and application of a documented terminology dictionary removed malformed keyword artifacts that could affect bibliometric interpretation. Full counting was retained for the Primary productivity ranking, while fractional counting demonstrated the effect of collaboration credit on authors, institutions, and countries. Citation-age normalization was included because raw Times Cited values favor older publications, whereas a global self-citation-adjusted Times Cited measure was not reported because it could not be reconstructed reliably from the available export. Reference-network sensitivity analysis further showed that the top locally cited papers remained stable at k = 15, k = 25, and k = 35, despite small variations in modularity Q and silhouette with network size.
Several limitations remain. The analysis is restricted to WoSCC, and records indexed only in other databases may therefore be absent. Bibliometric metadata retain some ambiguity in author names, affiliations, and cited-reference strings despite conservative normalization, and citation counts represent a changing snapshot. The sensitivity search also showed that some PFCD literature uses anal or anorectal terminology rather than perianal terminology; consequently, no search query should be considered fully comprehensive. Co-citation communities overlap rather than forming sharply separated domains, and the smallest communities should not be overinterpreted. Despite these limitations, the workflow provides an auditable view of PFCD research from 1992 through 2025 and a reproducible framework for future updates. Rather than predicting clinical policy, the findings identify areas of enduring knowledge and recent signals that can be considered in future clinical and methodological studies.
Disclosures
No financial or personal conflicts of interest that could inappropriately influence or bias the research, analysis, or publication of this manuscript are declared.
Acknowledgements
This work was supported by the Health Policy Research Project of the Shanghai Municipal Health Commission (Grant No. 2024HP26).
Materials
| Name | Company | Catalog Number | Comments |
|---|---|---|---|
| bibliometrix | CRAN | 5.4.1 | Used for bibliometric data parsing and descriptive analyses. Package source: CRAN / bibliometrix project. |
| CiteSpace | Chaomei Chen / CiteSpace | 6.4.R2 Basic | Evaluated as an alternative analysis environment. In the available environment, the selectable analysis window covered 1996–2025 and did not encompass the complete 1992–2025 observation period. Final full-window reference co-citation, community, timeline, and burst analyses were therefore implemented in R. |
| cluster | CRAN | 2.1.8.1 | Used for standard silhouette coefficients. |
| dplyr | CRAN | 1.2.1 | Used for tabular data transformation. |
| ggplot2 | CRAN | 4.0.3 | Used for R-generated figures. |
| igraph | CRAN | 2.3.3 | Used for graph construction, component analysis, Leiden clustering, modularity, and network summaries. Used for weighted network analysis and modularity. |
| Matrix | CRAN / R recommended package | 1.7-4 | Used for sparse matrix handling in network and co-citation workflows. |
| openxlsx | CRAN | 4.2.8 | Used for spreadsheet output and quality-control workbooks. |
| purrr | CRAN | 1.2.2 | Used for functional iteration in R reproducibility scripts. |
| R | R Foundation for Statistical Computing | 4.5.2 | Used for descriptive and statistical processing, retrieval sensitivity analyses, reference co-citation, community, timeline, and burst analyses, and publication-quality rendering of exported VOSviewer keyword-network results. Reference co-citation clustering, modularity, standard silhouette coefficients, timeline, and citation-burst analyses were implemented in R with explicit parameters and scripts. |
| readxl | CRAN | 1.5.0 | Used for spreadsheet input. Used for input data handling. |
| Spreadsheet software | Microsoft | Microsoft Excel for Microsoft 365 | Used to inspect and verify submission workbooks. Software: Microsoft Excel. |
| stringr | CRAN | 1.6.0 | Used for terminology normalization. |
| tidyr | CRAN | 1.3.2 | Used for data reshaping. |
| VOSviewer | Centre for Science and Technology Studies, Leiden University | 1.6.21 | Used for Author Keyword co-occurrence analysis and country-, institution-, and author-level co-authorship network analysis. |
| Web of Science Core Collection | Clarivate | Search/export date: 14 August 2026 | Bibliographic source for the prespecified 1992–2025 corpus. Accessed through institutional access. |
| writexl | CRAN | 2.0.0 | Used where workbook export is invoked in the reproducibility workflow. |
References
- Park SH, et al. Update on the natural course of fistulizing perianal Crohn’s disease in a population-based cohort. Inflamm Bowel Dis. 2019;25(6):1054–1060. doi:10.1093/ibd/izy329.
- Panés J, Rimola J. Perianal fistulizing Crohn’s disease: pathogenesis, diagnosis and therapy. Nat Rev Gastroenterol Hepatol. 2017;14(11):652–664. doi:10.1038/nrgastro.2017.104.
- Schwartz DA, et al. Guidelines for the multidisciplinary management of Crohn’s perianal fistulas: summary statement. Inflamm Bowel Dis. 2015;21(4):723–730. doi:10.1097/MIB.0000000000000315.
- Singh S, et al. AGA technical review on the medical management of moderate to severe luminal and perianal fistulizing Crohn’s disease. Gastroenterology. 2021;160(7):2512–2556.e19. doi:10.1053/j.gastro.2021.04.023.
- Torres J, et al. ECCO guidelines on therapeutics in Crohn’s disease: medical treatment. J Crohns Colitis. 2020;14(1):4–22. doi:10.1093/ecco-jcc/jjz180.
- Steinhart AH, et al. Clinical practice guideline for the medical management of perianal fistulizing Crohn’s disease: the Toronto Consensus. Inflamm Bowel Dis. 2019;25(1):1–13. doi:10.1093/ibd/izy247.
- Thompson DF, Walker CK. A descriptive and historical review of bibliometrics with applications to medical sciences. Pharmacotherapy. 2015;35(6):551–559. doi:10.1002/phar.1586.
- Aria M, Cuccurullo C. bibliometrix: an R-tool for comprehensive science mapping analysis. J Informetr. 2017;11(4):959–975. doi:10.1016/j.joi.2017.08.007.
- van Eck NJ, Waltman L. Software survey: VOSviewer, a computer program for bibliometric mapping. Scientometrics. 2010;84(2):523–538. doi:10.1007/s11192-009-0146-3.
- Bradford SC. Sources of information on specific subjects. Engineering. 1934;137:85–86.
- Page MJ, et al. The PRISMA 2020 statement: an updated guideline for reporting systematic reviews. BMJ. 2021;372:n71. doi:10.1136/bmj.n71.
- Jin X, et al. Global trends in surgically based treatment of anal fistula in Crohn’s disease: a bibliometric and visualization analysis. Int J Surg. 2025;111:2578–2589. doi:10.1097/JS9.0000000000002238.
- Liang L, et al. Hotspots and trends of perianal fistula of Crohn’s disease: a bibliometric analysis. Medicine (Baltimore). 2025;104:e43854. doi:10.1097/MD.0000000000043854.
- Traag VA, Waltman L, van Eck NJ. From Louvain to Leiden: guaranteeing well-connected communities. Sci Rep. 2019;9:5233. doi:10.1038/s41598-019-41695-z.
- Kleinberg J. Bursty and hierarchical structure in streams [conference paper]. Presented at: Eighth ACM SIGKDD International Conference on Knowledge Discovery and Data Mining; Edmonton, Alberta, Canada; 2002:91–101. https://doi.org/10.1145/775047.775061.
- Present DH, et al. Infliximab for the treatment of fistulas in patients with Crohn’s disease. N Engl J Med. 1999;340(18):1398–1405. doi:10.1056/NEJM199905063401804.
- Sands BE, et al. Infliximab maintenance therapy for fistulizing Crohn’s disease. N Engl J Med. 2004;350(9):876–885. doi:10.1056/NEJMoa030815.
- Panés J, et al. Expanded allogeneic adipose-derived mesenchymal stem cells (Cx601) for complex perianal fistulas in Crohn’s disease: a phase 3 randomised, double-blind controlled trial. Lancet. 2016;388(10051):1281–1290. doi:10.1016/S0140-6736(16)31203-X.
- Schwartz DA, et al. A comparison of endoscopic ultrasound, magnetic resonance imaging, and exam under anesthesia for evaluation of Crohn’s perianal fistulas. Gastroenterology. 2001;121(5):1064–1072. doi:10.1053/gast.2001.28676.
- Gecse KB, et al. A global consensus on the classification, diagnosis and multidisciplinary treatment of perianal fistulising Crohn’s disease. Gut. 2014;63(9):1381–1392. doi:10.1136/gutjnl-2013-306709.
- Panés J, et al. Long-term efficacy and safety of stem cell therapy (Cx601) for complex perianal fistulas in patients with Crohn’s disease. Gastroenterology. 2018;154(5):1334–1342.e4. doi:10.1053/j.gastro.2017.12.020.
- Schwartz DA, et al. The natural history of fistulizing Crohn’s disease in Olmsted County, Minnesota. Gastroenterology. 2002;122(4):875–880. doi:10.1053/gast.2002.32362.
- Van Assche G, et al. Magnetic resonance imaging of the effects of infliximab on perianal fistulizing Crohn’s disease. Am J Gastroenterol. 2003;98(2):332–339. doi:10.1016/S0002-9270(02)05909-9.
- de la Portilla F, et al. Expanded allogeneic adipose-derived stem cells for the treatment of complex perianal fistula in Crohn’s disease: results from a multicenter phase I/IIa clinical trial. Int J Colorectal Dis. 2013;28(3):313–323. doi:10.1007/s00384-012-1581-9.
- Barnhoorn MC, et al. Long-term evaluation of allogeneic bone marrow-derived mesenchymal stromal cell therapy for Crohn’s disease perianal fistulas. J Crohns Colitis. 2020;14(1):64–70. doi:10.1093/ecco-jcc/jjz116.
- Tozer PJ, et al. Review article: medical, surgical and radiological management of perianal Crohn’s fistulas. Aliment Pharmacol Ther. 2011;33(1):5–22. doi:10.1111/j.1365-2036.2010.04486.x.
- Maaser C, et al. ECCO-ESGAR guideline for diagnostic assessment in IBD Part 1: initial diagnosis, monitoring of known IBD, detection of complications. J Crohns Colitis. 2019;13(2):144–164. doi:10.1093/ecco-jcc/jjy113.