A standardized workflow for preparing formalin-fixed, paraffin-embedded bone samples for spatial transcriptomics includes a 10-day EDTA decalcification step to preserve RNA integrity. Key quality-control checkpoints help determine whether samples meet the requirements for downstream spatial gene expression analysis.
Method Article
Preparation of Formalin-Fixed, Paraffin-Embedded Bone Marrow Samples for Spatial Transcriptomics Using EDTA-Based Decalcification
In This Article
Summary
Abstract
Bone marrow (BM) is a complex and dynamic structure in which spatial relationships influence cell behavior, signaling, and function. Because of this, understanding the full dynamics of cellular interactions requires complementary spatial techniques that preserve and map the architecture of cell populations in situ. Despite significant advances in single-cell technologies that have contributed to understanding the transcriptional heterogeneity of healthy and diseased BM tissue, the spatial organization of different cell types, niche-specific regulatory programs, and their interactions still need further study. Recent developments in spatial transcriptomics have enabled unbiased gene expression analysis with spatial context across different tissues, making these technologies complementary to single-cell methods that lack spatial resolution. While spatial transcriptomics has been widely used in soft tissues, its use in mineralized tissues such as BM remains limited because of the challenges associated with processing bone tissue. The protocol presented here has been used to prepare formalin-fixed, paraffin-embedded (FFPE) samples from healthy and diseased mouse and human tissues. A 10-day ethylenediaminetetraacetic acid (EDTA) based decalcification step is included to preserve RNA integrity and support the use of spatial transcriptomics on long bone samples. This protocol describes the preparation of BM samples for spatial transcriptomic analysis, including tissue processing, preservation, and sectioning, as well as essential quality assessment steps, such as evaluating section integrity, tissue morphology, and RNA quality. The workflow also supports cell type identification and integration with single-cell transcriptomic data to characterize cellular composition, define cell–cell interactions, and visualize the spatial distribution of transcriptionally heterogeneous cells in healthy and diseased states. Overall, this workflow prepares fully mineralized healthy and malignant tissues for spatial transcriptomic analysis while preserving BM architecture.
Introduction
The bone marrow (BM) is a highly complex and compartmentalized organ that serves as the primary site for hematopoiesis and immune cell maturation1,2. This heterogeneous tissue comprises a diverse array of hematopoietic, mesenchymal, endothelial, and immune cell lineages that coexist in a highly specialized and organized three-dimensional niche3,4. Within this niche, each cell population occupies distinct anatomical territories, and spatial context plays a fundamental role in regulating cellular behavior, signaling, and function4,5. Physical proximity to specific structures, such as trabecular bone or vascular networks, governs essential physiological processes, including the maintenance of hematopoietic stem cell (HSC) quiescence and bone remodeling6,7. Consequently, this dynamic microenvironment and the tightly regulated interactions among its cellular and stromal components shape the regulatory networks that maintain homeostasis and influence the progression of hematological malignancies8,9,10,11,12,13.
Advances in single-cell RNA sequencing (scRNA-seq) have revolutionized our understanding of BM cellular diversity, enabling the discovery of previously unrecognized cell subtypes and their predicted interactions within the niche3,10,11,12,14,15,16. However, single-cell transcriptomics, while offering high-resolution information on the individual components of the hematopoietic niche, is inherently limited by the tissue digestion process, which dissociates cells from their native environment and potentially alters their native state17, and by the lack of spatial context that defines bone tissue organization4,18. This loss of positional context makes it impossible to definitively map where specific transcriptionally distinct populations reside or how they interact with neighboring cells19. Furthermore, dense bone tissue is often only partially dissociated, resulting in the underrepresentation of key cell populations, such as osteocytes and adipocytes, in scRNA-seq datasets and a biased representation of tissue heterogeneity20,21. Spatial transcriptomics allows the study of gene expression in situ, within spatially preserved tissue sections, thereby recovering contextual information and addressing the limitations of single-cell technologies8,19,22,23,24,25,26. This technology represents an essential advancement in the field, as it enables precise spatial positioning and structural organization of the different cell populations that compose the BM, which is indispensable for understanding their interactions and functional roles within their native microenvironment8,26. Moreover, in the context of disease, spatial transcriptomics enables researchers and clinicians to bridge the gap between traditional pathology and high-throughput genomics, allowing them to overlay molecular data onto morphological images1,8. Spatial transcriptomics technologies can be classified into two major groups: sequencing-based methods and imaging-based methods17,24. Sequencing-based platforms, such as Visium, Curio Seeker, GeoMx Digital Spatial Profiler (GeoMx DSP), Stereo-seq, Deterministic Barcoding in Tissue sequencing (DBiT-seq), and the open-source Open-ST, capture mRNA on spatially barcoded arrays or beads before next-generation sequencing. Imaging-based methods, including Multiplexed Error-Robust Fluorescence in Situ Hybridization (MERFISH), Molecular Cartography, RNAscope, CosMX, and Xenium, directly visualize transcripts in situ through multiplexed hybridization or padlock probe chemistry27,28. Alternatively, platforms can be categorized as targeted or untargeted, depending on whether they require probe-based detection17,24.
Spatial transcriptomics methods have been readily applied to soft tissues, such as the brain, heart, and liver, where generating intact histological sections is simple29,30,31. In contrast, the implementation of spatial transcriptomics in bone is considerably more challenging due to its mineralized nature, which requires a decalcification process32,33, the controlled removal of calcium phosphate, making the tissue soft enough for sectioning and downstream histological or molecular analyses8,20,23,34. Traditional decalcification methods routinely used in clinical practice typically rely on harsh acidic solutions such as hydrochloric, nitric, formic, or phosphoric acid, which severely degrade RNA integrity and disrupt cellular morphology35,36. Such molecular degradation reduces the signal-to-noise ratio in spatial assays, often resulting in unacceptably low gene detection rates compared to soft tissues8,10. This limitation highlights the need for standardized decalcification workflows that reliably preserve mRNA integrity in mineralized samples for sequencing-based spatial analyses8,20.
This protocol presents a standardized workflow for preparing formalin-fixed, paraffin-embedded (FFPE) BM samples for spatial transcriptomics, previously applied by Muiños-Lopez et al.8. The workflow includes a 10-day decalcification step using ethylenediaminetetraacetic acid (EDTA) at a controlled pH. Unlike aggressive acids, EDTA functions as a gentle chelator that preserves microscopic structure and maintains nucleic acid quality, supporting its use in molecular applications8,20,33,36,37. As a proof of concept, the protocol was implemented on bone tissue samples from healthy and multiple myeloma (MM) mouse models, as well as human BM specimens from both healthy and diseased individuals, and the samples were subsequently sequenced on the Visium Spatial Gene Expression platform38. The workflow includes standardized procedures for tissue acquisition from both human and mouse bone samples, fixation, decalcification, dehydration, paraffin embedding, and sectioning, followed by a comprehensive quality-control pipeline encompassing section integrity assessment, hematoxylin and eosin (H&E) staining, RNA quality evaluation (DV200), and optional immunofluorescence (IF) for cell-type verification. These preparatory steps ensure that only high-quality sections proceed to downstream spatial transcriptomics workflows, including pre-processing of tissue sections, library construction, sequencing, and subsequent data quality control and analysis.
This standardized procedure supports the preparation and quality assessment of human and murine BM samples for spatial transcriptomic analysis. It is intended to facilitate investigations of niche-specific regulatory programs in hematological and skeletal disorders.
Protocol
All animal experiments were conducted in accordance with the European Directive 2010/63/EU on the protection of animals used for scientific purposes and were approved by the Animal Ethics Committee of the University of Navarra (Comité de Ética para la Experimentación Animal; protocols CEEA082-20 and CEEA039-20). Animal care, handling, and euthanasia were performed in compliance with Spanish legislation to minimize pain and suffering.
The human study was approved by the Research Ethics Committee of the University of Navarra School of Medicine (Comisión de Ética de Investigación, CEI; projects 2022.100mod1 and 2023.172) and the Research Ethics Committee of the Navarra Health Service (CEIm–Departamento de Salud de Navarra; PI_2022/92 MS-1). All procedures involving human participants were conducted in accordance with the ethical principles of the Declaration of Helsinki. Personal data were handled confidentially in compliance with the Spanish Organic Law 3/2018 on the Protection of Personal Data and Guarantee of Digital Rights and Spanish Law 14/2007 on Biomedical Research.
NOTE: A detailed list of the reagents and equipment used in this study is provided in the Table of Materials. The comprehensive experimental pipeline for implementing spatial transcriptomics in bone tissues is schematically illustrated in Figure 1 and organized into three operational phases: sample acquisition, quality control (QC), and spatial transcriptomic profiling. Sample acquisition includes collecting human or murine bone fragments, followed by fixation, EDTA decalcification, dehydration, paraffin embedding, and sectioning and slide preparation. The QC phase assesses histological integrity and RNA preservation. Validated bone sections then undergo on-slide tissue permeabilization, library preparation, sequencing, and data analysis.
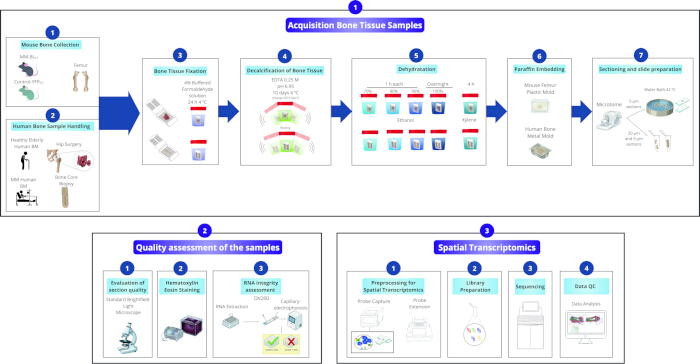
Figure 1: Sample collection and EDTA-based preparation workflow for murine and human bone tissues. Mouse femurs and human bone samples are collected, fixed, decalcified in EDTA, dehydrated, paraffin-embedded, and sectioned. Sample quality is evaluated by H&E staining and RNA integrity (DV200) assessment, followed by spatial transcriptomic tissue preprocessing, library preparation, sequencing, and data quality control. Abbreviations: BM = bone marrow; DV200 = percentage of RNA fragments longer than 200 nucleotides; EDTA = ethylenediaminetetraacetic acid; H&E = hematoxylin and eosin; QC = quality control. Please click here to view a larger version of this figure.
1. Acquisition and processing of bone tissue samples
- Mouse bone collection
- Anesthetize the animals with 5% isoflurane and confirm loss of reflexes.
- Once fully anesthetized, perform euthanasia by cervical dislocation following institutional and regulatory guidelines.
NOTE: Euthanasia must be performed by trained personnel, and death must be confirmed before proceeding with tissue collection. - Disinfect the skin by spraying 70% ethanol on the dorsal surface of the mouse, and using surgical scissors, make a small incision to carefully remove the skin and expose the hind limbs.
- Dissect hind limbs by cutting above the hip joint and transfer them to a 50 mL tube containing 10 mL of cold Dulbecco’s Phosphate Buffered Saline (DPBS). Place the tube on ice.
- Remove attached muscle and connective tissue using sterile forceps and a scalpel.
- Transfer the bones to a 50 mL sterile container prefilled with clean, cold DPBS, then place the container on ice.
- Proceed immediately with sample tissue fixation to preserve tissue integrity.
- Human bone sample handling
- Receive bone core biopsies or surgical bone fragments in 100 mL sterile containers.
- Transfer the bone fragments to a clean, sterile 100 mL container prefilled with cold DPBS, then place it on ice.
- Proceed immediately with sample fixation to preserve tissue integrity.
CAUTION: Human samples must be handled under BSL 2 conditions.
- Bone tissue fixation
- Take the 50 mL or 100 mL container holding the bone sample and discard the DPBS.
- Label plastic cassettes and introduce the bone samples into individual cassettes. Close the lids securely to prevent tissue loss during subsequent processing.
NOTE: For mouse samples, place one bone per cassette. For human bone samples, if necessary, use a sterile scalpel to cut the tissue into fragments small enough to fit into standard cassettes, and place one fragment per cassette. If human bone samples are too hard to section at this stage, they may be left intact and transferred into the decalcification solution; once decalcified, the softened tissue can then be cut into appropriately sized fragments and placed into labeled cassettes. - Add 4% buffered formaldehyde solution at a 1:20 sample-to-fixative ratio and incubate the sample for 24 h at 4 °C.
CAUTION: Handle the fixative inside a chemical fume hood because of its toxicity and volatile fumes.
NOTE: Avoid over-fixation (>48 h), which reduces RNA integrity in FFPE workflows39.
- Decalcification of mineralized bone tissue
- Discard the formalin and wash the bone sample with ultrapure water. Rinse with water, briefly agitate, and discard to eliminate any remaining formalin residue.
- Prepare a 0.25 M EDTA solution in ultrapure water and adjust the pH to 6.95.
NOTE: Although EDTA is often adjusted to pH 8.0 in traditional decalcification protocols, this workflow uses EDTA at approximately pH 6.95 to support efficient chelation while preserving tissue morphology and RNA quality8. - Add the EDTA solution to the container holding the bone sample and incubate for 10 days at 4 °C with gentle agitation.
NOTE: For mouse samples, approximately 50 mL of EDTA solution is typically sufficient. For human bone samples, approximately 100 mL is typically used. However, this volume can be adjusted based on bone size to ensure complete immersion and effective decalcification. - After 5 days of decalcification, discard the EDTA solution and replace it with the same volume of fresh EDTA, as the chelating capacity becomes saturated over time. Continue incubation under the same conditions.
- After 10 days of incubation, discard the EDTA solution and assess whether decalcification is complete.
- Make a small cut with a sterile scalpel or insert a fine sterile needle into a corner or peripheral region of the tissue, always selecting an area of low analytical relevance to avoid altering regions of interest. Place the bone on a sterile Petri dish to stabilize the sample during cutting or needle insertion. If the tissue can be cut easily or the needle passes through with minimal resistance, the sample is adequately decalcified.
- In the case of mouse femurs, gently bend the bone with forceps to assess flexibility, a reliable indicator of complete mineral removal.
NOTE: The duration of the decalcification step depends on the bone sample size and thickness, as well as the EDTA volume used. If the bone remains firm after the initial incubation period, continue decalcification until the tissue is sufficiently soft to cut easily. Excessive prolongation may compromise tissue quality and RNA integrity, so the extension should be limited to the minimum time required to achieve adequate softening20.
- Dehydration
- Wash by adding ultrapure water to the container holding the bone sample, then incubate for 5 min at 4 °C with agitation.
- Discard the water and replace it with a 70% ethanol solution. Incubate for 1 h at 4 °C.
NOTE: This step can serve as a stopping point. Samples can be stored in 70% ethanol at 4 °C before proceeding to the next steps. The maximum storage duration was not experimentally validated in this protocol, so users should proceed according to their laboratory’s standard practices. - Sequentially dehydrate the sample in increasing concentrations of ethanol (70%, 80%, 96%; 1 h each at 4 °C), followed by 100% ethanol overnight at 4 °C.
- Discard the 100% ethanol and replace it with xylene. Incubate for 4 h at room temperature (RT).
- Discard the xylene and place the sample cassette in a glass containing melted, clean paraffin. Incubate in melted paraffin overnight at 60 °C.
NOTE: Shorter infiltration times may be used when vacuum‑assisted processing systems are available, as these devices facilitate more efficient paraffin penetration40,41,42.
CAUTION: All steps involving xylene and graded ethanol solutions must be performed inside a chemical fume hood to ensure proper ventilation and to minimize exposure to toxic and flammable vapors.
- Paraffin embedding
NOTE: Clean the surfaces of the embedding station with an RNase decontamination solution to prevent RNA degradation.- Turn on the embedding station and preheat the paraffin reservoir, cassette paraffin bath, mold paraffin bath, and mold warming plate to 60 °C. Activate the cold plate to let it cool before embedding.
- Allow the paraffin to fully melt, and only then place the cassettes containing paraffin-infiltrated samples in the cassette paraffin bath. Incubate for 2 h to ensure complete xylene clearance prior to embedding.
- Place all the necessary molds in the mold paraffin bath.
NOTE: For human samples, use standard metal embedding molds. For mouse samples, use plastic embedding molds compatible with the Visium platform that include a square cavity with dimensions suitable for proper section placement on Visium slides. Because whole mouse bones do not fit entirely within the square cavity of these molds, cut the bones immediately before embedding using a sterile scalpel to obtain fragments of appropriate size. One or two bone fragments may be embedded per mold, depending on their dimensions. - Add a thin base layer of fresh paraffin by dispensing melted paraffin from the central outlet of the embedding station.
- Open the cassette and gently transfer the tissue from the cassette to the mold using warm forceps.
- Place the paraffin-filled mold on the mold-warming plate and, while the paraffin remains liquid, orient the tissue in the desired cutting plane with warm forceps.
- Place the mold on the cold surface of the embedding station to briefly fix the position of the bone fragment.
- Fill the mold completely with melted paraffin from the dispenser, ensuring the tissue is fully covered and no large bubbles remain.
- Position the labeled cassette on top of the mold so it forms the base of the paraffin block.
- Transfer the mold with the cassette attached to the cold plate of the embedding station. Allow the paraffin to solidify completely for 10 min, until the block is opaque and firm.
- Once solid, remove the paraffin block from the mold and store it at 4 °C until sectioning.
NOTE: This step can serve as a stopping point. The paraffin block can be stored at 4 °C; however, whenever possible, tissue sectioning and downstream spatial transcriptomic analyses should be performed as soon as is practical after embedding to minimize RNA degradation during storage43,44.
- Sectioning and slide preparation
NOTE: Clean the microtome and the water bath with an RNase decontamination solution to prevent RNA degradation.- Fill the water bath with distilled water and preheat it to 42 °C. Turn on the microtome and install a new blade. Label microscope slides with a pencil.
- Mount the paraffin block in the specimen holder, ensuring the cassette is oriented according to the desired longitudinal cutting plane.
NOTE: Prepare a plastic bag filled with ice, and when cutting becomes difficult due to soft paraffin, place the ice bag directly over the block while it remains mounted in the microtome, securing it with a rubber band for several minutes to firm the paraffin and improve section quality. - Set the microtome thickness to 20 µm and perform the trimming cuts.
- Change the microtome setting to 5 µm. Collect four 5 µm sections into a labeled RNase-free 1.5 mL microcentrifuge tube. Keep the tube on dry ice and store at -80 °C.
- Continue sectioning at 5 µm and float the ribbons in the water bath. Once the section is fully expanded and wrinkle-free, pick it up with the labeled slide.
- At every set number of sections (e.g., every 5-10 ribbons, depending on tissue size), collect an additional 4 of 5 µm sections into a new labeled 1.5 mL tube. Repeat this process until obtaining a total of three 1.5 mL tubes containing 5 µm sections.
NOTE: If the tissue cracks, breaks, or cannot be obtained in a continuous section, the sample is not fully decalcified and requires additional decalcification time. Recover the sample by reversing the workflow steps until the decalcification phase is reached. To do so, melt the paraffin block at 60 °C for approximately 2 h, and transfer the specimen to xylene (2 h). Rehydrate the sample through graded ethanol solutions (100%, 96%, 80%, 70%) followed by distilled water. Return the rehydrated sample to fresh 0.25 M EDTA (pH 6.95) and extend the decalcification period as needed before proceeding with dehydration, re-embedding, and sectioning. This recovery procedure should be used strictly as a last‑resort option, as reversing FFPE processing may compromise RNA integrity.
- At every set number of sections (e.g., every 5-10 ribbons, depending on tissue size), collect an additional 4 of 5 µm sections into a new labeled 1.5 mL tube. Repeat this process until obtaining a total of three 1.5 mL tubes containing 5 µm sections.
- Place the slides in a 37 °C oven overnight to evaporate any residual water, then store them at 4 °C.
- To improve tissue adhesion, optionally bake the slides for 3 h at 42 °C before incubating them overnight at 37 °C.
NOTE: This step is generally not necessary when using the glass slides listed in the Table of Materials, as these slides provide strong adhesion and the tissue typically remains firmly attached throughout processing. This step can serve as a stopping point. Slides can be stored at 4 °C; however, whenever possible, downstream spatial transcriptomic analyses should be performed as soon as is practical after embedding to minimize RNA degradation during storage43,44.
2. Quality assessment of the sample
- Evaluation of section quality
- Examine all sections one by one under a standard brightfield light microscope (4×–10×). Inspect each slide to ensure sections are not fragmented and record the quality of each section.
NOTE: Check for folds, wrinkles, compression, or chatter marks, which may indicate issues with paraffin hardness, blade sharpness, or incomplete decalcification. Verify that no areas of tissue are missing due to detachment during sectioning or transfer to the water bath. - Select the best-preserved sections for spatial transcriptomics (most complete, best morphology).
- Identify the consecutive sections adjacent to the selected ones and reserve them for H&E staining and IF, ensuring the stained image corresponds as closely as possible to the tissue that will be sequenced.
- Examine all sections one by one under a standard brightfield light microscope (4×–10×). Inspect each slide to ensure sections are not fragmented and record the quality of each section.
- H&E staining for tissue integrity
- Place the slides in a glass slide staining rack and incubate them for 15 min at 60 °C.
- Transfer the rack to glass staining jars containing xylene for 15 min.
- Rehydrate the sections by moving the rack through staining jars containing 100%, 96%, 80%, and 70% ethanol, incubating 5 min in each solution.
CAUTION: All steps involving xylene and graded ethanol solutions must be performed inside a chemical fume hood to ensure proper ventilation and to minimize exposure to toxic and flammable vapors. - Rinse the slides for 5 min in a staining jar filled with water.
- Immerse the rack in hematoxylin for 10 min, then wash under running tap water until the rinse water becomes clear.
- Immerse the rack in water containing five drops of concentrated hydrochloric acid, agitating gently until a reddish tone appears.
- Transfer the rack to water saturated with lithium carbonate until a stable blue coloration develops, then rinse briefly in water.
- Stain the sections in 1% (w/v) eosin for 5 min, then rinse again in water.
- Dehydrate the slides by moving the rack through staining jars containing water, 70%, 80%, 96% and 100% ethanol, incubating for 5 min in each solution.
- Clear the slides in xylene for 15 min.
- Gently dry the back of each slide, apply mounting medium to a coverslip, and mount the sections. Allow the slides to dry at RT for 24 h before imaging.
- Perform tissue imaging using a high-resolution microscope at 20x magnification.
NOTE: Perform H&E staining on adjacent sections first as a quality-control step to assess sample suitability for spatial transcriptomics. After selection, perform a second H&E stain directly on the section intended for spatial transcriptomics, following the manufacturer's tissue-preparation guideline for the spatial gene expression platform listed in the Table of Materials.
- RNA integrity assessment (DV200)
NOTE: For the spatial gene expression protocol, the traditional RNA Integrity Number (RIN) is ineffective because the 18S and 28S ribosomal RNA peaks are typically absent in fixed tissues. Therefore, the DV200 metric, defined as the percentage of RNA fragments greater than 200 nucleotides, is commonly used as a more informative quality parameter than the RIN for degraded clinical samples. For Visium v2, 10x Genomics recommends using FFPE blocks with a DV200 value ≥ 30% to ensure efficient probe hybridization and optimal assay performance. Selecting tissue blocks with the highest available DV200 values helps prevent sequencing dropouts and maximizes spot sensitivity.- Retrieve the 1.5 mL tubes containing the 5 µm sections collected during the tissue sectioning step and place them on ice to extract RNA.
- Extract total RNA. This standardized procedure includes sample deparaffinization, proteinase K digestion to reverse formalin cross-links, genomic DNA removal via DNase I treatment, and final elution of the purified RNA in RNase-free water.
- Assess RNA integrity using a capillary-electrophoresis-based system with a high-sensitivity RNA assay. A summary of the workflow is provided in Supplementary File 142,45,46,47,48.
- Optional IF for cell type verification
- Place the FFPE slide in a glass slide staining rack and incubate it for 15 min at 60 °C.
- Transfer the rack to glass staining jars containing xylene for 15 min.
- Rehydrate the section by moving the rack through 100%, 96%, 80%, and 70% ethanol for 2 min each, followed by 5 min in water and 5 min in PBS-Tween (1x PBS supplemented with 0.1% Tween-20).
CAUTION: All steps involving xylene and ethanol must be performed inside a chemical fume hood. - Perform antigen retrieval according to the manufacturer’s recommendations for the primary antibody, ensuring that the retrieval buffer, pH, and heating conditions match the antibody datasheet. NOTE: In this workflow, antigen retrieval is performed using 10 mM Tris and 1 mM EDTA, pH 9.0, in a cooking pot heating system for 30 min at 95 °C, then cooled for 20 min at RT.
- Wash the slide twice for 10 min each time in PBS-Tween.
- Draw a hydrophobic barrier around the tissue using a hydrophobic barrier pen and block nonspecific binding by applying 5% BSA in 1x DPBS to tissue sections for at least 40 min at RT in a humidified chamber.
NOTE: The humid chamber is prepared by placing a sheet of filter paper in a plastic slide‑staining box and thoroughly moistening it with distilled water to maintain a stable humid environment during antibody incubation. - Prepare the primary antibody solution in 1x DPBS at the recommended dilution for each antibody.
NOTE: In this workflow, primary antibodies against Emcn (V.7C7) and Cd271 (ME20.4) were used to identify murine EC and MSC, respectively, while antibodies against CD31 (JC70A) or PRRX1 (polyclonal) were used to identify their human counterparts, as per the manufacturer’s protocol. - Remove the blocking solution by gently tapping the edge of the slide on absorbent paper to remove residual droplets, then apply the primary antibody mix and incubate the slide overnight at 4 °C in a humidified chamber.
- Wash the slide twice for 5 min in PBS-Tween and prepare the secondary antibody solution at the dilution recommended by the manufacturer, ensuring fluorophores are spectrally compatible and do not overlap.
NOTE: In this workflow, Alexa Fluor-conjugated secondary antibody at a 1:200 dilution was used. - Apply the secondary antibody mix and incubate for 30 min at RT, protected from light in a humidified chamber.
- Wash the slide twice for 5 min in PBS-Tween.
- Apply a 1:10 dilution of the DAPI‑containing mounting medium (see Table of Materials), prepared in a 1:1 PBS–glycerol solution, and incubate the sample for 5 min.
- Mount the section with a coverslip and seal the edges with nail polish to prevent drying.
- Visualize the stained tissue using a multispectral imaging platform.
Supplementary File 1: Summary of Protocol Steps for RNA Integrity Assessment and Visium Spatial Transcriptomics Workflow. This supplementary file provides a detailed summary of the procedural steps performed in accordance with the manufacturer’s instructions. It includes: (i) the High Sensitivity RNA ScreenTape Assay used to evaluate RNA integrity (DV200) as described in step 2.3.3 of the main protocol, and (ii) an overview of the Visium CytAssist Spatial Gene Expression workflow encompassing tissue pre‑processing, library preparation, and sequencing (steps 3.1–3.3 of the main protocol).Please click here to download this file.
3. Spatial transcriptomics
NOTE: Perform the spatial transcriptomics workflow using the platform and reagents listed in the Table of Materials, following the corresponding user guides42,45,46. Supplementary File 1 summarizes the main tissue preprocessing, library preparation, and sequencing steps.
- Spatial transcriptomics data quality control
- Demultiplex the spatial transcriptomic data using the standard pipeline for Visium datasets (see Table of Materials).
- Map the reads to the appropriate Ensembl 105 reference genome.
NOTE: GRCh38 for human samples and mm10 for mouse samples were used. - Generate the filtered feature-barcode matrices using the same pipeline and import them into the downstream single‑cell/spatial analysis environment (see Table of Materials).
- Inspect the H&E images in the visualization interface provided by the spatial transcriptomics pipeline (see Table of Materials) and manually remove spots that overlap the cortical bone region or bone tissue, depending on the dataset.
- Normalize the datasets using a variance‑stabilizing transformation method commonly applied in single‑cell analysis workflows (see Table of Materials).
Results
To evaluate the applicability of this EDTA-based workflow across species and disease contexts, the protocol was applied to four BM samples: two murine femurs and two human bone specimens representing healthy and multiple myeloma (MM) conditions (Table 1 and Figure 1).
| Sample Identification | Species | Sex | Age | Disease |
| YFPcγ1 | Mouse | Female | 210 days | Healthy |
| mMM | Mouse | Male | 314 days | MM |
| hHBM | Human | Male | 76 years | Healthy |
| hMM | Human | Female | 50 years | MM |
Table 1: Murine and human bone samples included in the study. Species, sex, age, and health status are provided for each sample. Abbreviations: hHBM = healthy human bone marrow; hMM = human multiple myeloma; mMM = murine multiple myeloma; MM = multiple myeloma; YFPcγ1 = healthy control mouse.
The samples used in this study have been previously characterized and reported in earlier publications from the research group, specifically in the works of Muiños-Lopez et al. and Cenzano et al., except for the MM mouse sample. For the previously reported specimens, the spatial transcriptomics data and results are presented in those studies8,10. Therefore, the material included here is used to evaluate the protocol's technical suitability for spatial transcriptomics, rather than to present novel biological findings.
Mouse femur bone samples were obtained from the BIC (BIcγ1) genetically engineered MM mouse model, which recapitulates the clinical and immunological characteristics of MM patients, and from their corresponding healthy control mouse (YFPcγ1)8,49. A single femur from each animal was harvested, cleaned, and processed according to the standardized protocol (Figure 2A). Femurs were specifically used for these analyses because they offer abundant available marrow, superior niche quality, and ease of reproducible processing, making them well-suited to a sequencing-based spatial transcriptomic platform8,10. Successful decalcification of the control mouse femur was confirmed macroscopically by a notable increase in tissue flexibility during manual manipulation with forceps (Figure 2B). Subsequently, this bone fragment was efficiently embedded in paraffin utilizing a specialized, spatial-transcriptomics-compatible mold to preserve RNA integrity and tissue architecture for downstream molecular analysis (Figure 2C).
Two human BM samples with contrasting processing histories were also analyzed8,10. A hematologically healthy fresh human BM sample was obtained from surgical waste during an orthopedic hip replacement at the Hospital Universitario de Navarra (Figure 2D–F). To demonstrate the translational utility of the protocol, this sample was processed as for murine samples. Consistent with results observed in mouse tissue, successful EDTA decalcification of human bone was macroscopically confirmed by complete softening of the tissue, as evidenced by effortless needle penetration (Figure 2E). The decalcified human bone fragment was successfully embedded in paraffin using a standard metal mold for downstream processing (Figure 2F). The second human sample consisted of archived FFPE BM biopsies from the iliac crest of an MM patient at the Pathology Department of the Clínica Universidad de Navarra (CUN). Notably, this archived MM sample had been previously decalcified using a standard clinical protocol involving strong acids36. This sample provides a qualitative contrast with the EDTA-processed specimens; however, differences in tissue source, fixation history, storage, and decalcification mean that the observed differences cannot be attributed solely to the decalcifying agent.
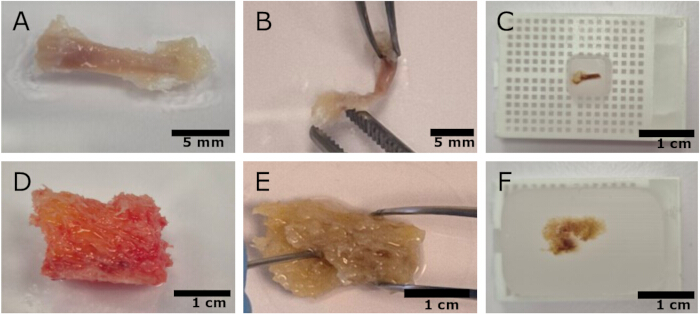
Figure 2: Murine and human bone samples during EDTA-based preparation. (A) Intact control mouse femurs before decalcification. (B) Decalcified control mouse femur showing increased flexibility. (C) Control mouse bone fragments embedded in paraffin. (D) Healthy human bone fragments from hip surgery before decalcification. (E) The same fragment after EDTA decalcification, showing needle penetration. (F) EDTA-decalcified healthy human bone embedded in paraffin. Scale bars: (A, B) 5 mm; (C–F) 1 cm. Abbreviation: EDTA = ethylenediaminetetraacetic acid. Please click here to view a larger version of this figure.
To analyze general tissue architecture, H&E staining was performed (Figure 3). The better morphological preservation observed in the murine sections may reflect differences in sample handling and processing rather than inherent species-specific traits. The mouse femurs were collected specifically for spatial transcriptomics and processed immediately as intact bones, thereby preserving their architecture (Figure 3A, B). In contrast, the human samples originate either from residual material obtained during hip‑replacement surgery (Figure 3C) or from diagnostic MM bone biopsies (Figure 3D), both of which may have variable pre-analytical tissue quality. As a result, the morphological differences between the EDTA‑decalcified human sample and the acid‑decalcified MM biopsy are subtle, since both human specimens already exhibit baseline structural limitations introduced not only by decalcification but also by general tissue processing (Figure 3C, D). Consequently, comprehensively assessing sample quality for spatial transcriptomics requires evaluating multiple distinct parameters. First, tissue integrity must be carefully monitored, as structural preservation can vary significantly with the specific sample type rather than solely with the decalcifying acid used. Second, RNA quality should also be evaluated because decalcification conditions can affect it20,35,36.
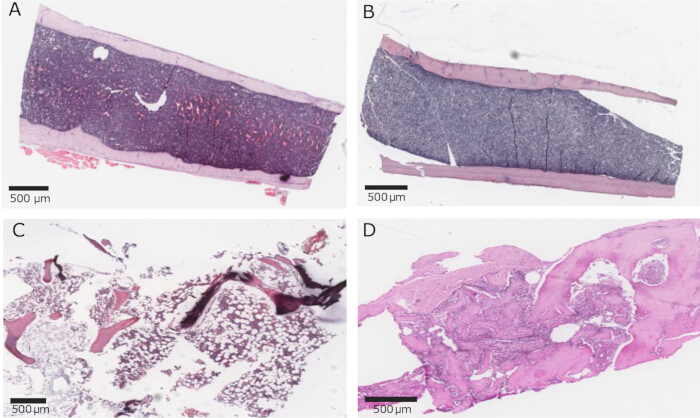
Figure 3: H&E-stained sections used for tissue-quality assessment. Consecutive FFPE sections correspond to (A) a healthy control mouse10, (B) a mouse with MM, (C) healthy human bone8,10, and (D) a human MM biopsy8. Scale bars = 500 µm. Abbreviations: FFPE = formalin-fixed, paraffin-embedded; H&E = hematoxylin and eosin; MM = multiple myeloma. Please click here to view a larger version of this figure.
To complement the histological analysis, RNA quality was evaluated. While H&E staining yielded ambiguous differences, RNA integrity clearly differentiated the effects of the two decalcification methods (Table 2). DV200 values from both murine samples and the healthy human bone specimen exceeded the threshold recommended for Visium FFPE assays, indicating sufficient RNA fragment length distribution for probe hybridization and library construction. The YFP healthy mouse sample shows a DV200 of 82.55%, and the healthy human bone (hHBM) sample reaches 58%, both well above the 30% acceptability threshold defined by 10x Genomics. The MM mouse (mMM) sample shows a DV200 of 31.3%, close to the lower limit of acceptability, which may reflect extended storage of the paraffin block at 4 °C before sectioning, among other sample-specific factors. In contrast, the acid‑decalcified human MM biopsy (hMM) exhibits a DV200 of only 8%, which was associated with markedly lower RNA integrity, even when morphological deterioration is less pronounced. In summary, conducting both structural and molecular assessments is important for assessing sample suitability for downstream spatial analysis.
| Sample Identification | DV200 (%)1 |
| YFPcγ1 | 82.55 |
| mMM | 31.3 |
| hHBM | 58 |
| hMM2 | 8 |
| 1DV200: Percentage of total RNA fragments > 200 nucleotides. | |
| 2This sample was decalcified using a standard clinical protocol involving strong acids. | |
Table 2: RNA quality of the study samples. DV200 is the percentage of RNA fragments longer than 200 nucleotides; values of at least 30% were considered suitable for downstream spatial transcriptomics. Abbreviations: hHBM = healthy human bone marrow; hMM = human multiple myeloma; mMM = murine multiple myeloma.
Additional quality assessments can also be performed. To further validate tissue integrity and confirm the preservation of specific cellular compartments after EDTA decalcification, optional IF staining on adjacent FFPE sections from mouse and human tissues was performed. Endomucin (Emcn) and Cd271 antibodies were used to visualize endothelial (EC) and mesenchymal cells (MSC), respectively, in the MM mouse sample (Figure 4A). This staining showed that EDTA‑processed tissues displayed well‑defined vascular structures with continuous Emcn staining and preserved stromal networks, showing that the tested markers remained detectable after processing. Moreover, high-resolution imaging using an automated multispectral imaging system provided additional evidence that the tested antigens remained detectable for cell-type verification, providing an additional layer of quality control prior to spatial transcriptomic analysis. Furthermore, these findings were also observed in healthy elderly human specimens, in which EC expression was also detected by CD31 and MSC by PRRX1 (Paired Related Homeobox 1) antibodies, showing that the tested niche markers remained identifiable after EDTA decalcification (Figure 4B). In contrast, these findings could not be replicated in human MM biopsies subjected to various acid-based decalcification protocols. As mentioned previously, RNA integrity in these samples was low, limiting downstream transcriptomic analysis. Due to the degraded nature of these human specimens, their downstream utility was limited to baseline transcriptomic profiling8 and immunohistochemical (IHC) evaluation of malignant plasma cells (PC) (Figure 4C).
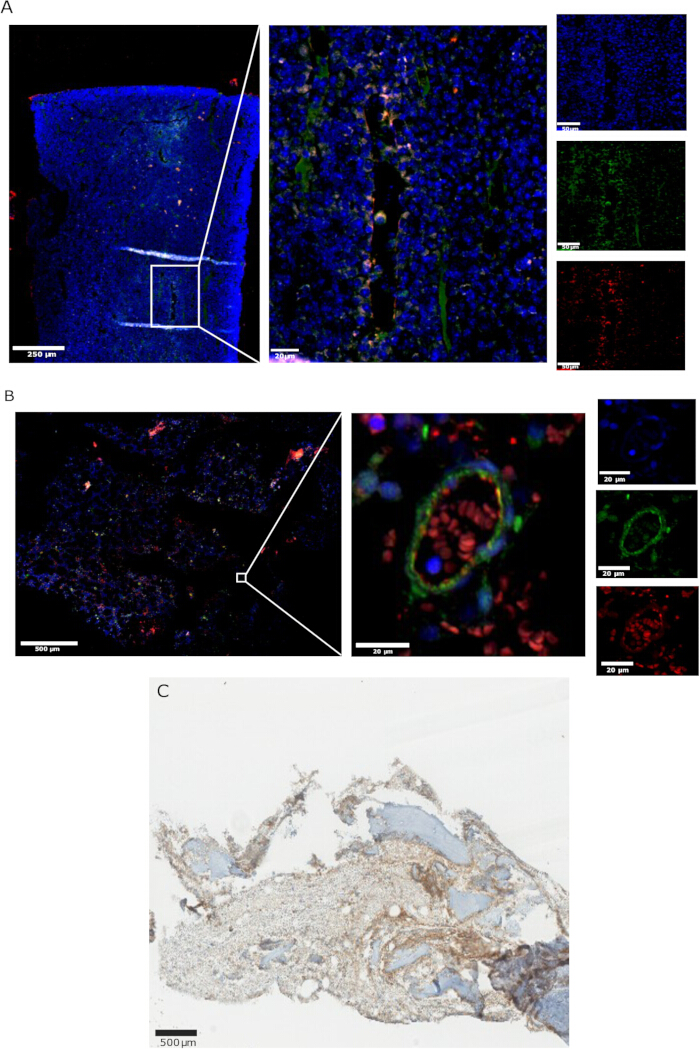
Figure 4: Optional immunofluorescence and immunohistochemistry for cell-type verification. (A) Mouse MM tissue showing DAPI-labeled nuclei (blue), CD271-positive MSC (green), and EMCN-positive EC (red). (B) Healthy human bone showing DAPI-labeled nuclei (blue), PRRX1-positive MSC (green), and CD31-positive EC (red)10. (C) Human MM biopsy showing CD138-positive malignant PC8. Scale bars: (A) 250 µm (overview), 20 µm (merged enlargement), and 50 µm (single-channel images); (B) 500 µm (overview) and 20 µm (merged and single-channel enlargements); (C) 500 µm. Abbreviations: DAPI = 4′,6-diamidino-2-phenylindole; EC = endothelial cell; MM = multiple myeloma; MSC = mesenchymal stromal cell; PC = plasma cell. Please click here to view a larger version of this figure.
Together, the tissue morphology and DV200 results support the suitability of EDTA-processed samples for downstream spatial transcriptomic analysis. Spatial transcriptomic applications of this preparation workflow have been reported previously8,10.
Discussion
By integrating EDTA-based controlled decalcification, standardized FFPE processing, and stringent quality‑control checkpoints, this protocol overcomes many of the limitations traditionally associated with bone tissue preparation for spatial transcriptomics, particularly those related to RNA degradation and morphological damage caused by strong acid‑based decalcification methods8,10,20,33,36. The most critical step in processing mineralized samples for spatial transcriptomics is decalcification. Insufficient decalcification results in bone that remains too rigid to section, making it physically impossible to obtain high-quality sections for spatial transcriptomics8,20,23,37,50. When bone tissue remains too hard, it shatters or chatters against the microtome blade, leading to shredded sections or holes that do not accurately represent the native BM architecture. Importantly, the success of decalcification cannot be fully confirmed until the microtomy stage: even samples that appear superficially softened may still contain residual mineral that becomes evident only when attempting to cut thin FFPE sections. For this reason, careful monitoring of decalcification progress is essential to ensure reproducible outcomes.
The workflow uses 0.25 M EDTA at pH 6.95 for 10 days with constant agitation and solution replacement on the fifth day8,10. During protocol development, EDTA alone, EDTA supplemented with polyvinylpyrrolidone, and 10% formic acid were evaluated, along with different decalcification durations and solution-replacement schedules; the comparative data are not presented here. Durations shorter than 10 days frequently resulted in tissue breakage during sectioning of mouse samples, whereas human samples showed sample-dependent behavior. The 10-day duration is therefore used for murine femurs, while human samples may require longer decalcification according to density and trabecular content. Physical quality-control checkpoints should be used before paraffin embedding. If insufficient decalcification becomes apparent during microtomy, use the reprocessing procedure only as a last-resort salvage step because additional heat, solvent exposure, and rehydration may compromise RNA quality.
The primary limitation of this method is the extended processing time, which contrasts sharply with the rapid acid‑based protocols commonly used in clinical pathology20,36. Although longer processing times are generally acceptable in research settings, recent studies, such as the protocol described by Miao et al., which uses Morse’s solution (22.5% formic acid and 10% sodium citrate) to decalcify within 24 h, highlight the growing interest in accelerating bone preparation for spatial assays20. However, acid-based methods historically carry a much higher risk of RNA degradation, reducing DV200 values and ultimately limiting their compatibility with spatial transcriptomics1,8,35,36. This EDTA-based approach prioritizes RNA preservation over speed, ensuring compatibility with sequencing-based spatial platforms such as Visium.
A potential limitation of BM spatial transcriptomics is the high abundance of immunoglobulin transcripts derived from PC, which may reduce the detection of low-abundance genes. As with the quality-control and filtering strategies applied in a previous study of the research group, including the removal of low-quality spots (<200 UMIs and <150 detected genes), filtering of low-contributing cell types (<20% per spot) during deconvolution analyses, and selection of marker genes detected in the spatial transcriptomic datasets, immunoglobulin transcripts can also be computationally filtered during downstream analysis to minimize their impact when appropriate8. Targeted spatial transcriptomic approaches may further improve the detection of low-abundance transcripts in specific applications.
The potential applications for this method are extensive. Recent integration of spatial and single-cell data has revealed specialized human osteogenic niches and intricate signaling gradients radiating from trabecular bone3,26. Moreover, spatial transcriptomics has shown that aging reshapes the BM microenvironment by altering the spatial organization and communication of EC, leading to impaired osteogenic support and the emergence of inflammatory signaling networks within the aged niche10. Multiomic profiling has also identified distinct microenvironmental neighborhoods, such as arterio-endosteal regions that support early myelopoiesis and peri-adipocytic zones enriched for hematopoietic stem and progenitor cells3. In the context of MM, this protocol enables the integration of spatial and single-cell transcriptomic frameworks to characterize the composition of diseased murine BM and cell–cell interactions. Previous work revealed spatially distinct distributions of malignant PC and identified immune and inflammatory programs, such as NETosis and IL-17 signaling, that were inversely associated with tumor-enriched regions. Additionally, an increase in malignant PC density correlated with a shift from effector to exhausted T-cell states. These findings were also validated in human FFPE BM samples, demonstrating their translational relevance across varying disease burdens8. Ultimately, this preparation workflow provides the technical foundation for exploring the complex cellular interactions within the BM’s mineralized architecture.
High-definition spatial gene expression platforms can provide whole-transcriptome profiling at near-single-cell resolution38,51,52. These approaches may extend the use of the preparation workflow to higher-resolution analysis of spatially organized BM and hematological malignancies. The workflow, therefore, provides a technical foundation for future studies of physiological and malignant hematopoiesis.
Disclosures
The authors declare no competing interests. A patent on the know-how and experimental use of the MIcγ1 mouse models of MM has been licensed to MIMO Biosciences (application no. PCT/EP2023/071025).
Acknowledgements
This work was supported by the Instituto de Salud Carlos III and co-financed by ERDF A way of making Europe (PI22/00983); CIBERONC (CB16/12/00489), RICORS TERAV (RD21/0017/0009) and RICORS TERAV Plus (RD24/0014/0010); AGATA 0011-1411-2020- 000010/0011-1411-2020-000011; Departamento de Salud Gobierno de Navarra (GN2024/04); the Cancer Research UK [C355/A26819]; FC AECC and AIRC under the Accelerator Award Program; The International Myeloma Foundation (Brian van Novis) and The Paula and Rodger Riney Foundation to FP. IAC was supported by a Marie Curie grant (H2020- MSCA-IF-837491) from the European Commission, AECC Talent grant (INVES258003CALV), and Departamento de Salud, Gobierno de Navarra (GN2023/03). MC was supported by an FPU fellowship (FPU22/03283) from the Ministerio de Ciencia, Innovación y Universidades. We would like to thank the staff of the Advanced Genomics Laboratory and the Animal Facility at CIMA Universidad de Navarra for their invaluable technical and intellectual assistance. We also acknowledge the Pathology Departments of Clínica Universidad de Navarra (CUN) and Hospital Universitario de Navarra for providing BM samples and for their outstanding collaboration. Special thanks are due to José Ángel Martínez-Climent and Marta Larrayoz for their MM mouse models. Thanks to Patxi San Martín-Uriz, Tania López, and Eduardo Larequi for their excellent support in technology optimization, protocol development, and troubleshooting the processing of mouse and human BM samples for spatial transcriptomics. We also thank Beñat Ariceta and Asier Ullate for all their computational work on spatial transcriptomics. Finally, we are deeply grateful to the patients and healthy donors who generously participated in this study.
Materials
| Name | Company | Catalog Number | Comments |
|---|---|---|---|
| 1.5 mL tubes | Eppendorf | 15625367 | |
| 100 mL sterile container | deltalab | 723-510 | |
| 4200 TapeStation | Agilent | G2991A | Capillary-electrophoresis–based system for RNA integrity assesment |
| 50 mL sterile container | IberoMed | REOR001 | |
| 50 mL tube | FALCON | 352070 | |
| Advanced PAP Pen | Ted Pella 22309 | Z377821-1EA | Hydrophobic barrier pen |
| Anti-PRRX1 antibody produced in rabbit | Sigma-Aldrich | HPA051084 | |
| BSA (Bovine Serum Albumin) | Sigma-Aldrich | A9418-50G | |
| Cassettes | KartellLABWARE | 2921 | |
| CD271 (NGF Receptor) Monoclonal Antibody (ME20.4) | Invitrogen | 14-9400-82 | |
| CD31, Endothelial Cell (Concentrate) Clone JC70A | Aligent Dako | M0823 | |
| Coverslips | Fisher Scientific | 12-544-EP | 50 mm x 24 mm |
| DAPI (VECTASHIELD Antifade Mounting Medium with DAPI) | Vector Laboratories | H-1200-10 | |
| Deparaffinization Solution | Qiagen | 19093 | |
| DPBS | Thermo Scientific | AAJ67802AP | Thermo Scientific Chemicals Phosphate-buffered saline (DPBS, 1×), Dulbecco's formula, without calcium, without magnesium |
| DPX Mountant for histology | Sigma-Aldrich | 06522-500ML | |
| EDTA | Thermo Scientific | 15748687 | Ethylenediaminetetraacetic acid, (EDTA), 0.5 M Solution, Molecular Biology Grade, Ultrapure |
| Embedding station | Leica Biosystems | 14 0388 81101 | Leica EG1150H |
| Emcn Antibody (V.7C7) | Santa Cruz Biotechnology | sc-65495 | |
| Ensembl Reference Genome (GRCh38 / mm10, release 105) | EMBL-EBI | N/A | Reference genome used for read alignment. |
| Eosin | Millipore Sigma | HT110116 | |
| Ethanol | Millipore Sigma | E7023-500ML | Surgical scissors |
| Falc Instruments B-I Histology Water Bath | Falc | 610.1030.00 | |
| Formalin 4% | PanReac AppliChem | 2524311315 | Formaldehyde 3.7%–4.0% w/v buffered to pH = 7 and stabilized with methanol (CE-IVD) for clinical diagnostics |
| Glass slide staining rack | WHEATON | Z710970-3EA | |
| Glass staining jars | BRAND | BR472200-10EA | Mastercycler X50 |
| Glycerol | Sigma-Aldrich | C3H803 | |
| Goat anti-Mouse IgG (H+L) Cross-Adsorbed Secondary Antibody, Alexa Fluo 568 | Invitrogen | A11004 | |
| Goat anti-Mouse IgG (H+L) Highly Cross-Adsorbed Secondary Antibody, Alexa Fluo Plus 488 | Invitrogen | A32723 | |
| Goat anti-Rabbit IgG (H+L) Highly Cross-Adsorbed Secondary Antibody, Alexa Fluor 488 | Invitrogen | A11034 | |
| Hematoxylin | Millipore Sigma | MHS16 | |
| High Sensitivity RNA ScreenTape | Agilent | 5067-5579 | RNA integrity assessment |
| High Sensitivity RNA ScreenTape Ladder | Agilent | 5067-5581 | RNA integrity assessment |
| High Sensitivity RNA ScreenTape Sample Buffer | Agilent | 5067-5580 | RNA integrity assessment |
| High-resolution microscope | Leica Biosystems | N/A | Aperio CS2 Scanner |
| Hydrochloric acid (0.1 N HCl) | Fisher Chemical | SA54-1 | |
| Illumina NextSeq 2000 platform | Illumina | 20038897 | |
| Invitroge Goat anti-Rat IgG (H+L) Cross-Adsorbed Secondary Antibody, Alexa Fluo 568 | Invitrogen | A11077 | |
| Iris Scissors - ToughCut | F.S.T | 14058-11 | |
| Isovet | BRAUN | BR3009 | Isoflurane |
| Lithium carbonate | Merck | 554-13-2 | |
| Loupe Browser (v6.0.0) | 10x Genomics | N/A | Software used to visualize HE images and curate Visium spots; opens .cloupe files generated by the analysis pipeline. |
| Metal embedding molds | Bio-Optica | 07-BM24256 | |
| Microscope Slides | avantor | 631-0108 | Superfrost Plus Microscope Slides |
| Microtome blades | FEATHER | FEAT207500006_U | |
| Microtome HM 340E | Epredia | N/A | HM 340E model |
| Needle | BD | 301156 | BD Microlanc 3 Needle 21 G 1 IN (25 MM) |
| Nikon Optiphot-2 | Nikon | 71052 | Brightfield light microscope |
| Paraffin | PanReac AppliChem | 256993 | Paraffin M.P. 55–58°C plasticized + DMSO pellets(CE-IVD) for clinical diagnostics |
| Petri dish | Corning | CLS430167-100EA | |
| Plastic embedding molds | Bio-Optica | 07-MP7070 | |
| Potts-Smith Forceps | F.S.T | 11012-18 | Forceps |
| Qubit 3.0 Fluorometer | Invotrogen | Q33216 | |
| Qubit Assay Tubes | Invotrogen | Q32856 | |
| Qubit RNA HS Assay Kit | Invotrogen | Q32855 | |
| RNAse free 1.5 mL microcentrifuge tube | Thermo Scientific | AM12400 | |
| RNase-free water | Merk | W4502 | |
| RNaseZap Rnase | Invotrogen | AM9780 | Decontamination Solution |
| RNeasy FFPE Kit (50) | Qiagen | 73504 | Total RNA extraction |
| SCTransform (v0.3.5) | Satija Lab | N/A | Variance-stabilizing normalization method implemented in Seurat. |
| Seurat (v4.3.0.1) | Satija Lab | N/A | R package used for single-cell and spatial transcriptomics analysis. |
| Space Ranger (v2.0.1) | 10x Genomics | N/A | Software used for demultiplexing, alignment, and generation of feature-barcode matrices for Visium datasets. |
| Stlime Scalpel | Schreiber GmbH | 51-11-030 | |
| STutility (v1.1.1) | Bergen Lab | N/A | R package used for spatial transcriptomics visualization and integration. |
| Surgical Scalpel Blade No.23 | Swann-Morton | 210 | Surgical scalpel blades |
| Thermal cycler | Eppendorf | 6313000018 | |
| Tween-200 | Sigma-Aldrich | P2287-500ML | |
| Vectra Polaris | PerkinElmer | CLS143455 | Multispectral imaging platform for IF visualization |
| Visium Accessory Kit 10X Genomics | 10x Genomics | PN-1000194 | |
| Visium CytAssist | 10x Genomics | PN-1000441 | |
| Visium Human Transcriptome Probe Kit Small 10X Genomics | 10x Genomics | PN-1000363 | |
| Visium Mouse Transcriptome Probe Kit Small 10X Genomics | 10x Genomics | PN-1000365 | |
| Visium Spatial Gene Expression Slide Kit 4 rxns 10X Genomics | 10x Genomics | PN-1000188 | |
| Xylene | Panreac | 214736 | Xylene, mixture of isomers for analysis, ACS, ISO |
References
- Cooper RA, et al. Spatial transcriptomic approaches for characterising the bone marrow landscape: pitfalls and potential. Leukemia. 2025;39(2):291-295.
- Mercier FE, Ragu C, Scadden DT. The bone marrow at the crossroads of blood and immunity. Nat Rev Immunol. 2012;12(1):49-60.
- Bandyopadhyay S, et al. Mapping the cellular biogeography of human bone marrow niches using single-cell transcriptomics and proteomic imaging. Cell. 2024;187(12):3120-3140.e29.
- Tikhonova AN, et al. The bone marrow microenvironment at single-cell resolution. Nature. 2019;569(7755):222-228.
- Baccin C, et al. Combined single-cell and spatial transcriptomics reveal the molecular, cellular and spatial bone marrow niche organization. Nat Cell Biol. 2020;22(1):38-48.
- Kunisaki Y, et al. Arteriolar niches maintain haematopoietic stem cell quiescence. Nature. 2013;502(7473):637-643.
- Kusumbe AP, Ramasamy SK, Adams RH. Coupling of angiogenesis and osteogenesis by a specific vessel subtype in bone. Nature. 2014;507(7492):323-328.
- Muiños-Lopez E, et al. Characterization of the bone marrow architecture of multiple myeloma using spatial transcriptomics. Commun Biol. 2025;8(1):1620.
- Gui G, et al. Single-cell spatial transcriptomics reveals immunotherapy-driven bone marrow niche remodeling in AML. Sci Adv. 2025;11(28):eadw4871.
- Cenzano I, et al. Single-cell profiling reveals RAB13+ endothelial cells and profibrotic mesenchymal cells in aged human bone marrow. Aging Cell. 2026;25(4):e70475.
- de Jong MME, et al. The multiple myeloma microenvironment is defined by an inflammatory stromal cell landscape. Nat Immunol. 2021;22(6):769-780.
- de Jong MME, et al. An IL-1β-driven neutrophil–stromal cell axis fosters a BAFF-rich protumor microenvironment in individuals with multiple myeloma. Nat Immunol. 2024;25(5):820-833.
- Cenzano I, et al. Stromal and endothelial transcriptional changes during progression from MGUS to myeloma and after treatment response. Nat Commun. 2026;17:74389.
- Ye J, et al. Deconvolution of the hematopoietic stem cell microenvironment reveals a high degree of specialization and conservation. iScience. 2022;25(5):104225.
- Chen L, et al. An inflammatory T-cell-stromal axis contributes to hematopoietic stem/progenitor cell failure and clonal evolution in human myelodysplastic syndrome. Nat Commun. 2025;16(1):10041.
- Prummel KD, et al. Inflammatory stromal and T cells mediate human bone marrow niche remodeling in clonal hematopoiesis and myelodysplasia. Nat Commun. 2025;16(1):10042.
- De Jonghe J, et al. scTrends: A living review of commercial single-cell and spatial 'omic technologies. Cell Genom. 2024;4(12):100723.
- van den Brink SC, et al. Single-cell sequencing reveals dissociation-induced gene expression in tissue subpopulations. Nat Methods. 2017;14(10):935-936.
- Asp M, Bergenstråhle J, Lundeberg J. Spatially resolved transcriptomes—next generation tools for tissue exploration. Bioessays. 2020;42(10):1900221.
- Miao J, et al. A practical protocol of processing mineralized tissue for Visium spatial transcriptomics. Mechanobiol Med. 2025;3(4):100163.
- Baldwin M, et al. A roadmap for delivering a human musculoskeletal cell atlas. Nat Rev Rheumatol. 2023;19(11):738-752.
- Duan H, Cheng T, Cheng H. Spatially resolved transcriptomics: advances and applications. Blood Sci. 2023;5(1):1-12.
- Xiao X, et al. Spatial transcriptomic interrogation of the murine bone marrow signaling landscape. Bone Res. 2023;11(1):59.
- Jain S, Eadon MT. Spatial transcriptomics in health and disease. Nat Rev Nephrol. 2024;20(10):659-671.
- Tilburg J, et al. Spatial transcriptomics of murine bone marrow megakaryocytes at single-cell resolution. Res Pract Thromb Haemost. 2023;7(4):100158.
- Lin W, et al. Mapping the spatial atlas of the human bone tissue integrating spatial and single-cell transcriptomics. Nucleic Acids Res. 2025;53(2):gkae1298.
- Marx V. Method of the Year: spatially resolved transcriptomics. Nat Methods. 2021;18(1):9-14.
- Yue L, et al. A guidebook of spatial transcriptomic technologies, data resources and analysis approaches. Comput Struct Biotechnol J. 2023;21:940-955.
- Joglekar A, et al. A spatially resolved brain region- and cell type-specific isoform atlas of the postnatal mouse brain. Nat Commun. 2021;12(1):463.
- Madissoon E, et al. A spatially resolved atlas of the human lung characterizes a gland-associated immune niche. Nat Genet. 2023;55(1):66-77.
- Wang F, et al. Single-cell and spatial transcriptome analysis reveals the cellular heterogeneity of liver metastatic colorectal cancer. Sci Adv. 2023;9(24):eadf5464.
- Robinson MH, et al. Regulation of antigen-specific T cell infiltration and spatial architecture in multiple myeloma and premalignancy. J Clin Invest. 2023;133(15):e167303.
- Wehrle E, et al. Protocol for preparing formalin-fixed paraffin-embedded musculoskeletal tissue samples from mice for spatial transcriptomics. STAR Protoc. 2024;5(2):103089.
- Sangeetha R, Uma K, Chandavarkar V. Comparison of routine decalcification methods with microwave decalcification of bone and teeth. J Oral Maxillofac Pathol. 2013;17(3):386-391.
- Yip RKH, et al. Profiling the spatial architecture of multiple myeloma in human bone marrow trephine biopsy specimens with spatial transcriptomics. Blood. 2025;146(15):1837-1849.
- Miquelestorena-Standley E, et al. Effect of decalcification protocols on immunohistochemistry and molecular analyses of bone samples. Mod Pathol. 2020;33(8):1505-1517.
- Ambrosi TH, et al. Human skeletal development and regeneration are shaped by functional diversity of stem cells across skeletal sites. Cell Stem Cell. 2025;32(5):811-823.e11.
- 10x Genomics. Visium Spatial Platform. Pleasanton (CA): 10x Genomics. 2026: Available from: https://www.10xgenomics.com/platforms/visium#assays
- Amemiya K, et al. Influence of formalin fixation duration on RNA quality and quantity from formalin-fixed paraffin-embedded hepatocellular carcinoma tissues. Pathol Int. 2023;73(12):593-600.
- Srinivasan M, Sedmak D, Jewell S. Effect of fixatives and tissue processing on the content and integrity of nucleic acids. Am J Pathol. 2002;161(6):1961-1971.
- Nam SK, et al. Effects of fixation and storage of human tissue samples on nucleic acid preservation. Korean J Pathol. 2014;48(1):36-42.
- 10x Genomics. Visium Spatial Gene Expression Reagent Kits for FFPE User Guide. Document CG000407, Revision E. Pleasanton (CA): 10x Genomics. 2026: Available from: https://www.10xgenomics.com/support/spatial-gene-expression-ffpe/documentation/steps/library-construction/visium-spatial-gene-expression-reagent-kits-for-ffpe-user-guide
- Eccher A, et al. Pathology laboratory archives: conservation quality of nucleic acids and proteins for NSCLC molecular testing. J Pers Med. 2024;14(4):333.
- Bai Z, et al. Spatially exploring RNA biology in archival formalin-fixed paraffin-embedded tissues. Cell. 2024;187(23):6760-6779.e24.
- 10x Genomics. Visium CytAssist Spatial Gene Expression for FFPE—Tissue Preparation Guide. Document CG000518, Revision D. Pleasanton (CA): 10x Genomics. 2026: Available from: https://www.10xgenomics.com/support/cytassist-spatial-gene-expression/documentation/steps/tissue-prep/visium-cyt-assist-spatial-gene-expression-for-ffpe-tissue-preparation-guide
- 10x Genomics. Visium CytAssist Spatial Gene Expression Reagent Kits for FFPE User Guide. Document CG000495, Revision G. Pleasanton (CA): 10x Genomics. 2026. Available from: https://www.10xgenomics.com/support/cytassist-spatial-gene-expression/documentation/steps/library-construction/visium-cyt-assist-spatial-gene-expression-reagent-kits-for-ffpe
- Agilent Technologies. High Sensitivity RNA ScreenTape assay for TapeStation systems quick guide. Version A.01.05. Santa Clara (CA): Agilent Technologies. 2024: Available from: https://www.agilent.com/cs/library/usermanuals/public/HS-RNA_QuickGuide.pdf
- Agilent Technologies. Agilent 4200 TapeStation system—System manual. Publication G2991-90000, Version A.02.02. Santa Clara (CA): Agilent Technologies. 2024: Available from: https://download.chem.agilent.com/software/4200_tapestation_user_info_package_v2/tapestation%20user%20information/tapestation%20manuals/agilent%204200%20tapestation%20system%20manual_g2991-90000.pdf
- Larrayoz M, et al. Preclinical models for prediction of immunotherapy outcomes and immune evasion mechanisms in genetically heterogeneous multiple myeloma. Nat Med. 2023;29(3):632-645.
- Wang S. Resolving the bone – optimizing decalcification in spatial transcriptomics and molecular pathology. J Histotechnol. 2025;48(1):68-77.
- Oliveira MF, et al. High-definition spatial transcriptomic profiling of immune cell populations in colorectal cancer. Nat Genet. 2025;57(6):1512-1523.
- Bourgain-Chang E, Kuang X, Cang Z, Nie Q. Reconstructing single-cell resolution from spatial transcriptomics with CellRefiner. Nat Commun. 2026;17(1):3304.
Reprints and Permissions
This article has been published
Video Coming Soon