This protocol describes the fabrication and surgical implantation of flexible, biocompatible silicone strain gauges for continuous monitoring of gastric motility in freely moving C57BL/6J mice. The method provides stable long-term recordings through refined silicone encapsulation and secure head-mounted connector fixation.
Method Article
Fabrication and Implantation of Refined Silicone Strain Gauges for Long-Term Monitoring of Gastric Motility in Freely Moving Mice
In This Article
Summary
Abstract
This protocol describes the fabrication and surgical implantation of flexible, biocompatible silicone strain gauges for long-term monitoring of gastric motility in freely moving C57BL/6J mice. Continuous assessment of gastric motor activity in conscious animals remains technically challenging because anesthesia and invasive procedures can alter normal gastrointestinal physiology. To address these challenges, this protocol combines refined silicone encapsulation of the strain gauge with secure head-mounted connector fixation to improve device stability during long-term recordings while protecting the electrical circuitry from mechanical damage associated with normal animal activity. The procedure enables reliable implantation and continuous recording of gastric contractile activity over a 15-day postoperative period. Representative recordings demonstrate distinct gastric motility patterns during anesthesia, awake baseline, postoperative recovery, and feeding-induced accommodation. Histological evaluation indicates only mild local tissue responses surrounding the implantation site, supporting the biocompatibility of the device under the conditions examined. This protocol provides a reproducible approach for obtaining stable long-term gastric motility recordings in conscious mice and may facilitate investigations of gastrointestinal physiology and disease, including studies using genetically modified mouse models.
Introduction
The precise monitoring of physiological activity in biomedical research, particularly in studies of gastrointestinal motility, is critical for understanding digestive mechanisms and disease pathologies1,2. However, current methods for monitoring gastric motility in freely moving animals have significant limitations. Imaging techniques are often constrained by operational complexity, high equipment requirements, and potential radiation exposure3,4. Balloon-based methods, while useful, generally cannot monitor gastric motility in freely moving animals over extended periods and are often restricted to anesthetized states5. Minimally invasive approaches, such as sonomicrometry, are incapable of recording gastric motility in conscious animals6. Similarly, manometric methods are primarily applicable to anesthetized mice7,8,9. Alternatively, electrophysiological recording of gastric slow waves using serosal electrodes has been developed as a direct approach to capture the underlying pacemaker myoelectrical activity that drives gastric contractions10,11. Although serosal electrodes are highly effective for detecting electrical rhythms and dysrhythmias, they do not directly measure the resulting mechanical force. Furthermore, extracellularly recorded slow waves obtained in vivo may not always faithfully reflect true intracellular slow waves12, and electrical signals recorded from surface or serosal electrodes can be substantially influenced by localized neural activity, meaning they do not necessarily represent actual phasic mechanical contractions13,14.
In contrast, silicone strain gauges convert changes in mechanical movement into electrical signals, enabling prolonged recording of motility patterns in hollow visceral organs such as the stomach and intestines under both physiological and pathological conditions15,16,17. The overall goal of this protocol is to describe the fabrication and surgical implantation of refined silicone strain gauges for long-term monitoring of gastric motility in freely moving C57BL/6J mice, the most widely used genetic background for transgenic models in gastroenterology. Building on previously described strain-gauge methodologies18, this protocol incorporates an ultra-thin (0.2 mm) sensor profile with a lightweight, biocompatible 704 silicone encapsulation to reduce the mechanical load on the murine gastric wall compared with previous designs. In addition, a modular head-mounted connector routing strategy minimizes postoperative cable tension and chewing-related damage, thereby improving device stability during long-term recordings. The protocol is intended for investigators seeking long-term, direct measurements of gastric mechanical activity in conscious mice during different physiological states, including postoperative recovery and feeding. The reported reductions in tissue adhesion and minimal functional disruption should be interpreted within the scope of the validation data presented, and further quantitative evaluation of these parameters remains an important direction for future studies.
Protocol
This study was conducted in accordance with the Guiding Opinions on the Treatment of Experimental Animals issued by the Ministry of Science and Technology. All experiments were approved by the Committee on the Ethics of Animal Experiments at the China Academy of Chinese Medical Sciences (No. D2024-01-26-07).
1. Animal Preparation
- Obtain healthy wild-type C57BL/6J male mice that are 8 weeks old and weigh 25 ± 3 g.
- Maintain the mice under specific pathogen-free (SPF) conditions at 22°C ± 1°C, 55% ± 5% relative humidity, and a 12 h light/dark cycle. Group-house no more than five mice per cage.
- Provide standard chow and water ad libitum. Allow the mice free access to food and water until anesthesia induction to maintain appropriate gastric wall tension during surgery.
- Allow the animals to acclimate to the laboratory for 7 days before initiating experiments on Day 8.
- Randomly assign the acclimated mice to the experimental groups to minimize potential selection bias.
- Perform a clinical health assessment for each mouse 24 h before surgery by evaluating physical appearance, behavior, and body weight. Exclude animals exhibiting signs of illness, injury, or body weight loss greater than 10%.
- Measure the body weight of each mouse immediately before anesthesia. Calculate the injection volume at 20 mL/kg, corresponding to a tribromoethanol dose of 250 mg/kg.
2. Strain Gauge Preparation18
- Obtain a 350 Ω strain gauge with a base size of 3.6 mm × 3.0 mm, a grid size of 2.0 mm × 1.0 mm, and a thickness of 0.06 mm. Use a strain gauge with a sensitivity coefficient of 2.0% ± 1% (Accuracy Class A) pre-attached to double enameled wires (0.15 mm diameter, 100 mm length).
- Apply a uniform layer of silicone rubber to both sides of the strain gauge until the fully encapsulated device is approximately 0.2 mm thick. Ensure that all surfaces are completely covered without exposed areas.
- Apply an additional drop of silicone rubber to the solder point and spread it evenly with a cotton swab until the strain gauge is completely encapsulated. Verify that the final device dimensions are approximately 6.0 mm × 8.0 mm.
- Confirm complete encapsulation by ensuring that the silicone coating is smooth and free of air bubbles or gaps and that the final device matches the target dimensions.
- Cure the encapsulated strain gauge for at least 48 h at room temperature (22°C ± 1°C) and 60%–70% relative humidity in a well-ventilated, dust-free environment.
- Weld the head-mounted connector to the enameled wire using a soldering iron, solder, and acid-free solder flux.
- Verify the integrity of the solder joints by gently pulling the enameled wires with iris dissecting forceps. Confirm that the connections remain secure without wire detachment.
- Connect the assembled strain gauge to a bridge amplifier through a strain gauge sensor zero-setting box.
- Balance the circuit by connecting the assembled strain gauge to a custom 350 Ω zero-setting box and the bridge amplifier to eliminate baseline offset caused by wire resistance and maximize the available signal range. After completing all connections, gently bend the encapsulated strain gauge with forceps in both air and 0.9% saline while monitoring the output waveform in the acquisition software. Confirm proper device function by verifying a clear waveform deflection, indicating adequate electrical connectivity, waterproofing, and sensor sensitivity.
3. Surgical Procedure for Strain Gauge Implantation
- Sterilize all surgical instruments with 75% ethanol. Soak the prepared strain gauge components in 75% ethanol for 15 min, followed by immersion in 0.9% sodium chloride solution for 15 min.
- Remove the strain gauge components from the 0.9% sodium chloride solution and proceed immediately with surgical implantation without additional air-drying or rinsing.
- Anesthetize the mouse by intraperitoneal injection of 1.25% tribromoethanol solution (20 mL/kg).
- Use a commercially prepared 1.25% tribromoethanol solution without further dilution. Store the solution at 4°C in an amber bottle protected from light and use it within the manufacturer's expiration date.
- Monitor the animal every 10 min throughout surgery to ensure regular respiration and the absence of movement in response to tactile stimulation. Confirm an adequate surgical plane of anesthesia by verifying the loss of the righting reflex and the absence of the toe-pinch withdrawal reflex.
- No supplemental anesthesia was required because the initial dose provided an adequate surgical plane throughout the procedure.
- Maintain the animal’s core body temperature at 37.0°C ± 0.5°C using a feedback-controlled heating blanket. Apply petrolatum ophthalmic ointment throughout the surgical procedure to prevent corneal drying.
- Remove the hair from the abdomen and skull using a small-animal hair clipper. Disinfect the exposed skin with 1% povidone-iodine solution followed by 75% ethanol (Figure 1A–C).
- Cover the abdomen with a sterile surgical drape (Figure 1D).
- Cover the surgical field with a sterile surgical gauze towel. Create a ventral midline incision approximately 1.5–3.0 cm long, extending caudally from the xiphoid process through the skin and abdominal musculature. Create a second longitudinal incision approximately 5.0–8.0 mm long along the sagittal suture at the apex of the skull (Figure 1E,J).
- Select the incision length according to the animal's body size to provide adequate exposure of the gastric antrum for suturing while minimizing tissue trauma and facilitating wound closure.
- Gently exteriorize the stomach using a cotton swab. Separate the greater omentum and maintain tissue hydration throughout the procedure using cotton balls soaked in 0.9% physiological saline (Figure 1F).
- Separate the greater omentum from the gastric wall by gentle blunt dissection using a moist cotton swab or blunt forceps, taking care to avoid damage to adjacent blood vessels and surrounding tissues.
- Apply warm (37.0°C± 0.5°C) sterile 0.9% saline to the exposed stomach every 3–5 min, or whenever the tissue surface begins to dry, to maintain tissue hydration.
- Gently separate the skin from the underlying musculature using a cotton swab and dissecting forceps to create a continuous subcutaneous tunnel between the cranial and abdominal incisions. Pass the strain gauge assembly through the tunnel, position the head-mounted connector on the forehead, and place the strain gauge over the abdominal region (Figure 1G,J).
- Route the wire through the subcutaneous tunnel from the abdominal incision along the left lateral body wall, beneath the left forelimb, and over the dorsal neck to the cranial incision.
- Suture the strain gauge to the serosal surface of the gastric antrum using 7-0 non-absorbable sutures (Figure 1H). Reposition the greater omentum over the strain gauge and limit the functional suturing area to approximately 5.0 mm × 5.0 mm.
- Place the strain gauge on the serosal surface of the gastric antrum with its long axis and attached wires aligned parallel to the longitudinal muscle fibers extending from the cardia to the pylorus. Orient the solder joints toward the abdominal wall, with the soldered end directed toward the head and the opposite end toward the pylorus (Figure 1H).
- Secure the strain gauge to the gastric serosa using a continuous suture with three fixation points. Place one stitch at the caudal (pyloric) end and two sequential stitches at the cranial (cardiac) end, then secure the assembly with a single knot at the upper midline (Figure 1H).
- Return the stomach and all other abdominal organs to their normal anatomical positions. Secure the enameled wire to the abdominal musculature to minimize anterior-posterior movement.
- Secure the enameled wires to the abdominal musculature by placing an initial knot in the muscle with the suture, wrapping the suture around both wires several times, and tying a final knot to firmly anchor the wires.
- Close the abdominal musculature followed by the skin using 6-0 absorbable sutures (Figure 1I).
- Remove the periosteum using 3% hydrogen peroxide to expose the anterior fontanelle (Figure 1J).
CAUTION: Hydrogen peroxide is an irritant. Wear appropriate personal protective equipment and avoid contact with the eyes and skin. - Apply 3% hydrogen peroxide to the exposed skull for approximately 10 s to remove the periosteum and control minor bleeding. Immediately remove the solution with a sterile cotton swab, rinse thoroughly with sterile saline, and dry the surface completely before applying the basing resin.
- Mix and apply the basing resin to the skull. Press the head-mounted connector onto the resin until it solidifies naturally. Suture the scalp around the secured connector while leaving the circular opening of the head-mounted connector exposed (Figure 1K).
- Allow the basing resin to polymerize undisturbed for approximately 5 min. Confirm complete curing by gently touching the resin surface with the tip of a pair of forceps.
- Stabilize the head-mounted connector with forceps during the initial curing phase until the resin has hardened sufficiently to maintain the connector in position without support.
- Apply povidone-iodine solution around the surgical wound. Administer meloxicam (0.2 mg/kg, subcutaneously) for postoperative analgesia and anti-inflammatory treatment.
- After recovery from anesthesia, return the mouse to its home cage. Administer meloxicam (0.2 mg/kg, intraperitoneally) once daily for two consecutive days.
- Return the mouse to its home cage only after it has regained the righting reflex, exhibits regular and stable respiration, and is able to move normally.
- Monitor the mice daily for at least the first 2 postoperative days and at least twice weekly thereafter. Humanely euthanize animals showing persistent body weight loss accompanied by reduced locomotor activity in accordance with the predefined humane endpoint criteria.
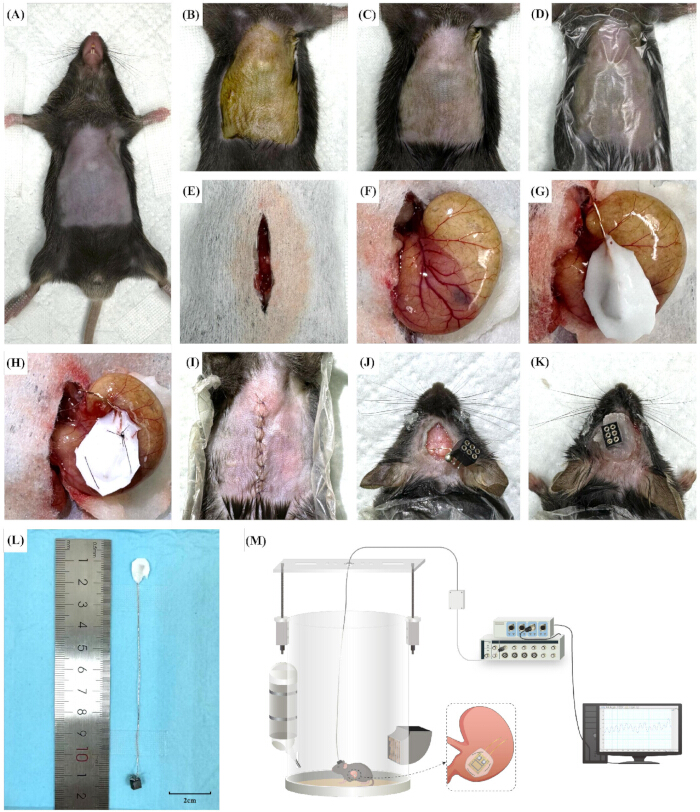
Figure 1. Surgical implantation workflow and gastric motility recording setup. (A) Hair removal from the abdomen. (B) Disinfection with povidone-iodine solution. (C) Cleaning with 75% ethanol. (D) Placement of a sterile surgical drape over the abdomen. (E) Midline abdominal incision and scalp incision. (F) Exposure of the stomach. (G) Subcutaneous passage of the strain gauge assembly and placement of the sensor on the gastric antrum. (H) Suturing of the strain gauge to the serosal layer of the gastric antrum, anatomically located between the incisura angularis and the pylorus. (I) Sequential closure of the abdominal musculature and skin. (J) Exposure of the anterior fontanelle after periosteum removal using 3% hydrogen peroxide. (K) Fixation of the head-mounted connector and closure of the scalp around the connector aperture. (L) Custom strain gauge device shown beside a ruler. (M) Schematic of the free-moving gastric motility recording setup, including the recording chamber, rotary commutator, tethered head-mounted connector, bridge amplifier, data acquisition system, computer, and signal analysis software. Please click here to view a larger version of this figure.
4. Gastric Motility Recording
- Position the custom free-moving circular recording chamber beneath a 2K autofocus camera to enable continuous synchronized behavioral monitoring of the mouse.
- Construct the recording chamber using a transparent cylindrical Plexiglas container (35 cm diameter × 45 cm height).
- Mount a custom hanging plate (39.5 cm × 10.0 cm) above the chamber to support the head-mounted connector cable.
- Support the hanging plate using two vertical stands positioned on opposite sides of the chamber. Adjust the height (up to 15.5 cm) to maintain appropriate cable tension during recording.
- Place the mouse into the recording chamber. Connect the head-mounted female socket to the multichannel flexible recording tether suspended from the rotary commutator. Ensure that the tether permits unrestricted movement, turning, and feeding.
- Acclimate mice to the recording chamber for 60 min daily for 3 consecutive days before surgery. Following implantation, place the anesthetized mouse in the chamber for 30 min to allow physiological stabilization before initiating continuous recording.
- Connect the opposite end of the flexible tether to the bridge amplifier and connect the amplifier to the PowerLab 8/35 data acquisition system.
- Verify bridge amplifier balance and strain gauge zeroing as described in Step 2.9. Monitor the live signal for at least 2 min and begin recording only after confirming a stable baseline with negligible drift.
- Configure the hardware settings in LabChart data acquisition software (version 8.0) with a sampling frequency of 10 kHz and an amplification gain of 10× for the raw gastric signal channel.
- Configure the acquisition system with an input voltage range of ±5 V, a bridge excitation voltage of 5 V, and a hardware low-pass filter set to 100 Hz to minimize high-frequency noise while preserving signal fidelity.
- Turn on the 2K autofocus camera and simultaneously launch the data acquisition software on the recording computer.
- Acquire data using the data acquisition software with a dedicated acquisition template. Configure one analog channel for the raw gastric strain gauge signal and one synchronized video channel from the 2K autofocus camera. Save all recordings in the native acquisition software file format (*.adicht).
- Perform recording sessions during postoperative recovery, the transition from anesthesia to the awake state, and a 6 min feeding behavioral test consisting of a 2 min pre-prandial baseline, a 2 min feeding phase, and a 2 min post-prandial phase.
- Perform recordings between 09:00 and 15:00 on postoperative days (PODs) 1, 3, 5, 7, 10, and 15. Begin recording immediately after placing the animal in the chamber and use data acquired from 10 min onward for analysis to ensure physiological stabilization.
- Fast mice for 12 h before the feeding experiment. Record gastric motility continuously for 6 min, comprising a 2 min pre-prandial baseline, a 2 min feeding period beginning when the animal initiates feeding, and a 2 min post-prandial period.
- Exclude recordings from analysis if they meet any of the following criteria: (i) signal loss caused by connector failure or wire breakage; (ii) severe motion artifacts resulting from grooming or running that exceed the amplifier input range; or (iii) unstable signals or baseline drift greater than 20% of the baseline amplitude during a single recording session.
5. Signal Processing and Statistical Analysis
- Establish the complete hardware connection and apply the hardware and software filtering workflow to process the raw biological signals and isolate gastric motility waves from movement artifacts.
- Route the biological signals through the built-in analog low-pass filter of the bridge amplifier and data acquisition system. Set the analog low-pass filter cutoff frequency to 100 Hz to reduce high-frequency electromagnetic noise and power-line interference and generate the baseline raw data channel (Figure S1).
- Do not apply any additional hardware filters, such as high-pass, notch, or anti-aliasing filters, during data acquisition.
- Generate a smoothed analysis channel using the Smoothing module in the acquisition software (Figure S2). Select Smoothing from the channel drop-down menu, choose Triangular (Bartlett) as the smoothing type, and set the window width to 10 s (Figure S3).
NOTE: The 10 s triangular window functions as an adaptive digital low-pass filter that attenuates respiratory and movement artifacts while preserving the amplitude and rhythm of the basal murine gastric slow wave (~5 cycles/min; ~0.083 Hz). - Do not apply additional digital preprocessing steps, including baseline correction, detrending, resampling, channel offset adjustment, or signal normalization.
- Save the smoothed waveform as a new analysis channel (Channel 2) together with the raw signal (Channel 1) in the same native acquisition software file (*.adicht) without external conversion (Figures S3 and S4).
- Extract the smoothed gastric motility signals for analysis. Select stable, representative continuous 2 min recording windows for each experimental condition while minimizing movement- and behavior-related artifacts (Figure S4).
- Randomly select a continuous 2 min recording window using the synchronized video recording. Include only segments with a stable baseline and no motion artifacts, grooming behavior, or locomotor activity.
- Extract one continuous 2 min recording segment from each designated POD 1–15. Compare gastric motility waveforms recorded under deep anesthesia with those recorded in the fully conscious state.
- Standardize all recordings between 09:00 and 15:00, as described in Step 4.12, to minimize the influence of circadian variation on gastric motility.
- Analyze one continuous 6 min recording from the feeding experiment by dividing the recording into three consecutive 2 min periods representing the pre-prandial baseline, active feeding, and post-prandial phases.
- Identify feeding onset from the synchronized video recording when the animal begins sustained chewing. Define the feeding phase as the subsequent 2 min interval and exclude recordings in which feeding lasts only a few seconds.
- Quantify the average cyclic frequency (cycles/min), cyclic amplitude (µV), and area under the curve (AUC; mV·s·min−1) from the smoothed waveforms. Determine contractile frequency by peak-to-peak interval analysis and calculate the AUC by integrating the rectified contractile signal over the selected recording interval (Figure S5).
- Perform peak detection automatically using the Cyclic Measurements module in the data acquisition software Data Pad to calculate the average cyclic frequency for each selected recording segment (Figure S5).
- Define the baseline as the minimum signal voltage within the selected recording interval. Calculate the AUC automatically using the Integral Relative to Minimum function in the Data Pad module (Figure S5).
- Measure contractile amplitude automatically as the Average Cyclic Height using the Data Pad module, which calculates the average peak-to-trough height for each 2 min recording segment (Figure S5).
- Graphically summarize and statistically analyze the frequency, amplitude, and AUC data across all experimental conditions.
- Compare gastric motility parameters between the deep anesthesia and fully conscious conditions.
- Evaluate longitudinal changes in gastric motility from POD 1 through POD 15.
- Compare gastric motility parameters during the active feeding phase with those during the pre-prandial and post-prandial phases.
- Include all data that meet the predefined recording quality criteria in the statistical analysis. Do not perform statistical outlier detection or exclude observations based on statistical criteria.
- Assess data normality and homogeneity of variance before statistical analysis. Analyze normally distributed data using an ordinary one-way analysis of variance (ANOVA) or an unpaired t-test. Analyze non-normally distributed data using the Kruskal–Wallis test or the Mann–Whitney U test.
- Assess data normality using the Shapiro–Wilk test and homogeneity of variance using the Brown–Forsythe test. Analyze normally distributed data with equal variances using one-way ANOVA and analyze non-normally distributed data or data with unequal variances using the Kruskal–Wallis test.
- Perform post hoc multiple-comparison testing using Tukey’s test following one-way ANOVA or Dunn's test following the Kruskal–Wallis test, as appropriate.
- Analyze all data using GraphPad Prism version 10.0. Report data as the mean ± standard error (SE). Consider p < 0.05 statistically significant.
- Perform all statistical analyses as two-tailed tests. Consider p < 0.05 statistically significant.
- Blind the investigator responsible for data filtering and parameter extraction to the experimental groups and treatments. Anonymize and code all datasets before analysis.
- Archive all raw waveforms, processed signals, and associated metadata in the native acquisition software file format (*.adicht). Store these files and exported spreadsheets in a centralized repository to enable independent verification. Make the relevant datasets and statistical analysis files available upon reasonable academic request.
Results
Gastric Motility Under Anesthesia and Awake States
To evaluate the potential impact of anesthesia on gastric motility, gastric motility parameters were compared between anesthetized and conscious mice (n = 6; Figure 2A,B). No significant difference in frequency was observed between the anesthetized and conscious states (5.38 ± 0.13 vs. 5.48 ± 0.10 cycles min−1 [cpm], respectively; unpaired t-test: t = 0.4053, p = 0.6874). Similarly, neither the amplitude (73.88 ± 10.79 vs. 60.79 ± 3.96 µV; Mann–Whitney U test: U = 68.5, p = 0.1620) nor the area under the curve (AUC) (6.83 ± 1.26 vs. 7.47 ± 0.84 mV·s·min−1; Mann–Whitney U test: U = 102, p = 0.8437) differed significantly between the two conditions. These representative recordings demonstrate comparable gastric motility parameters under the anesthetized and conscious conditions examined.
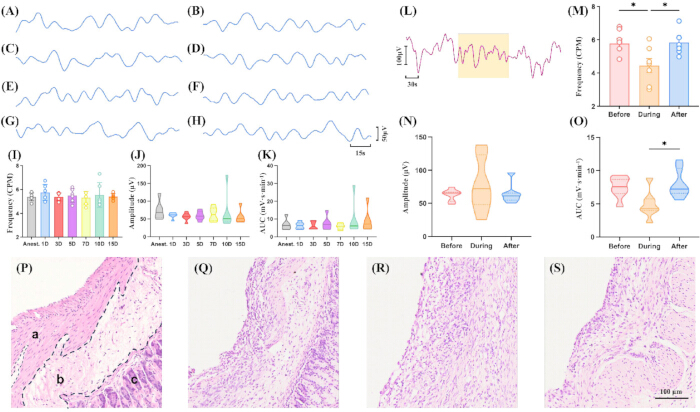
Figure 2. Representative gastric motility recordings, quantitative analysis, and stomach histology after strain gauge implantation. (A,B) Representative gastric motility traces recorded immediately after surgery under anesthesia (A) and in the awake conscious state (B) (n = 6 mice). (C–H) Representative gastric motility traces recorded during postoperative recovery on postoperative day (POD) 1 (C), POD 3 (D), POD 5 (E), POD 7 (F), POD 10 (G), and POD 15 (H). The scale bar in H applies to panels A–H: 50 µV, 15 s. (I–K) Quantification of gastric motility frequency (I; Brown-Forsythe and Welch analysis of variance with multiple comparisons, F = 0.3898, p = 0.8762), amplitude (J; Kruskal–Wallis H test, H = 3.989, p = 0.6782), and area under the curve (AUC) (K; Kruskal–Wallis H test, H = 0.8218, p = 0.9915) across longitudinal time points (n = 6 mice). (L) Representative gastric motility trace recorded before, during, and after voluntary feeding. The shaded region indicates the 2 min feeding period. Scale bar: 100 µV, 30 s. (M–O) Quantification of gastric motility frequency (M; ordinary one-way analysis of variance, F = 5.490, p = 0.0138), amplitude (N; Kruskal–Wallis H test, H = 0.3639, p = 0.8451), and AUC (O; ordinary one-way analysis of variance, F = 4.954, p = 0.0193) before, during, and after feeding (n = 7 mice). (P–S) Hematoxylin and eosin-stained stomach sections from normal control mice (P) and implanted mice on POD 7 (Q), POD 10 (R), and POD 15 (S). In panel P, a indicates the muscularis, b indicates the submucosa, and c indicates the mucosa. The 100 µm scale bar shown in panel S applies to all histology panels (P–S). Data are presented as mean ± standard error. *p < 0.05. Please click here to view a larger version of this figure.
Postoperative Gastric Motility Changes Over Time
Gastric motility was monitored in freely moving mice from POD 1 through POD 15 to evaluate postoperative stability (n = 6; Figure 2C–K). During the early postoperative phase (POD 1–3), the frequency did not differ significantly from the baseline measurement (5.76 ± 0.27 vs. 5.38 ± 0.14 cpm; Brown-Forsythe and Welch analysis of variance [ANOVA] with multiple comparisons, p = 0.9670). Likewise, no significant differences were observed in amplitude (60.41 ± 3.41 vs. 56.43 ± 4.78 µV; Kruskal–Wallis test with multiple comparisons, p > 0.9999) or AUC (6.34 ± 0.79 vs. 6.42 ± 0.92 mV·s·min−1; Kruskal–Wallis test with multiple comparisons, p > 0.9999).
During the intermediate postoperative phase (POD 5–7), the measured parameters remained stable, with no significant differences in frequency (5.49 ± 0.23 vs. 5.31 ± 0.22 cpm; p > 0.9999), amplitude (58.96 ± 5.40 vs. 63.29 ± 8.01 µV; p > 0.9999), or AUC (7.52 ± 1.59 vs. 5.78 ± 0.69 mV·s·min−1; p > 0.9999) relative to the corresponding baseline values.
During the later postoperative phase (PODs 10–15), no significant changes were observed in frequency (5.55 ± 0.42 vs. 5.41 ± 0.10 cycles/min; p > 0.9999), amplitude (69.33 ± 21.04 vs. 56.33 ± 7.95 µV; p > 0.9999), or area under the curve (AUC; 9.74 ± 3.87 vs. 9.00 ± 2.71 mV·s·min−1; p > 0.9999) compared with the corresponding baseline values. Collectively, these representative data demonstrate that the measured gastric motility parameters remained stable throughout the postoperative observation period under the conditions examined.
Gastric Motility During Food Intake
Representative gastric motility recordings were obtained during voluntary solid food intake to characterize phase-dependent changes in gastric motility (n = 7; Figure 2L–O). During active feeding, the frequency decreased significantly from the pre-prandial baseline (5.78 ± 0.30 to 4.44 ± 0.42 cpm; ordinary one-way ANOVA with multiple comparisons, p = 0.0301). In contrast, the amplitude did not differ significantly between the pre-prandial and feeding phases (62.73 ± 3.31 vs. 77.33 ± 15.32 µV; Kruskal–Wallis test with multiple comparisons, p > 0.9999). Although the AUC decreased from 7.50 ± 0.61 to 4.92 ± 0.78 mV·s·min⁻1 during feeding, the difference did not reach statistical significance (ordinary one-way ANOVA with multiple comparisons, p = 0.0611).
Following cessation of feeding, the frequency increased significantly compared with the feeding phase (5.84 ± 0.27 cpm; p = 0.0230). Likewise, the AUC increased significantly from 4.92 ± 0.78 to 8.01 ± 0.82 mV·s·min−1 (p = 0.0228). No significant difference in amplitude was observed between the feeding and post-prandial phases (77.33 ± 15.32 vs. 64.17 ± 5.65 µV; p > 0.9999). When the post-prandial phase was compared with the pre-prandial baseline, no significant differences were detected in frequency (p = 0.9908), amplitude (p > 0.9999), or AUC (p = 0.8784), indicating that the measured motility parameters returned to baseline levels during the observation period.
Gastric Histological Changes
Histological examination of stomach tissue collected on PODs 7–15 demonstrated localized inflammatory changes adjacent to the implanted strain gauge, including mild inflammatory cell infiltration, disorganized cellular architecture, and nuclear abnormalities (Figure 2P–S). No severe inflammation or extensive tissue damage was observed in the examined sections. These representative histological findings indicate localized tissue responses at the implantation site under the conditions examined.
Figure S1. Establishment of the baseline raw gastric motility recording channel. Representative screenshot of the raw gastric motility signal acquired in the data acquisition software following analog hardware filtering with a 100 Hz low-pass filter. This baseline recording channel serves as the input for subsequent digital signal processing and analysis. Please click here to download this file.
Figure S2. Generation of the smoothed analysis channel in the data acquisition software. Representative screenshot illustrating creation of a new smoothed analysis channel using the Smoothing function in the data acquisition software. The smoothed channel was generated from the raw gastric motility recording for subsequent quantitative analysis. Please click here to download this file.
Figure S3. Configuration of smoothing parameters in the data acquisition software. Representative screenshots showing the data acquisition software smoothing settings used for digital signal processing. The Triangular (Bartlett) smoothing window was selected with a 10 s window width to attenuate respiratory and movement artifacts while preserving the physiological gastric slow-wave rhythm. Please click here to download this file.
Figure S4. Selection of representative recording windows for quantitative analysis. Representative example demonstrating selection of a stable 2 min continuous recording segment (gray shaded region) from the smoothed gastric motility trace for quantitative analysis. Recording windows were selected to minimize movement- and behavior-related artifacts before calculating gastric motility parameters. Please click here to download this file.
Figure S5. Quantification of gastric motility parameters from the smoothed waveform. Representative screenshots of the data acquisition software Data Pad and analysis interface used to quantify the primary gastric motility parameters. Average cyclic frequency (cycles/min), average cyclic amplitude (µV), and integrated area under the curve (AUC; mV·s·min⁻1) were calculated from the selected smoothed recording segments. Please click here to download this file.
Discussion
This refined protocol provides a stable, biocompatible, and reproducible approach for long-term gastric motility recording in freely moving mice. A critical step is the fabrication of the silicone strain gauge18, which yields an optimized device (overall dimensions: ~6.0 mm × 8.0 mm; functional area: ~5.0 mm × 5.0 mm) that fits the murine gastric antrum while minimizing interference with the pylorus and fundus19. Compared with conventional rigid devices, encapsulation with 704 silicone rubber provides superior mechanical compliance and elasticity (elongation at break ≥ 140%), allowing the sensor to accommodate gastric distension during physiological feeding while reducing the likelihood of device fracture or movement restriction. Furthermore, the smooth silicone encapsulation is expected to reduce tissue adhesion around the implant, thereby helping to preserve signal quality during longitudinal recordings. Although a systematic quantitative assessment of postoperative adhesion formation and long-term mechanical performance was beyond the scope of this study, the chronic recordings demonstrated stable signal quality and sustained sensor sensitivity for up to 15 days after implantation. The thin, smooth silicone coating also serves as a protective barrier that may help reduce excessive tissue adhesion. Nevertheless, further long-term validation using quantitative adhesion scoring and dedicated mechanical performance testing will be important to fully characterize chronic device performance. Finally, integrating a head-mounted connector with the silicone strain gauge minimizes cable twisting and chewing-related damage, thereby facilitating long-term gastric motility recording in freely moving animals.
A key modification of this protocol is that mice retain ad libitum access to food until anesthesia induction. Unlike conventional gastrointestinal surgical protocols, preoperative fasting is omitted because gastric distension resulting from normal food intake facilitates visualization of the gastric serosal surface and may reduce the risk of inadvertent mucosal penetration during placement of the 7-0 serosal sutures16,19. In contrast, gastric collapse induced by prolonged fasting increases tissue redundancy, which can complicate accurate suture placement. For subsequent motility recording sessions, however, a standardized 12 h fasting period is implemented before baseline recordings to minimize postprandial variability16,19.
Another important procedural modification is the selection of the anesthetic regimen. Although inhalation anesthesia is widely used in rodent surgery20,21, the dual-site surgical procedure described herein requires repeated repositioning of the animal and unobstructed access to the cranial surgical field for head-mounted connector placement. Data acquisition also relies on a lightweight tether connected to a customized recording chamber (Figure 1M), which may restrict animal movement compared with an unrestricted home-cage environment. Meile et al. developed a wireless strain gauge telemetry system capable of recording gastrointestinal motility in freely moving rats22. However, the dimensions and weight of that telemetry device are not readily compatible with adult C57BL/6J mice, limiting its direct application in this model. Consequently, the wired configuration described here represents a practical approach for long-term gastric motility recording in mice while maintaining continuous signal acquisition. Under these conditions, intraperitoneal administration of 1.25% tribromoethanol provides unobstructed surgical access throughout the procedure. The use of 1.25% tribromoethanol is supported by its rapid induction, reliable surgical anesthesia, and excellent muscle relaxation required for microsuturing. To ensure chemical stability and minimize degradation, a commercially prepared working solution was used and stored at 4°C protected from light. Although tribromoethanol may induce transient gastrointestinal inhibition or tissue irritation if prepared or handled improperly, recent studies have demonstrated its efficacy and safety when used under appropriate quality-control procedures23. Consistent with these reports, no adverse events, including postoperative ileus or peritonitis, were observed during the present study.
The present protocol has several limitations. First, although representative histological evaluation demonstrated localized postoperative tissue changes, the current study did not include quantitative assessment of inflammatory responses or postoperative adhesions. This protocol was developed primarily as a methodological guide for reproducible device fabrication and precise anatomical implantation rather than as a comprehensive pathological evaluation. Accordingly, semiquantitative histological scoring, blinded pathological assessment, and quantitative evaluation of postoperative adhesions were beyond the scope of the present study. Nevertheless, the representative hematoxylin and eosin-stained sections demonstrated mild, localized tissue changes confined to the serosal surface, with no evidence of extensive tissue damage in the examined sections. Future studies incorporating quantitative histological analyses and standardized adhesion scoring will provide a more comprehensive evaluation of long-term tissue responses.
Finally, the current validation focused primarily on gastric motility recordings and histological observations. Complementary physiological assessments, including gastric emptying, whole-gut transit time, and fecal pellet output, were beyond the scope of this initial validation study. Although these measures would provide a more comprehensive evaluation of gastrointestinal function, the stable and rhythmic gastric contractility patterns observed throughout the postoperative recording period suggest that the implantation procedure maintained reliable gastric motility recordings under the conditions examined. Nevertheless, comprehensive assessment of overall gastrointestinal function using these complementary physiological assays remains an important direction for future validation of this chronic recording approach.
Despite these limitations, the protocol expands the experimental toolkit available for long-term assessment of gastric motility in conscious mice. The observed basal gastric frequencies are consistent with values previously reported using extraluminal force transducers19 and serosal electrophysiological recordings10, and the representative feeding-associated changes are consistent with previously described physiological responses in mammalian models. Nevertheless, the absolute values of signal amplitude and AUC remain dependent on experimental variables, including sensor fabrication, amplification settings, and surgical implantation conditions, and therefore should be interpreted within the context of each experimental setup. This protocol may be useful for longitudinal studies of gastric physiology and disease, including models of functional dyspepsia, diabetic gastroparesis, and postoperative ileus, and may facilitate evaluation of therapeutic interventions under conscious recording conditions.
Disclosures
The authors declare that they have no known competing financial interests or personal relationships that could have appeared to influence the work reported in this paper.
Acknowledgements
The authors would like to acknowledge the assistance of Yikuan Xie from the Institute of Basic Medical Sciences, Chinese Academy of Medical Sciences, for contributions to strain gauge preparation and the optimization of the experimental procedures. This work was supported by the Fundamental Research Funds for the Central Public Welfare Research Institutes (ZZ-JQ2023002), the Scientific and Technological Innovation Project of the China Academy of Chinese Medical Sciences (CI2026A03401), and the National Natural Science Foundation of China (82174281 and 82230123).
Materials
| Name | Company | Catalog Number | Comments |
|---|---|---|---|
| 1% Povidone-Iodine Solution | Jiangmen Hengjian Pharmaceutical Co., Ltd., Guangdong, China | 500 mL | Skin disinfection |
| 1.25% Ready-to-Use Tribromoethanol Solution | Nanjing Aibei Biotechnology Co., Ltd., Jiangsu, China | M2910 | Used directly without further preparation or dilution. |
| 2K Auto-focus Camera | Shenzhen Lvlian Technology Co., Ltd., Guangdong, China | CM717-25442 | Behavioral monitoring |
| 3% Hydrogen Peroxide Solution | Lircon Medical Technology Co., Ltd., Shandong, China | 100 mL | Skull preparation |
| 6-0 Absorbable Sutures with Needle | Jinhuan Medical Products Co., Ltd., Shanghai, China | R611 | Abdominal muscle and skin closure |
| 7-0 Non-absorbable Sutures | Ningbo Chenghe Microscopic Instrument Factory, Zhejiang, China | 45/35 | Strain gauge fixation |
| 75% Ethanol | Lircon Medical Technology Co., Ltd., Shandong, China | 500 mL | Instrument and device disinfection |
| Acid-free Soldering Flux | Prokit's Industries Co., Ltd., Shanghai, China | 8S005 | Electrical assembly |
| Animal Mini Arco Cordless Trimmer | AUX Group Co., Ltd., Zhejiang, China | C6S | Hair removal |
| Basing Resin | YAMAHACHI Dental Material Co., Ltd., Jiangsu, China | LSBR-NPS | Skull fixation of the head-mounted connector |
| Circular Free-moving Recording Chamber | Beijing Xin Hang Xing Ye Technology Trading Co., Ltd., Beijing, China | Custom-built | Transparent cylindrical Plexiglas container (35 cm diameter × 45 cm height) equipped with a custom top hanging plate (39.5 cm × 10.0 cm) and two height-adjustable support stands (up to 15.5 cm) for suspending the head-mounted connector cable. |
| Custom Strain Gauge (350 Ω) | Yiyang Heshan District Guangce Electronics Co., Ltd., Hunan, China | Custom | Base: 3.6 mm × 3.0 mm; grid: 2.0 mm × 1.0 mm; thickness: 0.06 mm |
| Delicate Scissors | RWD Life Science Co., Ltd., Guangdong, China | S12003-09 | Surgical scissors |
| Disposable Micro-applicator | Ouwen Medical Device Technology Co., Ltd., Guangdong, China | Small | Silicone application |
| Feedback-controlled Electric Heating Blanket | Nanjing Xin Xiao Yuan Biotech, Jiangsu, China | H-KWDY-III | Maintenance of body temperature during surgery |
| GraphPad Prism | GraphPad Software, LLC, MA, USA | Version 10.0 | Statistical analysis |
| Head-mounted Connector | Beijing Xin Hang Xing Ye Technology Trading Co., Ltd., Beijing, China | Custom-built | Custom 2 × 3 pin header for mouse headstage mounting; 1.27 mm pin pitch, 0.44 mm pin diameter, 4.90 ± 0.25 mm terminal tail spacing; dimensions: 4.88 mm × 3.25 mm × 5.32 mm (L × W × H); insulator height: 3.80 mm. |
| Iris Dissecting Forceps | RWD Life Science Co., Ltd., Guangdong, China | F12006-10 | Tissue dissection |
| LabChart Professional Software | ADInstruments Ltd., New South Wales, Australia | Version 8.0 | Data acquisition and signal processing |
| Meloxicam Injection | Qilu Animal Health Products Co., Ltd., Shandong, China | 20 mL | Postoperative analgesia |
| Needle Holders | RWD Life Science Co., Ltd., Guangdong, China | F31047-12 | Surgical suturing |
| Petrolatum Ophthalmic Ointment | Dechra Pharmaceuticals PLC, Northwich, UK | 17033-211-38 | Corneal protection during anesthesia |
| PowerLab 8/35 | ADInstruments Ltd., New South Wales, Australia | PL3508 | Data acquisition system |
| Quad Bridge Amplifier | ADInstruments Ltd., New South Wales, Australia | FE224 | Signal amplification |
| Silicone Rubber (704 RTV) | Liyang Kangda Co., Ltd., Jiangsu, China | 704 RTV | Strain gauge encapsulation |
| Sodium Chloride Physiological Solution (0.9%) | BBCA Pharmaceutical Co., Ltd., Anhui, China | 500 mL | Device rinsing and tissue hydration |
| Solder | SANKI, Japan | Resin-cored, 0.5 mm diameter, 60/40 | Electrical assembly |
| Soldering Iron | HAKKO Corp., Osaka, Japan | FX888D-06BY | Electrical assembly |
| Standard Chow | SPF (Beijing) Biotechnology Co., Ltd., Beijing, China | SPF-F02-001 | Animal diet |
| Sterile Protective Membrane for Surgical Incisions | Shanghai Sea Pure Biological Science and Technology Co., Ltd., Shanghai, China | SPU12 (10 cm × 12 cm) | Sterile surgical drape |
| Strain Gauge Sensor Zero Setting Box | Beijing Xin Hang Xing Ye Technology Trading Co., Ltd., Beijing, China | Custom-built | Custom balancing box incorporating a 350 Ω resistor circuit matched to the Wheatstone bridge. |
| Wild-type C57BL/6J Mice | Vital River Laboratory Animal Technology Co., Ltd., Beijing, China | SCXK (Beijing) 2021-0011 | Male; 8 weeks old; 25 ± 3 g |
References
- Goyal RK, Guo Y, Mashimo H. Advances in the physiology of gastric emptying. Neurogastroenterol Motil. 2019;31(4):e13546.
- Febo-Rodriguez L, Chumpitazi BP, Sher AC, Shulman RJ. Gastric accommodation: Physiology, diagnostic modalities, clinical relevance, and therapies. Neurogastroenterol Motil. 2021;33(12):e14213.
- Servin-Vences MR, et al. PIEZO2 in somatosensory neurons controls gastrointestinal transit. Cell. 2023;186(16):3386-3399.e15.
- Jin M, et al. Cell membrane-functionalized bismuth oxyiodide nanodots as potential contrast agents for gastrointestinal tract imaging. Colloids Surf B Biointerfaces. 2025;245:114235.
- Xiao A, et al. H2S, a novel gasotransmitter, is involved in gastric accommodation. Sci Rep. 2015;5:16086.
- Adelson DW, et al. Coordinated gastric and sphincter motility evoked by intravenous CCK-8 as monitored by ultrasonomicrometry in rats. Am J Physiol Gastrointest Liver Physiol. 2004;286(2):G321-G332.
- Ataka K, et al. Wood creosote prevents corticotropin-releasing factor-induced motility via 5-HT3 receptors in the proximal colon and 5-HT4 receptors in the distal colon in rats. Auton Neurosci. 2007;133(2):136-145.
- Chen CY, et al. Des-acyl ghrelin acts via corticotropin-releasing factor type 2 receptors to disrupt fasted stomach motility in conscious rats. Gastroenterology. 2005;129(1):8-25.
- Fujino K, et al. Ghrelin induces fasted motor activity of the gastrointestinal tract in conscious fed rats. J Physiol. 2003;550(Pt 1):227-240.
- Wang H, et al. Establishment of a radiotelemetric recording technique in mice to investigate gastric slow waves: Modulatory role of putative neurotransmitter systems. Exp Physiol. 2018;103(6):827-837.
- Yin J, Chen JD. Electrogastrography: Methodology, validation and applications. J Neurogastroenterol Motil. 2013;19(1):5-17.
- Rhee PL, et al. Analysis of pacemaker activity in the human stomach. J Physiol. 2011;589(Pt 24):6105-6118.
- Hasler WL, Soudah HC, Dulai G, Owyang C. Mediation of hyperglycemia-evoked gastric slow-wave dysrhythmias by endogenous prostaglandins. Gastroenterology. 1995;108(3):727-736.
- Coleski R, Gonlachanvit S, Owyang C, Hasler WL. Selective reversal of hyperglycemia-evoked gastric myoelectric dysrhythmias by nitrergic stimulation in healthy humans. J Pharmacol Exp Ther. 2005;312(1):103-111.
- Zhou L, Ke MY. Textbook of Gastrointestinal Motility: Basic and Clinical Aspects. Science Press; Beijing, China; 1991:262-278.
- Holmes GM, Swartz EM, McLean MS. Fabrication and implantation of miniature dual-element strain gauges for measuring in vivo gastrointestinal contractions in rodents. J Vis Exp. 2014;(91):51739.
- Chen QC, et al. Xiangbinfang granules enhance gastric antrum motility via intramuscular interstitial cells of Cajal in mice. World J Gastroenterol. 2021;27(7):576-591.
- Wang SY, Xie Y, Zhu B, Chen X; China Academy of Chinese Medical Sciences, assignee. Silicone strain gauge and physiological signal acquisition apparatus for animal hollow visceral organs. China Utility Model Patent CN221533769U. 2024.
- Zheng J, et al. Ghrelin regulates gastric phase III-like contractions in freely moving conscious mice. Neurogastroenterol Motil. 2009;21(1):78-84.
- Hüske C, et al. Towards optimized anesthesia protocols for stereotactic surgery in rats: Analgesic, stress and general health effects of injectable anesthetics. A comparison of a recommended complete reversal anesthesia with traditional chloral hydrate monoanesthesia. Brain Res. 2016;1642:364-375.
- Callahan LM, Ross SM, Jones ML, Musk GC. Mortality associated with using medetomidine and ketamine for general anesthesia in pregnant and nonpregnant Wistar rats. Lab Anim (N Y). 2014;43(6):208-214.
- Meile T, Zieker D, Königsrainer A, Glatzle J. New telemetry device for the measurement of gastrointestinal motility in rats and comparison with standard equipment. Int Surg. 2015;100(4):755-760.
- Black C, et al. Revisiting tribromoethanol as a safe and effective murine anesthetic for veterinary clinical and biomedical research. Vet Immunol Immunopathol. 2025;282:110909.