This study investigates the relationship between systemic lupus erythematosus and recurrent pregnancy loss and identifies IFI27 as a candidate biomarker for future investigation.
Research Article
Mendelian Randomization and Bioinformatics Identify IFI27 as a Candidate Biomarker for Recurrent Pregnancy Loss in Systemic Lupus Erythematosus
* These authors contributed equally
In This Article
Summary
Abstract
Systemic lupus erythematosus (SLE) is associated with adverse pregnancy outcomes, but its causal relationship with recurrent pregnancy loss (RPL) and their shared molecular characteristics remain unclear. This study integrated bidirectional two-sample Mendelian randomization (MR) and transcriptomic bioinformatics analyses to investigate this relationship and identify candidate shared biomarkers. FinnGen and UK Biobank were selected because they provide large, non-overlapping, European-ancestry genome-wide association study (GWAS) summary statistics. Differentially expressed genes (DEGs) were identified from GSE61635 (blood; |log₂ fold change| > 1) and GSE165004 (endometrium; |log₂ fold change| > 0.5) using an adjusted P < 0.05, followed by functional enrichment, protein–protein interaction (PPI) analysis, hub-gene screening, least absolute shrinkage and selection operator (LASSO) regression, external validation using GSE50772 and GSE198700, receiver operating characteristic (ROC) analysis, and single-sample gene set enrichment analysis (ssGSEA). Genetically predicted SLE was associated with a statistically significant but quantitatively modest increase in spontaneous miscarriages (inverse-variance weighted [IVW] odds ratio [OR] = 1.01, 95% confidence interval [CI] = 1.00–1.02; P < 0.001). Instrument strength was adequate, and sensitivity analyses detected no material heterogeneity, directional pleiotropy, or influential single variant. Fifty-nine shared DEGs were enriched in antiviral immune responses, cell adhesion, and apoptosis-related processes. IFI27 was consistently overexpressed in SLE blood but underexpressed in RPL endometrium and chorionic villi, whereas CXCL11 lacked consistent external validation. Retrospective ROC analyses yielded areas under the curve (AUCs) of 0.822 for SLE and 0.872 for RPL. Computationally inferred ssGSEA scores showed correlations between IFI27 expression and several immune-cell signatures, including T helper 2 (Th2) cells. These findings identify IFI27 as a candidate biomarker shared by SLE and RPL; however, prospective clinical and experimental studies are required to validate its biological and clinical significance.
Introduction
Systemic lupus erythematosus (SLE) is a complex autoimmune disease characterized by multisystem involvement and chronic immune dysregulation1. The pathological abnormalities in SLE are primarily attributed to impaired adaptive immune responses and the deposition of antigen–antibody complexes, leading to autoimmune-mediated tissue injury and organ damage2,3. The global incidence of SLE is approximately 5.14 (1.4–15.13) cases per 100,000 person-years, with an estimated incidence of 8.82 (2.4–25.99) cases per 100,000 person-years among women4. SLE affects individuals of all ages but predominantly occurs in women of reproductive age5,6. Pregnant patients with SLE are at increased risk of adverse pregnancy outcomes, including recurrent miscarriage, stillbirth, preterm birth, and intrauterine growth restriction7,8. Recurrent pregnancy loss (RPL) is defined as two or more miscarriages before 20–24 weeks of gestation9. Its reported prevalence is approximately 2.6%10, making it a clinically significant reproductive complication. Approximately 20% of pregnant patients with SLE experience miscarriage11, and SLE is recognized as an important risk factor for RPL12. Proposed mechanisms include hormonal alterations and immune dysregulation. Biomarkers such as anticardiolipin antibodies and lupus anticoagulant have been investigated as potential predictors of adverse pregnancy outcomes in patients with SLE11. These autoantibodies may bind placental trophoblast cells, alter trophoblast signaling, proliferation, and invasion, modulate hormone and cytokine secretion, and increase apoptosis, thereby contributing to impaired pregnancy outcomes13. In addition, beta-2 glycoprotein I (β2-GPI), a major antigen in antiphospholipid syndrome, is expressed in placental tissue. Binding of anti-β2-GPI antibodies to β2-GPI inhibits trophoblast growth and differentiation, resulting in placental defects. This interaction also promotes a pro-inflammatory environment characterized by destructive cytokine production and complement activation, contributing to placental thrombosis and recurrent miscarriage14,15. However, previous studies have often lacked comprehensive analyses of local reproductive tissues, such as the decidua, limiting the ability to correlate systemic biomarkers with local pathological changes. Furthermore, the management of pregnancy complicated by SLE and the prevention of adverse pregnancy outcomes remain challenging. Genetic susceptibility contributes to the development of SLE, and genetic variation has also been implicated in the pathogenesis of RPL16,17. Nevertheless, whether a causal relationship exists between SLE and RPL, as well as the molecular mechanisms and shared genes underlying their coexistence, remains unclear.
Mendelian randomization (MR) is an established approach for causal inference that uses genetic variants as instrumental variables to estimate the causal effects of exposures on disease outcomes18. By exploiting the relationship between genotype and phenotype, MR reduces bias from confounding and reverse causation compared with conventional observational studies. In parallel, advances in genomic microarray platforms and high-throughput sequencing have enabled bioinformatics analyses to identify candidate diagnostic biomarkers and therapeutic targets through transcriptomic profiling. Integrating these complementary approaches may provide a more comprehensive understanding of the relationship between SLE and RPL by combining causal genetic evidence with disease-associated gene-expression patterns. Therefore, this study aimed to investigate the potential causal relationship between SLE and RPL, identify shared candidate biomarkers and biological pathways, and prioritize targets for future validation. To achieve these objectives, the analytical workflow was prespecified as follows: bidirectional MR to evaluate causal direction; independent differential gene expression analyses followed by transcriptomic integration; protein–protein interaction (PPI) network analysis and least absolute shrinkage and selection operator (LASSO) regression for biomarker prioritization; external expression validation and receiver operating characteristic (ROC) analysis; and single-sample gene set enrichment analysis (ssGSEA) to evaluate associations with immune-cell signatures. This stepwise workflow is summarized in Figure 1.
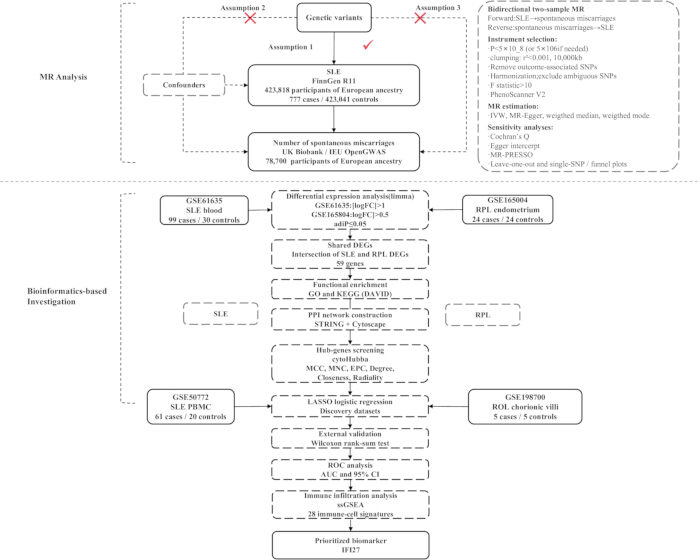
Figure 1. Study design and analytical workflow.
The upper panel illustrates the bidirectional two-sample Mendelian randomization (MR) analysis evaluating the association between systemic lupus erythematosus (SLE) and the number of spontaneous miscarriages using genome-wide association study (GWAS) summary statistics. Instrument selection, linkage disequilibrium clumping, Mendelian randomization (MR) analyses, and sensitivity analyses are summarized. The lower panel outlines the bioinformatics workflow, including differential expression analysis, identification of shared differentially expressed genes (DEGs), functional enrichment analysis, protein–protein interaction (PPI) network construction, hub-gene screening, least absolute shrinkage and selection operator (LASSO) regression, external validation, receiver operating characteristic (ROC) analysis, single-sample gene set enrichment analysis (ssGSEA), and prioritization of the candidate biomarker IFI27. IVW, inverse-variance weighted; KEGG, Kyoto Encyclopedia of Genes and Genomes; GO, Gene Ontology. Please click here to view a larger version of this figure.
Protocol
Ethical approval was not required for the present study because it involved only secondary analyses of publicly available, de-identified genome-wide association study (GWAS) summary statistics and transcriptomic datasets. No new participants were recruited, no biological specimens were collected, and no individual-level identifiable information was accessed. The original FinnGen, UK Biobank, and Gene Expression Omnibus studies reported that ethical approval and informed consent had been obtained in accordance with their respective institutional, national, and database-specific requirements. All datasets used in the present study were accessed and analyzed in accordance with the applicable database usage policies, data-access conditions, and ethical guidelines. The authors did not attempt to re-identify any participant. Additional written informed consent was therefore not required for this secondary analysis. The content of this study includes two parts: MR analysis and bioinformatics analysis (Figure 1). This study was entirely computational and used publicly available summary-level GWAS and transcriptomic datasets. No wet-laboratory reagents or consumables were used.
MR analysis
Data sources, acquisition, and preprocessing of GWAS summary statistics:
The GWAS summary statistics for lupus erythematosus were obtained from FinnGen Release 11 (finngen_R11_L12_LUPUS; RRID:SCR_022254), a population-based Finnish cohort. The phenotype was defined using ICD-10 code L93 and included 423,818 participants, comprising 777 cases and 423,041 controls. The FinnGen summary-statistics file was downloaded from the FinnGen public data portal in compressed tab-delimited format and imported into R using the read_exposure_data() or read_outcome_data() function in TwoSampleMR, depending on whether the dataset was used as the exposure or outcome. The rsID, chromosome, genomic position, effect allele, other allele, effect-allele frequency, beta coefficient, standard error, and association P value were retained.
Summary statistics for the number of spontaneous miscarriages were obtained from the UK Biobank through the IEU OpenGWAS resource (ukb-b-419; RRID:SCR_012815), comprising 78,700 participants. In the forward analysis, associations of the selected FinnGen single-nucleotide polymorphisms (SNPs) with the outcome were retrieved using extract_outcome_data(outcomes = "ukb-b-419", proxies = FALSE). In the reverse analysis, SNPs associated with lupus erythematosus were retrieved using extract_instruments(outcomes = "finngen_R11_L12_LUPUS", clump = FALSE), after which the corresponding SNP associations were extracted from the UK Biobank summary-statistics file. The characteristics of the GWAS datasets used in the bidirectional MR analyses are summarized in Table 1.
| Trait | Sample size | Ancestry | Consortium | Year | GWAS dataset identifier |
| Lupus erythematosus | 4,23,818 | European | FinnGen (RRID: SCR_022254) | 2024 | finngen_R11_L12_LUPUS |
| Number of spontaneous miscarriages | 78,700 | European | UK Biobank (RRID: SCR_012815) | 2018 | ukb-b-419 |
Table 1: Genome-wide association study (GWAS) summary statistics used for the bidirectional Mendelian randomization analysis.
The table summarizes the publicly available genome-wide association study datasets used as the exposure and outcome sources for the forward and reverse Mendelian randomization analyses, including sample size, ancestry, data source, year of data release, and dataset identifier.
FinnGen and UK Biobank were selected because they provide large, publicly accessible, predominantly European-ancestry datasets derived from non-overlapping source populations and contain sufficient variant coverage for two-sample MR. No overlap between the exposure and outcome samples was reported. Because only summary-level data were used, no individual-level genotype data were accessed, no additional participant-level normalization was performed, and no participants were excluded by the present investigators. We relied on the sample-level and variant-level quality-control procedures implemented by the original GWAS consortia. During the present analysis, additional quality control was performed at the variant level through significance filtering, linkage disequilibrium clumping, allele harmonization, instrument-strength assessment, and pleiotropy screening, as described below.
FinnGen Release 11 reports genomic positions according to GRCh38/hg38, whereas the IEU OpenGWAS harmonized datasets and the linkage disequilibrium reference resource use GRCh37-compatible variant annotations. Therefore, exposure and outcome variants were matched primarily by stable rsIDs rather than chromosome-position coordinates. No direct cross-build positional matching was performed. Variants without an unambiguous rsID or with inconsistent allele information across datasets were excluded before MR analysis. FinnGen Release 11 summary statistics use GRCh38, whereas OpenGWAS data are harmonized to the reference sequence convention used for Build 37. Matching by rsID is therefore important when the two resources are combined.
Study design of MR:
We strictly adhered to the STROBE-MR guidelines (Supplementary File 1)19. A bidirectional two-sample MR design was used to evaluate the relationship between genetically predicted lupus erythematosus and the number of spontaneous miscarriages. In the forward analysis, lupus erythematosus was treated as the exposure and the number of spontaneous miscarriages as the outcome. In the reverse analysis, the exposure and outcome were exchanged, and the complete instrument-selection, linkage disequilibrium clumping, data-harmonization, causal-estimation, and sensitivity-analysis workflow was repeated. Single-nucleotide polymorphisms (SNPs) were used as instrumental variables (IVs). The complete workflow was performed in the following order: acquisition and formatting of the GWAS summary statistics; selection of exposure-associated SNPs; removal of duplicated or incompletely annotated variants; linkage disequilibrium clumping; extraction of the corresponding outcome associations; exclusion of SNPs directly associated with the outcome; harmonization of exposure and outcome alleles; calculation of instrument strength; screening for potential confounding phenotypes; estimation of causal effects; assessment of heterogeneity and horizontal pleiotropy; Mendelian Randomization Pleiotropy RESidual Sum and Outlier (MR-PRESSO) outlier detection; and leave-one-out and single-SNP sensitivity analyses. All MR analyses were implemented using R version 4.4.2 (RRID:SCR_001905), TwoSampleMR version 0.6.6 (RRID:SCR_019010), MRPRESSO version 1.0 (RRID:SCR_023697), and forestploter version 1.1.2. The MR analysis was based on three core assumptions. First, according to the relevance assumption, the selected SNPs must be strongly associated with the exposure. Second, according to the independence assumption, the selected SNPs must be independent of factors that confound the exposure–outcome association. Third, according to the exclusion-restriction assumption, the selected SNPs must influence the outcome only through the exposure20 (Figure 1).
SNP selection methods:
Instrument selection was performed in the following order: (1) select exposure-associated SNPs at P < 5 × 10⁻⁸; when the number of instruments was insufficient, use P < 5 × 10⁻⁶; (2) use the clump_data() function to perform linkage disequilibrium clumping at R2 < 0.001 and a genetic distance of 10,000 kb, relaxing the criteria to R2 < 0.01 within 5,000 kb only when necessary to retain an analyzable instrument set; (3) filter out SNPs significantly associated with the outcome using a threshold of P = 5 × 10⁻⁵; (4) use the harmonise_data() function to harmonize exposure and outcome alleles and exclude palindromic or otherwise ambiguous variants; (5) calculate instrument strength as F = β2/SE2, and exclude SNPs with F < 10; and (6) screen the retained SNPs in PhenoScanner V2 for phenotypes that could confound the SLE–pregnancy loss relationship21. Antiphospholipid antibodies (aPL) may be a shared risk factor for SLE and the number of spontaneous miscarriages. Individual SNPs were searched in PhenoScanner V2. All candidate SNPs were queried in PhenoScanner V2 using the default GWAS catalogue to retrieve all reported genome-wide association study (GWAS) associations. The significance threshold was set at P < 1 × 10⁻5, and the default reference genome build (GRCh37) was used. Because the study population was of European ancestry, proxy variant searching was enabled using the European reference panel (proxies = "EUR"), with an LD threshold of R2 > 0.8 within a 1,000-kb window. All other search parameters were retained at their default settings. SNPs showing significant associations with the pre-specified confounding factor, antiphospholipid antibodies (aPL), were considered potentially pleiotropic and were excluded from the final instrumental variable set to minimize violation of the Mendelian randomization exclusion restriction assumption. The instrumental SNPs retained for the forward and reverse MR analyses are listed in Supplementary Tables 1 and 2, respectively.
Statistical analysis:
After instrument selection and allele harmonization, causal estimates were calculated using the mr() function in TwoSampleMR. The analytical workflow was performed in the following order. First, the overall causal effect was estimated using four MR methods: inverse-variance weighting (IVW), MR-Egger regression, the weighted median, and the weighted mode. Effect estimates for the number of spontaneous miscarriages and SLE were reported as odds ratios with corresponding 95% confidence intervals and P values. The IVW method was designated as the primary analysis because it provides high statistical power when all included SNPs are valid instrumental variables and horizontal pleiotropy is absent. However, the IVW estimate may be biased when horizontal pleiotropy is present22. MR-Egger regression was primarily used to evaluate causal inferences in the presence of potential horizontal pleiotropy23. The weighted median approach requires that at least 50% of the analytical weight originates from valid IVs. This method is optimal when heterogeneity is present but horizontal pleiotropy is absent24. The weighted mode identifies clusters of instrumental variables with similar causal effects and estimates the effect from the largest cluster25. The effect estimates obtained using the four MR methods are presented in Figure 2. Second, heterogeneity among the SNP-specific causal estimates was evaluated using Cochran's Q test implemented through the mr_heterogeneity() function. The Q statistic represents the weighted sum of the squared deviations of the individual SNP estimates from the overall causal estimate. A Q-test P value < 0.05 was considered evidence of heterogeneity, in which case a random-effects IVW model was applied. In the absence of significant heterogeneity, a fixed-effects IVW model was used26. Third, directional horizontal pleiotropy was assessed using the MR-Egger intercept test implemented with the mr_pleiotropy_test() function. An intercept significantly different from zero at P < 0.05 was considered evidence of directional horizontal pleiotropy. Fourth, the MR-PRESSO procedure was performed using the mr_presso() function in the MRPRESSO package (RRID:SCR_023697) to detect SNPs with outlying pleiotropic effects27. When outliers were detected, they were removed and the causal analysis was repeated using the remaining instruments. The MR-PRESSO global test was used to assess overall horizontal pleiotropy, and the distortion test was considered when evaluating whether outlier removal materially changed the causal estimate. Fifth, leave-one-out sensitivity analysis was performed using the mr_leaveoneout() function. In this analysis, each SNP was sequentially excluded, and the pooled causal estimate was recalculated using the remaining SNPs. The results were visualized using mr_leaveoneout_plot() to determine whether the overall association was disproportionately driven by a single instrument. Sixth, individual SNP-specific estimates were generated using the mr_singlesnp() function. These estimates were used to construct funnel plots with mr_funnel_plot() to visually assess asymmetry potentially attributable to directional horizontal pleiotropy. Summary forest plots were generated using forestploter (version 1.1.2) to display the effect estimates and confidence intervals obtained from the different MR methods. The forward MR scatter plot, SNP-specific forest plot, leave-one-out analysis, and funnel plot are presented in Supplementary Figures 1–4, respectively.
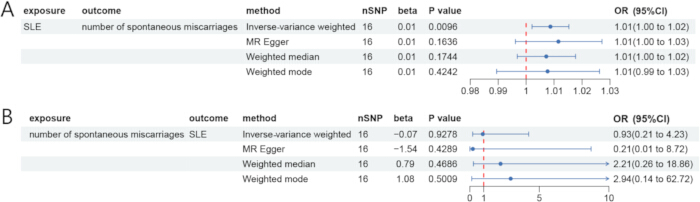
Figure 2. Results of the bidirectional Mendelian randomization analysis.
(A) Forest plot of the forward Mendelian randomization (MR) analysis with systemic lupus erythematosus (SLE) as the exposure and the number of spontaneous miscarriages as the outcome. (B) Forest plot of the reverse MR analysis with the number of spontaneous miscarriages as the exposure and SLE as the outcome. Effect estimates are presented as odds ratios (ORs) with 95% confidence intervals (CIs) for the inverse-variance weighted, MR-Egger, weighted median, and weighted mode methods. SNP, single-nucleotide polymorphism. Please click here to view a larger version of this figure.
A causal association was considered supported when the IVW estimate was statistically significant at P < 0.05, the MR-Egger, weighted median, and weighted mode estimates showed directions consistent with the IVW estimate, and the findings were not materially altered by heterogeneity, pleiotropy, MR-PRESSO, or leave-one-out sensitivity analyses. All statistical tests were two-sided.
Bioinformatics analysis
Microarray data:
The transcriptomic datasets were obtained from the Gene Expression Omnibus (GEO; RRID:SCR_005012) database28. The processed Series Matrix files, sample metadata, and platform annotation files were downloaded for GSE61635, GSE165004, GSE50772, and GSE198700. The platform, tissue source, sample size, and analysis category of each dataset are summarized in Table 2. Because the datasets were generated from different tissues and microarray platforms, each dataset was preprocessed and analyzed independently. Expression matrices from different datasets were not directly merged, and no cross-platform batch correction was applied. Cross-dataset integration was performed at the gene-symbol level only after differential expression analysis had been completed independently within each discovery dataset.
| GEO dataset | Disease | Platform | Tissue (Homo sapiens) | Cases | Controls | Experiment type | Contributor | Dataset category |
| GSE61635 | Systemic lupus erythematosus (SLE) | GPL570 | Whole blood | 99 | 30 | Expression microarray | Greidinger EL | Discovery dataset |
| GSE165004 | Recurrent pregnancy loss (RPL) | GPL16699 | Endometrium | 24 | 24 | Expression microarray | Keleş ID29 | Discovery dataset |
| GSE50772 | Systemic lupus erythematosus (SLE) | GPL570 | Peripheral blood mononuclear cells (PBMCs) | 61 | 20 | Expression microarray | Kennedy WP30 | Validation dataset |
| GSE198700 | Recurrent pregnancy loss (RPL) | GPL13534 | Chorionic villi | 5 | 5 | Expression microarray | Li Y31 | Validation dataset |
Table 2: Transcriptomic datasets used for the bioinformatics analyses.
The table summarizes the Gene Expression Omnibus (GEO) transcriptomic datasets included in the discovery and validation analyses, including disease, microarray platform, tissue source, sample size, experiment type, original study contributor, and dataset category.
GSE61635 was generated using the Affymetrix Human Genome U133 Plus 2.0 Array platform (GPL570) and comprised 99 whole-blood arrays from patients with SLE, including repeat visits from some patients, and 30 arrays from independent healthy controls. The deposited expression matrix had undergone robust multiarray average background correction, quantile normalization, probe-set summarization, and log2 transformation by the original investigators. Therefore, no second background correction or quantile normalization was performed. Patient identifiers were extracted from the GEO metadata and retained for repeated-measures modeling.
GSE165004 was generated using the Agilent SurePrint G3 Human Gene Expression v2 8×60K Microarray platform (GPL16699). The complete dataset contained 24 fertile controls, 24 patients with RPL, and 24 patients with unexplained infertility. Only the 24 RPL samples and 24 fertile-control samples collected on days 19–21 of the menstrual cycle were included; the 24 unexplained infertility samples were excluded because they were outside the predefined comparison29. The depositor-normalized expression matrix was used, and no additional between-array normalization was applied after confirming comparable sample distributions using box plots and density plots.
GSE50772 was used as an independent SLE validation dataset and included peripheral blood mononuclear cell samples from 61 patients with SLE and 20 healthy controls generated using GPL57030. GSE198700 was generated using GPL13534 and contains chorionic villus samples from five patients with RPL and five elective-abortion controls31. The deposited expression matrix was imported in its entirety and transformed once using log2(x + 1) because the deposited expression values were provided on a non-logarithmic scale. This transformation was applied to the complete expression matrix before sample-level quality control, probe annotation, gene-level summarization, candidate-gene validation, differential expression analysis, group-comparison testing, and ROC analysis. Candidate genes were not transformed separately, and no additional logarithmic transformation was performed during subsequent validation analyses. For all datasets, sample identities, disease status, tissue origin, and group labels were cross-checked against the corresponding GEO metadata before analysis. Quality control included assessment of library sizes or expression distributions, sample-wise boxplots, principal component analysis, hierarchical clustering, and sample-distance heatmaps. No additional samples were excluded following quality-control assessment.
Differential expression analysis:
Differential expression analyses were conducted independently for GSE61635 and GSE165004 using limma version 3.60.6 (RRID:SCR_010943). All expression matrices were organized with genes in rows and samples in columns. The threshold for differential expression was set at |log₂ fold change| > 1 for GSE61635 and |log₂ fold change| > 0.5 for GSE165004, with a Benjamini–Hochberg (BH)-adjusted P < 0.05. Volcano plots were generated using ggplot2 version 3.5.1 (RRID:SCR_014601). Heatmaps of the 50 most significant differentially expressed genes (DEGs), ranked by adjusted P value, were generated using pheatmap version 1.0.12 (RRID:SCR_016418). Shared DEGs were identified by intersecting the official gene symbols from the significant SLE and RPL DEG lists using the base R intersect() function and were visualized using ggvenn version 0.1.16 (RRID:SCR_025300). The differential expression heatmaps, volcano plots, and intersection of the SLE and RPL DEG lists are presented in Figure 3.
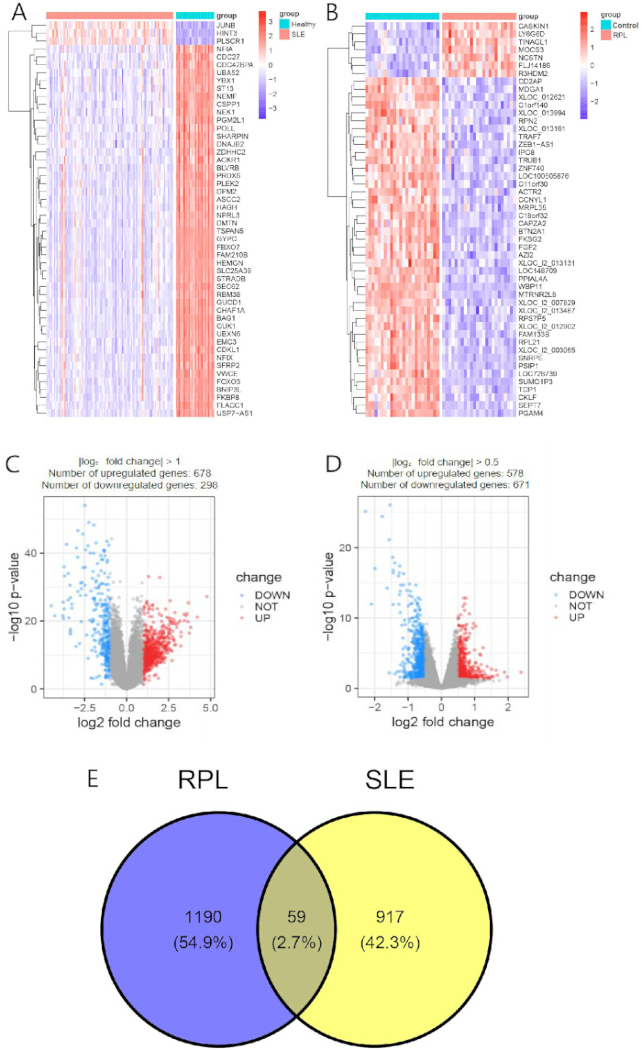
Figure 3. Differentially expressed genes in systemic lupus erythematosus and recurrent pregnancy loss.
(A) Heatmap of the 50 most significant differentially expressed genes (DEGs) between patients with systemic lupus erythematosus (SLE) and healthy controls in GSE61635. (B) Heatmap of the 50 most significant DEGs between patients with recurrent pregnancy loss (RPL) and fertile controls in GSE165004. (C) Volcano plot of differential gene expression in GSE61635. (D) Volcano plot of differential gene expression in GSE165004. (E) Venn diagram showing the overlap between the significant DEG lists from the SLE and RPL discovery datasets. DEGs, differentially expressed genes. Please click here to view a larger version of this figure.
Functional enrichment analysis of intersection DEGs:
For molecular-level analysis of DEG functions, the DAVID online tool (version 2021; RRID:SCR_001881)32 was used to perform Gene Ontology (GO) functional and Kyoto Encyclopedia of Genes and Genomes (KEGG) pathway enrichment analyses. Official human gene symbols were uploaded as the identifier type, and Homo sapiens was selected as the species. The custom background population consisted of the intersection of all genes that passed probe annotation and quality control and were measurable in both GSE61635 and GSE165004. The minimum gene-count threshold was set to 2, and the maximum EASE score, representing DAVID’s modified one-sided Fisher exact P value, was set to 0.05. Multiple comparisons were controlled using the Benjamini–Hochberg procedure reported in the DAVID “Benjamini” column. Functional terms were considered statistically significant when the EASE score was < 0.05 and the Benjamini-adjusted P value was < 0.05. The complete DAVID output, including term names, gene counts, EASE scores, Benjamini-adjusted P values, input-gene mappings, and background-gene mappings, was exported as a tab-delimited file. The CNSknowall website was used to visualize the filtered DAVID results. The GO and KEGG enrichment results are presented in Figure 4A.
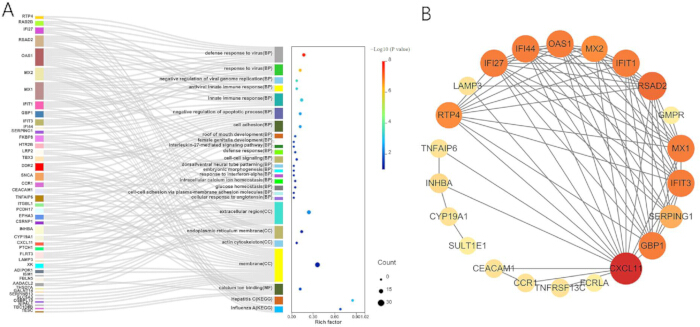
Figure 4. Functional enrichment analysis and protein–protein interaction network of the shared differentially expressed genes.
(A) Gene Ontology (GO) and Kyoto Encyclopedia of Genes and Genomes (KEGG) enrichment analyses of the 59 shared differentially expressed genes (DEGs). The Sankey diagram illustrates the relationships between genes and enriched GO terms, and the accompanying bubble plot summarizes enriched GO and KEGG terms according to rich factor, gene count, and statistical significance. (B) Protein–protein interaction (PPI) network constructed from the 59 shared DEGs using STRING and visualized in Cytoscape. Node size and color reflect network connectivity, and edges indicate predicted protein–protein associations. BP, biological process; CC, cellular component; MF, molecular function. Please click here to view a larger version of this figure.
PPI network and identification of core genes:
The shared DEGs were uploaded to STRING version 11.0 (RRID:SCR_005223)33 with Homo sapiens selected as the organism (taxonomic identifier: 9606). The full STRING network was used, allowing both functional and physical protein associations. All available evidence channels were enabled, including experimental evidence, curated databases, co-expression, text mining, gene neighborhood, gene fusion, and gene co-occurrence.
The minimum required interaction score was set to 0.400, corresponding to medium confidence. No additional first-shell or second-shell interactors were added; therefore, the network contained only proteins encoded by the submitted shared DEGs. Network edges were displayed using confidence mode and exported as a tab-separated values file containing the interacting proteins and combined STRING scores. STRING confidence scores represent the confidence that an association exists rather than the magnitude or binding strength of the interaction.
The STRING network file was imported into Cytoscape version 3.10.0 (RRID:SCR_003032)34. Nodes without any interaction with another submitted protein were removed before network topology analysis35. The remaining network was treated as an undirected network. STRING combined scores were retained as edge attributes for visualization, whereas the cytoHubba rankings were generated using the default unweighted topological definitions. The resulting PPI network is presented in Figure 4B.
Hub genes were ranked using cytoHubba version 0.1 (RRID:SCR_017677) with six algorithms: Maximal Clique Centrality (MCC), Maximum Neighborhood Component (MNC), Edge Percolated Component (EPC), Degree, Closeness, and Radiality36. For each algorithm, genes were ranked in descending order, and the top 10 genes were retained. Network hub candidates were defined using the strict intersection of the six top-10 lists. Thus, a gene was retained as a network hub only when it appeared among the top 10 genes generated by all six algorithms. The rankings and intersection procedure were exported and archived. The top 10 genes identified by each cytoHubba algorithm are presented in Table 3.
| Rank | Maximal Clique Centrality (MCC) | Maximum Neighborhood Component (MNC) | Edge Percolated Component (EPC) | Degree | Closeness | Radiality |
| 1 | RSAD2 | RSAD2 | RSAD2 | RSAD2 | RSAD2 | RSAD2 |
| 2 | RTP4 | RTP4 | RTP4 | RTP4 | RTP4 | RTP4 |
| 3 | IFIT3 | IFIT3 | IFIT3 | IFIT3 | IFIT3 | IFIT3 |
| 4 | IFI27 | IFI27 | IFI27 | IFI27 | IFI27 | IFI27 |
| 5 | IFI44 | IFI44 | IFI44 | IFI44 | IFI44 | IFI44 |
| 6 | GBP1 | GBP1 | GBP1 | GBP1 | GBP1 | GBP1 |
| 7 | MX1 | MX1 | MX1 | MX1 | MX1 | MX1 |
| 8 | OAS1 | OAS1 | OAS1 | OAS1 | OAS1 | OAS1 |
| 9 | IFIT1 | IFIT1 | IFIT1 | IFIT1 | IFIT1 | IFIT1 |
| 10 | CXCL11 | CXCL11 | CXCL11 | CXCL11 | CXCL11 | CXCL11 |
Table 3: Top 10 hub genes identified by six cytoHubba ranking algorithms.
Shared differentially expressed genes were ranked using six network-topology algorithms implemented in the cytoHubba plugin of Cytoscape. The top 10 ranked genes generated by each algorithm are presented for comparison across Maximal Clique Centrality (MCC), Maximum Neighborhood Component (MNC), Edge Percolated Component (EPC), Degree, Closeness, and Radiality.
LASSO regression for core gene identification:
LASSO logistic regression was performed independently in the SLE and RPL discovery datasets using glmnet version 4.1-8 (RRID:SCR_015505). The predictor matrix consisted of the normalized expression values of the network hub candidates, with samples in rows and genes in columns. Disease status was encoded as 1 and control status as 0. A binomial generalized linear model with a pure LASSO penalty was fitted using family = "binomial" and alpha = 1. Predictor variables were standardized internally using standardize = TRUE, and an intercept was included. Class-stratified 10-fold assignments were generated separately for the SLE and RPL datasets using custom base R code. Within each disease-status stratum, sample indices were randomly permuted and distributed as evenly as possible across the 10 folds using sample(rep(seq_len(10), length.out = n)). A random seed of 123 was set before generating the fold assignments for each dataset to ensure reproducibility. Because each disease-status group contained more than 10 samples, every cross-validation fold included both cases and controls. The resulting integer vectors (foldid_sle and foldid_rpl) were supplied to the foldid argument of cv.glmnet(), and the same fold assignments were used for all evaluated λ values within the corresponding dataset.
The models were fitted using family = "binomial", alpha = 1, nfolds = 10, type.measure = "deviance", standardize = TRUE, intercept = TRUE, nlambda = 100, thresh = 1 × 10⁻7, and maxit = 100000. The penalty parameter was selected using lambda.min, defined as the lambda value producing the minimum mean cross-validated binomial deviance. The more conservative lambda.1se, defined as the largest lambda within one standard error of the minimum cross-validation error, was recorded as a sensitivity result. The LASSO procedure was applied separately to GSE61635 and GSE165004. Genes with nonzero coefficients in both disease-specific models were defined as shared LASSO-selected candidate genes. By introducing the L1 regularization term, the method effectively shrinks the coefficients of less informative genes to zero, thereby performing feature selection37. The coefficient profiles and 10-fold cross-validation curves for the SLE and RPL discovery datasets are presented in Figure 5.
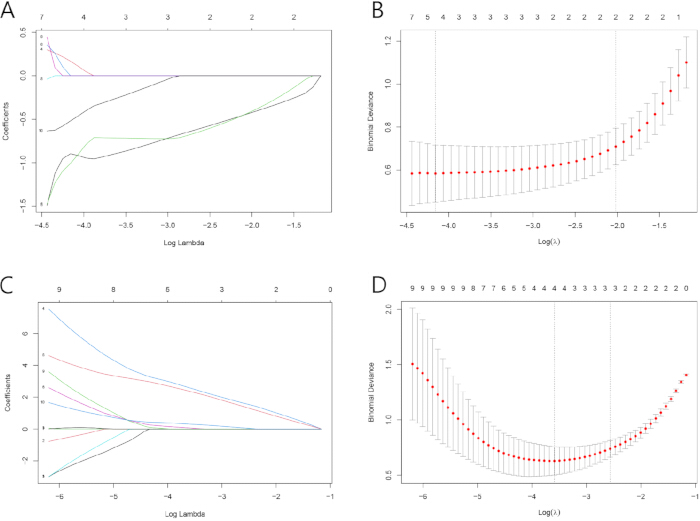
Figure 5. Least absolute shrinkage and selection operator regression analysis of the network hub genes.
(A) Coefficient profiles generated by least absolute shrinkage and selection operator (LASSO) logistic regression for the systemic lupus erythematosus (SLE) discovery dataset (GSE61635). (B) Ten-fold cross-validation curve used to determine the optimal penalty parameter (λ) for the SLE model. (C) Coefficient profiles generated by LASSO logistic regression for the recurrent pregnancy loss (RPL) discovery dataset (GSE165004). (D) Ten-fold cross-validation curve used to determine the optimal penalty parameter (λ) for the RPL model. The numbers along the upper x-axis indicate the number of nonzero regression coefficients at each value of λ. The vertical dashed lines indicate λ_min and λ_1se. Please click here to view a larger version of this figure.
Validation of the diagnostic value of core genes:
The expression patterns of the LASSO-selected candidate genes were evaluated in the independent SLE dataset GSE50772 and the independent RPL dataset GSE198700. External datasets were used only after candidate-gene selection had been completed in GSE61635 and GSE165004. No additional feature selection or model fitting was performed in the validation datasets. Candidate-gene expression was compared between cases and controls using the two-sided Wilcoxon rank-sum test. When more than one candidate gene was tested within a dataset, the resulting P values were corrected using the Benjamini–Hochberg procedure. A candidate gene was considered externally replicated when its expression differed significantly between cases and controls after multiple-testing correction and its direction was consistent with the corresponding discovery dataset. The expression patterns of the candidate genes in the discovery and validation datasets are presented in Figure 6.
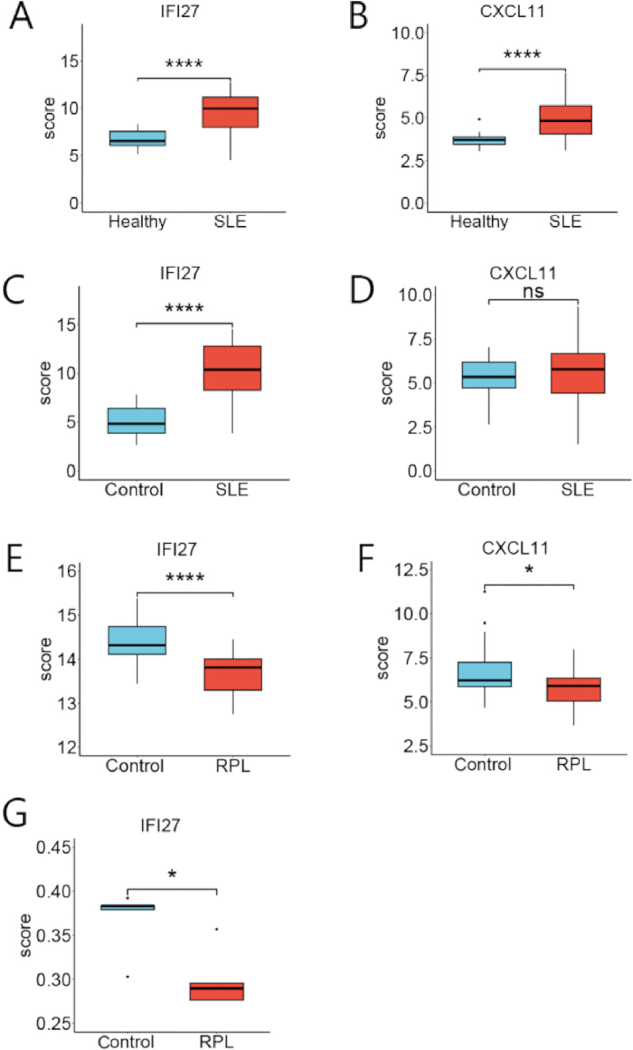
Figure 6. Expression of IFI27 and CXCL11 in the discovery and validation datasets.
(A,B) Expression of IFI27 and CXCL11, respectively, in the systemic lupus erythematosus (SLE) discovery dataset (GSE61635). (C,D) Expression of IFI27 and CXCL11, respectively, in the independent SLE validation dataset (GSE50772). (E,F) Expression of IFI27 and CXCL11, respectively, in the recurrent pregnancy loss (RPL) discovery dataset (GSE165004). (G) Expression of IFI27 in the independent RPL validation dataset (GSE198700). Gene expression was compared between groups using the two-sided Wilcoxon rank-sum test. P values were adjusted using the Benjamini–Hochberg method when multiple candidate genes were tested within the same dataset. P < 0.05; **** P < 0.0001; ns, not significant. Please click here to view a larger version of this figure.
Receiver operating characteristic (ROC) analyses were conducted using pROC version 1.18.5 (RRID:SCR_024286)38. Separate ROC curves were generated for each candidate gene in each discovery dataset. The area under the ROC curve (AUC) and its two-sided 95% confidence interval were calculated using DeLong’s method. The exploratory diagnostic cutoff was determined using the maximum Youden index. Confidence intervals for the cutoff, sensitivity, and specificity were calculated using 2,000 stratified bootstrap replicates with the random seed set to 123. The AUC was used as a threshold-independent measure of discrimination39. Because the datasets were retrospective and generated using different tissues, platforms, and normalization procedures, the Youden-derived cutoffs were calculated separately within each dataset and were treated as exploratory dataset-specific thresholds. They were not considered standardized clinical cutoffs and were not transferred directly between platforms. The external ROC results represent transcriptomic validation rather than prospective clinical validation. pROC supports DeLong confidence intervals for AUCs and Youden-index optimization through coords(), while confidence intervals for ROC coordinates can be estimated using stratified bootstrap resampling. The ROC curves and summaries of candidate-gene discrimination in the SLE and RPL discovery datasets are presented in Figure 7.
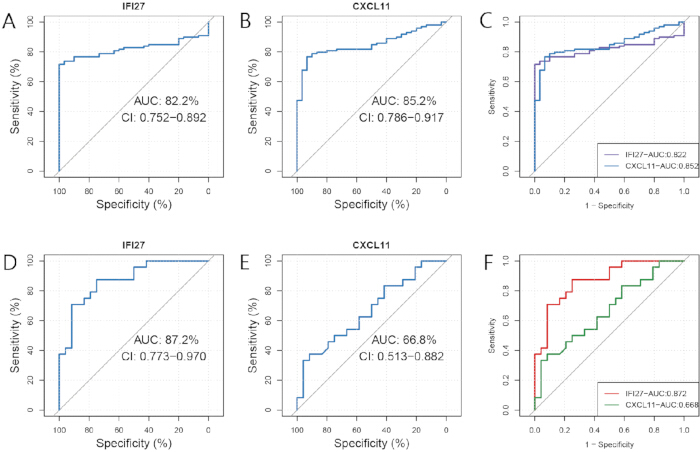
Figure 7. Receiver operating characteristic analysis of the candidate genes.
(A) Receiver operating characteristic (ROC) curve for IFI27 in the systemic lupus erythematosus (SLE) discovery dataset. (B) ROC curve for CXCL11 in the SLE discovery dataset. (C) Summary of the diagnostic performance of IFI27 and CXCL11 in the SLE discovery dataset. (D) ROC curve for IFI27 in the recurrent pregnancy loss (RPL) discovery dataset. (E) ROC curve for CXCL11 in the RPL discovery dataset. (F) Summary of the diagnostic performance of IFI27 and CXCL11 in the RPL discovery dataset. Area under the curve (AUC) values are presented with 95% confidence intervals (CIs). Please click here to view a larger version of this figure.
ssGSEA immune infiltration:
Considering the roles of immune-cell dysregulation in the pathogenesis of SLE and RPL40,41, immune-cell enrichment was computationally inferred in the GSE61635 and GSE165004 discovery datasets. The analysis was performed separately within each dataset, and the datasets were not merged. The immune-cell gene-signature collection consisted of the marker-gene sets for 28 immune-cell populations described by Charoentong et al.42. The original supplementary gene-signature table was converted into a named gene-set list using official human gene symbols. Duplicate symbols within each gene set were removed. Genes absent from the corresponding expression matrix were discarded, and gene sets containing fewer than five matched genes after identifier mapping were excluded from that dataset. Single-sample gene set enrichment analysis (ssGSEA) was performed using GSVA version 1.52.3 (RRID:SCR_021058) and GSEABase version 1.66.0. In GSVA version 1.52.3, a method-specific parameter object is required. The following parameters were used: minSize = 5, maxSize = 500, alpha = 0.25, normalize = TRUE, and checkNA = "yes.”
The alpha parameter was set to 0.25, and final ssGSEA score normalization was enabled. Gene sets were restricted to 5–500 genes after matching to the expression matrix. Single-threaded execution was used to ensure consistent computation across systems. The kcdf parameter was not used because it is not a parameter of the ssgseaParam() procedure in GSVA version 1.52.3. ssGSEA produces relative sample-level gene-set enrichment scores rather than experimentally measured immune-cell counts or absolute cell fractions43. The GSVA 1.52.3 workflow requires a method-specific parameter object, and the ssGSEA parameters include alpha, score normalization, and gene-set size limits.
For each immune-cell signature, ssGSEA scores were compared between disease and control groups using the two-sided Wilcoxon rank-sum test. P values for the 28 cell-type comparisons were adjusted separately within each dataset using the Benjamini–Hochberg method. Immune-cell signatures with an adjusted P value < 0.05 were considered differentially enriched.
Spearman rank correlations were calculated between candidate-gene expression and the ssGSEA score of each immune-cell signature within each dataset. Correlation P values were adjusted using the Benjamini–Hochberg method across all candidate gene–immune-cell combinations within that dataset. Correlations were considered statistically significant at an adjusted P value < 0.05. Correlation matrices were visualized using ggcorrplot version 0.1.4.1, and group-comparison plots were generated using ggplot2 version 3.5.1.
Raw normalized ssGSEA scores were used for all statistical tests. Heatmaps and stacked visualizations were used only for descriptive presentation. The scores were not described as direct proportions of immune cells, and observed associations were interpreted as computational correlations rather than experimentally demonstrated cell–gene interactions. The immune-cell signature enrichment profiles, group comparisons, and correlations with candidate-gene expression are presented in Figure 8.
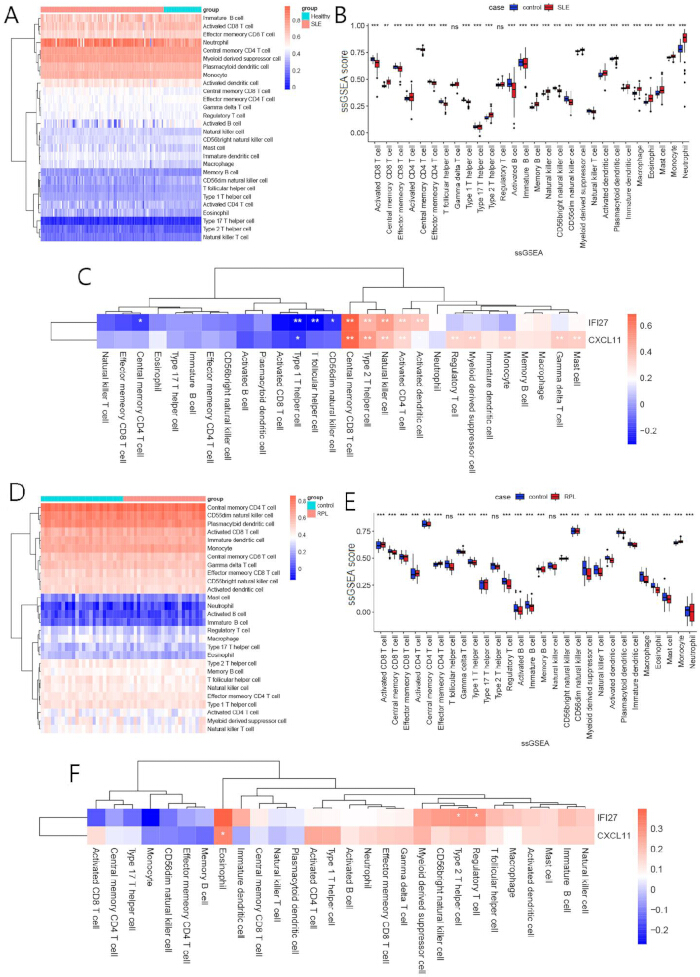
Figure 8. Immune-cell signature enrichment and correlations with the shared candidate genes in systemic lupus erythematosus and recurrent pregnancy loss.
(A) Hierarchical clustering heatmap of single-sample gene set enrichment analysis (ssGSEA) scores for 28 immune-cell signatures in the systemic lupus erythematosus (SLE) discovery dataset. (B) Comparison of immune-cell signature ssGSEA scores between patients with SLE and healthy controls. (C) Spearman correlation heatmap showing the associations between IFI27 and CXCL11 expression and the 28 immune-cell signature ssGSEA scores in the SLE discovery dataset. (D) Hierarchical clustering heatmap of ssGSEA scores for 28 immune-cell signatures in the recurrent pregnancy loss (RPL) discovery dataset. (E) Comparison of immune-cell signature ssGSEA scores between patients with RPL and fertile controls. (F) Spearman correlation heatmap showing the associations between IFI27 and CXCL11 expression and the 28 immune-cell signature ssGSEA scores in the RPL discovery dataset. Correlations were calculated using Spearman's rank correlation, and P values were adjusted using the Benjamini–Hochberg method. P < 0.05; ** P < 0.01; *** P < 0.001; ns, not significant. Please click here to view a larger version of this figure.
Results
MR analysis
After instrument selection and data harmonization, 16 SNPs were retained for the forward MR analysis, in which SLE was treated as the exposure and the number of spontaneous miscarriages as the outcome. Detailed information on the instrumental variables is provided in Supplementary Table 1. All retained SNPs had F statistics greater than 10, indicating that weak-instrument bias was unlikely. Each retained SNP was also screened using PhenoScanner V2, and no SNP associated with aPL was identified. MR-PRESSO analysis identified no outliers. Cochran’s Q test showed no significant heterogeneity among the SNP-specific estimates (Q = 16.12, P = 0.31); therefore, a fixed-effects IVW model was applied. The MR-Egger intercept test did not indicate directional horizontal pleiotropy (P = 0.69). The IVW analysis showed a statistically significant but quantitatively modest positive association between genetically predicted SLE and the number of spontaneous miscarriages (odds ratio [OR] = 1.01, 95% confidence interval [CI] = 1.00–1.02, P < 0.01; Figure 2A). The effect estimates obtained using MR-Egger regression (OR = 1.01, 95% CI = 1.00–1.03, P = 0.16), the weighted median method (OR = 1.01, 95% CI = 1.00–1.02, P = 0.17), and the weighted mode method (OR = 1.01, 95% CI = 0.99–1.03, P = 0.42) were directionally consistent with the IVW estimate, although they did not individually reach statistical significance. Leave-one-out analysis showed that exclusion of any single SNP did not materially alter the pooled estimate, and the approximately symmetrical funnel plot provided no visual evidence that the result was driven by marked directional pleiotropy. The corresponding scatter plot, SNP-specific forest plot, leave-one-out analysis, and funnel plot are presented in Supplementary Figures 1–4.
In the reverse MR analysis, 16 SNPs were retained after instrument selection, and all had F statistics greater than 10 (Supplementary Table 2). MR-PRESSO analysis identified no outliers. Cochran’s Q test showed no significant heterogeneity (Q = 13.41, P = 0.50), and the MR-Egger intercept test provided no evidence of directional horizontal pleiotropy (P = 0.41). The IVW estimate did not support an association between the genetically predicted number of spontaneous miscarriages and SLE risk (OR = 0.93, 95% CI = 0.21–4.23, P = 0.93; Figure 2B). Together, the MR results support a modest association in the forward direction, from genetically predicted SLE to the number of spontaneous miscarriages, whereas the reverse analysis did not support an association from the genetically predicted number of spontaneous miscarriages to SLE risk.
Bioinformatics analysis
Differential expression analysis:
Differential expression analysis of GSE61635 identified 976 DEGs between the SLE and healthy-control groups, including 678 upregulated and 298 downregulated genes (Figure 3C). Analysis of GSE165004 identified 1,249 DEGs between the RPL and control groups, including 578 upregulated and 671 downregulated genes (Figure 3D). Heatmaps showing the 50 most significant DEGs in the two discovery datasets are presented in Figure 3A and Figure 3B. In addition, 59 shared DEGs were identified across the two datasets (Figure 3E). These shared DEGs provided the gene set used for the subsequent functional enrichment and network analyses.
Functional enrichment analysis of intersection DEGs:
The 59 shared DEGs were subjected to GO and KEGG pathway enrichment analyses using DAVID. Within the biological process category, the shared DEGs were enriched in defense response to virus, response to virus, negative regulation of viral genome replication, antiviral innate immune response, negative regulation of the apoptotic process, and cell adhesion. Enriched cellular component terms included extracellular region, endoplasmic reticulum membrane, actin cytoskeleton, and membrane. Calcium ion binding was identified among the enriched molecular function terms. KEGG analysis showed enrichment in pathways related to hepatitis C and influenza A (Figure 4A). These findings indicate that the shared DEGs were predominantly associated with antiviral and immune-related biological processes, providing functional context for the genes common to the SLE and RPL discovery datasets.
PPI network and identification of hub genes
The 59 shared DEGs were uploaded to STRING to construct a PPI network using a minimum interaction confidence score of 0.400. The resulting network contained 59 nodes and 80 edges. The network was imported into Cytoscape version 3.10.0 for visualization, and isolated nodes were removed before topological analysis (Figure 4B). Hub-gene ranking was performed using the cytoHubba plugin. Six algorithms were applied: Maximal Clique Centrality (MCC), Maximum Neighborhood Component (MNC), Edge Percolated Component (EPC), Degree, Closeness, and Radiality. The same 10 genes were identified among the top-ranked genes generated by all six algorithms: RSAD2, RTP4, IFIT3, IFI27, IFI44, GBP1, MX1, OAS1, IFIT1, and CXCL11 (Table 3). These genes were therefore retained as candidate network hubs for subsequent LASSO regression.
LASSO regression identified IFI27 and CXCL11 as shared candidate genes
The 10 candidate hub genes were subjected to LASSO regression analysis in the SLE and RPL discovery datasets. In the SLE dataset, four genes retained nonzero coefficients at the selected lambda value: IFIT3, IFI27, IFI44, and CXCL11, with coefficients of 2.575, 0.057, 2.359, and 0.307, respectively (Figure 5A,B). In the RPL dataset, four genes retained nonzero coefficients: IFI27, GBP1, OAS1, and CXCL11, with coefficients of −0.897, 0.167, −1.007, and −0.519, respectively (Figure 5C,D). Comparison of the genes selected by the two disease-specific models identified IFI27 and CXCL11 as the shared LASSO-selected candidate genes. These two genes were subsequently evaluated in the discovery and external validation datasets.
External validation of IFI27 and CXCL11 expression
The expression patterns of the two candidate genes were evaluated using the independent GSE50772 and GSE198700 validation datasets obtained from the GEO database. In GSE61635, both IFI27 and CXCL11 were significantly upregulated in the SLE group compared with healthy controls (Figure 6A,B). In the independent SLE validation dataset (GSE50772), IFI27 remained significantly upregulated (Figure 6C), whereas CXCL11 did not differ significantly between the groups (Figure 6D). In the RPL discovery dataset (GSE165004), both IFI27 and CXCL11 were significantly downregulated in the RPL group compared with controls (Figure 6E,F). In the independent RPL validation dataset (GSE198700), IFI27 remained significantly downregulated in the RPL group (Figure 6G), whereas CXCL11 was not detected. Overall, IFI27 showed consistent differential expression across both the SLE and RPL discovery and validation datasets. In contrast, CXCL11 was not consistently replicated in the external validation datasets. Accordingly, IFI27 was prioritized as the shared candidate biomarker for subsequent analyses.
Exploratory evaluation of diagnostic discrimination
Receiver operating characteristic (ROC) analysis was performed to evaluate the ability of IFI27 and CXCL11 expression to distinguish disease samples from controls in the analyzed retrospective transcriptomic datasets. For SLE, IFI27 yielded an area under the ROC curve (AUC) of 0.822 (95% CI = 0.752–0.892; Figure 7A), whereas CXCL11 yielded an AUC of 0.852 (95% CI = 0.786–0.917; Figure 7B). A comparison of the ROC curves for the two candidate genes in the SLE dataset is shown in Figure 7C. For RPL, IFI27 yielded an AUC of 0.872 (95% CI = 0.773–0.970; Figure 7D), whereas CXCL11 yielded an AUC of 0.668 (95% CI = 0.513–0.882; Figure 7E). A comparison of the ROC curves for the two candidate genes in the RPL dataset is shown in Figure 7F. IFI27 demonstrated AUC values greater than 0.80 in both disease datasets and showed more consistent external validation than CXCL11 across the expression datasets. These findings support IFI27 as a candidate biomarker for further evaluation. However, because the ROC analyses were performed using retrospective public transcriptomic datasets, the results should be interpreted as exploratory evidence of transcriptomic discrimination rather than prospective clinical diagnostic validation.
Computational assessment of immune infiltration
ssGSEA was performed to evaluate the enrichment of 28 immune-cell signatures in the GSE61635 and GSE165004 discovery datasets. The immune-cell enrichment heatmaps for the SLE and RPL datasets are shown in Figure 8A,D, respectively, whereas the corresponding group comparisons of ssGSEA scores are presented in Figure 8B,E. In the SLE dataset, multiple immune-cell signatures differed significantly between patients with SLE and healthy controls, including those representing CD8+ T cells, CD4+ T cells, B cells, dendritic cells, type 1 helper T (Th1) cells, type 2 helper T (Th2) cells, type 17 helper T (Th17) cells, natural killer cells, macrophages, eosinophils, mast cells, monocytes, and neutrophils (Figure 8B). In the RPL dataset, the ssGSEA scores for activated CD8+ T cells, activated CD4+ T cells, effector memory CD4+ T cells, Th17 cells, and monocytes were higher in the RPL group than in the control group. In contrast, the ssGSEA scores for regulatory T cells (Treg) and macrophages were lower in the RPL group than in the control group (Figure 8E). Correlation analysis showed that, in the SLE dataset, IFI27 and CXCL11 expression was positively correlated with the ssGSEA scores of activated CD4+ T cells, natural killer cells, Th2 cells, and central memory CD8+ T cells and negatively correlated with the Th1-cell ssGSEA score (Figure 8C). In the RPL dataset, IFI27 expression was positively correlated with the ssGSEA scores of Treg and Th2 cells, whereas CXCL11 expression was positively correlated with the eosinophil ssGSEA score (Figure 8F).
Data Availability:
No new primary human participant data were generated in this study. All analyses were based exclusively on publicly available genome-wide association study (GWAS) summary statistics and transcriptomic datasets. The SLE GWAS summary statistics were obtained from FinnGen Release 11 (accession: finngen_R11_L12_LUPUS). Summary statistics for the number of spontaneous miscarriages were obtained from the IEU OpenGWAS resource (accession: ukb-b-419), which is based on UK Biobank data. The transcriptomic datasets were obtained from the National Center for Biotechnology Information Gene Expression Omnibus (GEO) under accession numbers GSE61635, GSE165004, GSE50772, and GSE198700. The publicly available datasets can be accessed at the following repositories:
-- FinnGen Release 11: https://r11.finngen.fi/
-- IEU OpenGWAS: https://gwas.mrcieu.ac.uk/
-- Gene Expression Omnibus (GEO): https://www.ncbi.nlm.nih.gov/geo/
The processed data supporting the findings of this study are included in the article and its Supplementary Materials. No individual-level or personally identifiable participant data were accessed or retained. The analytical workflow was performed using publicly available software and packages as described in the Protocol.
Supplementary File 1. Completed STROBE-MR reporting checklist.
Completed Strengthening the Reporting of Observational Studies in Epidemiology Using Mendelian Randomization (STROBE-MR) checklist indicating where each recommended reporting item is addressed in the manuscript. Please click here to download this file.
Supplementary Figure 1. Scatter plot of the forward Mendelian randomization analysis.
Scatter plot showing the associations between the genetic effects of the instrumental single-nucleotide polymorphisms (SNPs) on systemic lupus erythematosus (SLE) and the number of spontaneous miscarriages. Each point represents one SNP, with horizontal and vertical error bars indicating the standard errors of the SNP effect estimates. Regression lines correspond to the inverse-variance weighted, MR-Egger, weighted median, and weighted mode Mendelian randomization methods. Please click here to download this file.
Supplementary Figure 2. Single-nucleotide polymorphism-specific causal estimates from the forward Mendelian randomization analysis.
Forest plot showing the causal effect estimate for each instrumental single-nucleotide polymorphism (SNP) on the association between systemic lupus erythematosus (SLE) and the number of spontaneous miscarriages. Black points represent the SNP-specific effect estimates with 95% confidence intervals. Red points represent the overall causal effect estimates obtained using the inverse-variance weighted and MR-Egger methods. The vertical dashed line indicates the null effect. Please click here to download this file.
Supplementary Figure 3. Leave-one-out sensitivity analysis of the forward Mendelian randomization analysis.
Forest plot showing the results of the leave-one-out sensitivity analysis evaluating the association between systemic lupus erythematosus (SLE) and the number of spontaneous miscarriages. Each black point represents the overall inverse-variance weighted causal effect estimate after sequential exclusion of one instrumental single-nucleotide polymorphism (SNP), with horizontal lines indicating the corresponding 95% confidence intervals. The red point represents the overall inverse-variance weighted estimate obtained using all instrumental SNPs. The vertical dashed line indicates the null effect. Please click here to download this file.
Supplementary Figure 4. Funnel plot of the forward Mendelian randomization analysis.
Funnel plot showing the distribution of the SNP-specific causal effect estimates for the association between systemic lupus erythematosus (SLE) and the number of spontaneous miscarriages. Each point represents one instrumental single-nucleotide polymorphism (SNP). The vertical lines indicate the overall causal effect estimates obtained using the inverse-variance weighted and MR-Egger methods. The y-axis represents the inverse of the standard error (1/SE). Please click here to download this file.
Supplementary Table 1. Instrumental single-nucleotide polymorphisms selected for the forward Mendelian randomization analysis.
The table lists the instrumental single-nucleotide polymorphisms (SNPs) used for the forward Mendelian randomization analysis of systemic lupus erythematosus and the number of spontaneous miscarriages, including the nearest annotated gene, chromosome, genomic position, effect allele, effect allele frequency, effect size (Beta), standard error (SE), P value, and F statistic. Chromosomal positions are based on the source genome assembly used in the genome-wide association study. The F statistic was calculated as Beta2/SE2. Please click here to download this file.
Supplementary Table 2. Instrumental single-nucleotide polymorphisms selected for the reverse Mendelian randomization analysis.
The table lists the instrumental single-nucleotide polymorphisms (SNPs) used for the reverse Mendelian randomization analysis with the number of spontaneous miscarriages as the exposure and systemic lupus erythematosus as the outcome, including the nearest annotated gene, chromosome, genomic position, effect allele, effect allele frequency, effect size (Beta), standard error (SE), P value, and F statistic. Chromosomal positions are based on the source genome assembly used in the genome-wide association study. The F statistic was calculated as Beta2/SE2. Please click here to download this file.
Discussion
Through bidirectional MR analysis combined with multidimensional bioinformatics analyses, this study identified a positive causal association between SLE and RPL while systematically screening for shared transcriptomic biomarkers. To our knowledge, this is the first study to integrate bidirectional MR, transcriptomic analyses, and immune-infiltration analyses to investigate this relationship. Although the observed MR effect size was modest (IVW OR = 1.01), the association was consistently supported by multiple complementary MR methods and sensitivity analyses without evidence of substantial heterogeneity, horizontal pleiotropy, or influential outliers, suggesting that the observed relationship is statistically robust but quantitatively small. Therefore, the present findings should be interpreted as evidence supporting a modest genetic contribution of SLE to RPL susceptibility rather than a large clinical effect. By integrating causal inference with transcriptomic validation and immune-infiltration analyses, this study provides a reproducible framework for prioritizing candidate biomarkers for complex immune-mediated reproductive disorders. A study conducted in Egypt between 2007 and 2021, which included 123 women with SLE and a total of 201 pregnancies, reported that 20.4% of pregnancies in women with SLE resulted in fetal loss44. Previous studies have likewise suggested that SLE is an important risk factor for RPL because immune dysregulation may increase the likelihood of pregnancy loss12.
Bioinformatics analyses revealed that the 59 shared differentially expressed genes (DEGs) were primarily enriched in pathways related to antiviral immune responses, cell adhesion, and regulation of apoptosis. Viral infection may contribute to the pathogenesis of SLE. Patients with SLE often exhibit dysfunction of both innate and adaptive immune responses45,46, rendering them more susceptible to viral infections. This increased susceptibility may contribute to pregnancy loss through mechanisms such as placental inflammation and placental-cell injury47. As an essential component of the placenta, alterations in the autophagy and biological behavior of trophoblast cells have also been associated with the occurrence of RPL48,49. Together, these observations suggest that immune dysregulation associated with SLE may influence pregnancy outcomes by affecting trophoblast-cell function. Further analyses identified IFI27 and CXCL11 as candidate hub genes shared by SLE and RPL. However, IFI27 was prioritized for subsequent analyses because it demonstrated greater biological consistency across independent datasets. Although both genes were selected by the LASSO model, only IFI27 showed consistent differential expression in both the discovery and external validation datasets, whereas CXCL11 was not consistently replicated in the validation datasets. Furthermore, IFI27 showed stronger diagnostic discrimination for RPL and remained significantly dysregulated across blood and reproductive-tissue datasets. Collectively, these findings support IFI27 as a more robust candidate biomarker than CXCL11, although additional experimental validation is needed. Validation using the SLE dataset GSE50772 and the RPL dataset GSE198700 demonstrated that IFI27 expression remained consistently dysregulated across the validation datasets. Notably, IFI27 was overexpressed in blood samples from patients with SLE, consistent with previous studies50, but was downregulated in endometrial and chorionic villus samples from patients with RPL. This contrasting pattern may reflect differences between systemic immune dysregulation and the local immune environment at the maternal–fetal interface in SLE complicated by RPL.
IFI27 is an interferon-stimulated gene involved in antiviral immunity, interferon signaling, and host immune responses following viral infection51,52. In normal pregnancy, IFI27 expression is markedly increased in trophoblast cells53, suggesting an important physiological role in maintaining trophoblast function. In contrast, our analyses demonstrated reduced IFI27 expression in the endometrium and chorionic villi of patients with RPL. Although this finding differs from some previous reports54, it should be interpreted cautiously because the present study integrated transcriptomic datasets derived from different tissues rather than matched maternal–fetal samples. One possible explanation is that chronic systemic type I interferon activation in SLE induces persistent interferon signaling in circulating immune cells while simultaneously promoting receptor desensitization, immune exhaustion, or compensatory negative-feedback mechanisms at the maternal–fetal interface. Alternatively, tissue-specific epigenetic regulation or differences in cellular composition between peripheral blood and reproductive tissues may suppress local IFI27 expression despite systemic interferon activation. These hypotheses remain speculative and require mechanistic validation using matched maternal blood, endometrial tissue, and trophoblast samples, ideally at the single-cell level, to distinguish tissue-specific and cell-type-specific regulatory mechanisms55.
Immune-infiltration analysis indicated significant differences in immune-cell signatures in both SLE and RPL, characterized primarily by alterations in CD4+ T-cell-related populations. IFI27 expression was positively correlated with Th2-cell enrichment in both diseases; however, these findings represent computational correlations derived from ssGSEA rather than experimentally verified biological interactions. Previous studies have shown that peripheral blood from patients with SLE contains reduced proportions of Th1 and Treg cells but increased proportions of Th2 cells56,57, which is consistent with our findings. During normal pregnancy, the Th1/Th2 immune balance at the maternal–fetal interface shifts toward a Th2-dominant state58. Therefore, reduced IFI27 expression in reproductive tissues may reflect alterations in local immune homeostasis associated with impaired maternal–fetal tolerance, although whether IFI27 directly regulates this process remains to be determined experimentally.
Several limitations should be acknowledged. First, although the MR analyses supported a causal association, the estimated genetic effect was relatively small, suggesting that SLE represents only one component of the multifactorial pathogenesis of RPL. Second, the transcriptomic integration included datasets generated from different tissues (peripheral blood, endometrium, and chorionic villi), microarray platforms, and independent cohorts, which may introduce biological and technical heterogeneity despite the consistent validation of IFI27. Third, the external validation cohort for chorionic villi included a limited number of samples, which may have reduced statistical power and generalizability. Fourth, because the publicly available datasets contained limited clinical information, important factors, including disease activity, antiphospholipid antibody status, medication exposure, pregnancy stage, and other clinical covariates, could not be fully evaluated. Finally, although PhenoScanner screening minimized potential pleiotropic confounding in the MR analyses, residual confounding cannot be completely excluded.
From a translational perspective, IFI27 should currently be regarded as a candidate biomarker rather than a clinically validated diagnostic marker. Before clinical implementation, prospective multicenter studies are needed to validate its diagnostic performance across diverse populations, establish standardized assay platforms and diagnostic thresholds, and determine how pregnancy stage, disease activity, and immunosuppressive treatment influence IFI27 expression. Functional experiments, together with spatial transcriptomics and single-cell transcriptomic analyses, will also be essential to clarify whether IFI27 actively contributes to maternal–fetal immune regulation or simply reflects interferon-driven immune activation.
Disclosures
Conflict of Interest:
The authors declare that they have no competing financial or non-financial interests.
Acknowledgements
This work was supported by the Beijing Municipal Administration of Traditional Chinese Medicine Major Difficult Diseases Integration of Traditional Chinese and Western Medicine Key Project (2023BJSZDYNJBXTGG-003), the National-Level Public Welfare Scientific Research Fund for Basic Research Business of Institutes (ZZ16-XRZ-038), and the High-Level Chinese Medical Hospital Promotion Project (HLCMHPP2023087). The funding sources had no role in the study design, data collection, data analysis, data interpretation, manuscript preparation, or the decision to submit the manuscript for publication. The authors thank the investigators and participants of the FinnGen study, the UK Biobank, and the National Center for Biotechnology Information Gene Expression Omnibus (GEO) for making their datasets publicly available. The authors also acknowledge the FinnGen consortium, which integrates Finnish biobank samples with nationwide health registry data through collaborations among Finnish research organizations, biobanks, and international partners.
Materials
| Name | Company | Catalog Number | Comments |
|---|---|---|---|
| 28 immune-cell gene-signature collection | Published supplementary gene-signature resource | Supplementary immune-cell marker-gene list described by Charoentong et al. (Reference 42) | Not applicable RRID: Not available Purpose / notes: Immune-cell signatures used for ssGSEA. |
| CNSknowall | CNSknowall web platform | DAVID output files | Not applicable RRID: Not available Purpose / notes: Visualization of filtered functional-enrichment results. |
| Computer workstation | Institutional computing environment | Not applicable | Not applicable RRID: Not applicable Purpose / notes: Computational analyses. |
| Consumables | Not applicable | Not applicable | Not applicable RRID: Not applicable Purpose / notes: No wet-laboratory consumables were used. |
| Cytoscape | Cytoscape Consortium | Not applicable | 3.10.0 RRID: SCR_003032 Purpose / notes: Protein–protein interaction network visualization and topology analysis. |
| cytoHubba | Cytoscape App Store | Not applicable | 0.1 RRID: SCR_017677 Purpose / notes: Hub-gene ranking using MCC, MNC, EPC, Degree, Closeness, and Radiality. |
| DAVID Functional Annotation Tool | National Institutes of Health / National Cancer Institute | Uploaded shared DEG and background gene lists | 2021 RRID: SCR_001881 Purpose / notes: Gene Ontology and KEGG pathway enrichment analysis. |
| European LD reference panel | 1000 Genomes Project / IEU OpenGWAS | Phase 3 European panel (GRCh37-compatible variants) | Phase 3 RRID: Not reported Purpose / notes: Linkage disequilibrium clumping through the OpenGWAS/TwoSampleMR workflow. |
| FinnGen | FinnGen Consortium | finngen_R11_L12_LUPUS | Release 11 RRID: SCR_022254 Purpose / notes: GWAS summary statistics for lupus erythematosus. |
| forestploter | CRAN | Not applicable | 1.1.2 RRID: Not available Purpose / notes: Forest plot visualization of Mendelian randomization estimates. |
| Gene Expression Omnibus (GEO) | National Center for Biotechnology Information | GSE61635; GSE165004; GSE50772; GSE198700 | Not applicable RRID: SCR_005012 Purpose / notes: Source of discovery and validation transcriptomic datasets. |
| Gene Ontology | Gene Ontology Consortium | GO terms accessed through DAVID | DAVID 2021 annotations RRID: SCR_002811 Purpose / notes: Biological process, cellular component, and molecular function annotation. |
| ggcorrplot | CRAN | Not applicable | 0.1.4.1 RRID: Not available Purpose / notes: Visualization of candidate gene–immune-cell correlation matrices. |
| ggplot2 | CRAN | Not applicable | 3.5.1 RRID: SCR_014601 Purpose / notes: Volcano plots, box plots, and other statistical graphics. |
| ggvenn | CRAN | Not applicable | 0.1.16 RRID: SCR_025300 Purpose / notes: Visualization of shared differentially expressed genes. |
| glmnet | CRAN | Not applicable | 4.1-8 RRID: SCR_015505 Purpose / notes: LASSO logistic regression and cross-validation. |
| GSE165004 | NCBI GEO | GSE165004 / GPL16699 | Processed Series Matrix RRID: SCR_005012 Purpose / notes: RPL endometrial discovery dataset. |
| GSE198700 | NCBI GEO | GSE198700 / GPL13534 | Processed Series Matrix RRID: SCR_005012 Purpose / notes: Independent RPL chorionic villus validation dataset. |
| GSE50772 | NCBI GEO | GSE50772 / GPL570 | Processed Series Matrix RRID: SCR_005012 Purpose / notes: Independent SLE peripheral blood mononuclear cell validation dataset. |
| GSE61635 | NCBI GEO | GSE61635 / GPL570 | Processed Series Matrix RRID: SCR_005012 Purpose / notes: SLE whole-blood discovery dataset. |
| GSEABase | Bioconductor | Not applicable | 1.66.0 RRID: Not available Purpose / notes: Management of immune-cell gene sets for ssGSEA. |
| GSVA | Bioconductor | Not applicable | 1.52.3 RRID: SCR_021058 Purpose / notes: Single-sample gene set enrichment analysis (ssGSEA). |
| IEU OpenGWAS | MRC Integrative Epidemiology Unit | ukb-b-419; finngen_R11_L12_LUPUS | Not applicable RRID: Not reported Purpose / notes: Retrieval of GWAS summary statistics and harmonized genetic association data. |
| Kyoto Encyclopedia of Genes and Genomes (KEGG) | Kanehisa Laboratories | KEGG pathways accessed through DAVID | DAVID 2021 annotations RRID: SCR_012773 Purpose / notes: Pathway enrichment annotation. |
| limma | Bioconductor | Not applicable | 3.60.6 RRID: SCR_010943 Purpose / notes: Differential expression analysis. |
| MRPRESSO | Verbanck et al. | Not applicable | 1 RRID: SCR_023697 Purpose / notes: Detection of horizontal pleiotropy and outlying instrumental variables. |
| pheatmap | CRAN | Not applicable | 1.0.12 RRID: SCR_016418 Purpose / notes: Expression heatmaps. |
| PhenoScanner V2 | PhenoScanner Consortium | SNP-level phenotype queries | Version 2 RRID: Not available Purpose / notes: Screening retained SNPs for potential confounding phenotype associations. |
| pROC | CRAN | Not applicable | 1.18.5 RRID: SCR_024286 Purpose / notes: ROC curves, AUCs, DeLong confidence intervals, Youden-index cutoffs, and bootstrap confidence intervals. |
| R | R Foundation for Statistical Computing | Not applicable | 4.4.2 RRID: SCR_001905 Purpose / notes: Statistical computing environment. |
| Reagents | Not applicable | Not applicable | Not applicable RRID: Not applicable Purpose / notes: No wet-laboratory reagents were used. |
| STRING | STRING Consortium | Homo sapiens (taxon 9606); minimum interaction score 0.400 | 11 RRID: SCR_005223 Purpose / notes: Protein–protein interaction network construction. |
| TwoSampleMR | MRC Integrative Epidemiology Unit | Not applicable | 0.6.6 RRID: SCR_019010 Purpose / notes: Bidirectional two-sample Mendelian randomization, data extraction, harmonization, causal estimation, and sensitivity analyses. |
| UK Biobank | UK Biobank | ukb-b-419 | 2018 summary dataset RRID: SCR_012815 Purpose / notes: GWAS summary statistics for the number of spontaneous miscarriages. |
References
- Petri M. Pregnancy and systemic lupus erythematosus. Best Pract Res Clin Obstet Gynaecol. 2020;64:24-30.
- Zhao X, et al. Advances in drug therapy for systemic lupus erythematosus. Curr Med Chem. 2021;28(7):1251-1268.
- Stanescu II, et al. Salivary biomarkers of inflammation in systemic lupus erythematosus. Ann Anat. 2018;219:89-93.
- Tian J, Zhang D, Yao X, Huang Y, Lu Q. Global epidemiology of systemic lupus erythematosus: A comprehensive systematic analysis and modelling study. Ann Rheum Dis. 2023;82(3):351-356.
- Palma Dos Reis CR, et al. Prediction of adverse pregnancy outcomes in women with systemic lupus erythematosus. Clin Rev Allergy Immunol. 2020;59(2):287-294.
- Venne K, Scott S, Bernatsky S, Vinet E. Induced abortions in women with systemic lupus erythematosus. Lupus. 2021;30(4):484-488.
- Kim JW, et al. Lupus low disease activity state achievement is important for reducing adverse outcomes in pregnant patients with systemic lupus erythematosus. J Rheumatol. 2021;48(5):707-716.
- Braga A, et al. Systemic lupus erythematosus and pregnancy: A Portuguese case-control study. Clin Rev Allergy Immunol. 2022;62(2):324-332.
- Dimitriadis E, Menkhorst E, Saito S, Kutteh WH, Brosens JJ. Recurrent pregnancy loss. Nat Rev Dis Primers. 2020;6(1):98.
- Quenby S, et al. Miscarriage matters: The epidemiological, physical, psychological, and economic costs of early pregnancy loss. Lancet. 2021;397(10285):1658-1667.
- Valeff NJ, Ventimiglia MS, Diao L, Jensen F. Lupus and recurrent pregnancy loss: The role of female sex hormones and B cells. Front Endocrinol (Lausanne). 2023;14:1233883.
- Gao R, Zeng X, Qin L. Systemic autoimmune diseases and recurrent pregnancy loss: Research progress in diagnosis and treatment. Chin Med J (Engl). 2021;134(17):2140-2142.
- Pantham P, Abrahams VM, Chamley LW. The role of anti-phospholipid antibodies in autoimmune reproductive failure. Reproduction. 2016;151(5):R79-R90.
- Meroni PL, et al. Updating on the pathogenic mechanisms of antiphospholipid antibody-associated pregnancy loss. Clin Rev Allergy Immunol. 2008;34(3):332-337.
- Blank M, Shoenfeld Y. Antiphospholipid antibody-mediated reproductive failure in antiphospholipid syndrome. Clin Rev Allergy Immunol. 2010;38(2–3):141-147.
- Babker A, et al. Frequency of ACE I/D and PAI-1 4G/5G polymorphisms in women with recurrent pregnancy loss in Sudan. Biomed Pharmacol J. 2025;18(3):1953-1961.
- Babker AM, et al. Detection of human platelet antigen polymorphisms (HPA-1 and HPA-3) and factor XIII mutation in Sudanese women with recurrent pregnancy loss. BMC Res Notes. 2024;17(1):66.
- Grover S, Del Greco MF, Stein CM, Ziegler A. Mendelian randomization. Methods Mol Biol. 2017;1666:581-628.
- Skrivankova VM, et al. Strengthening the reporting of observational studies in epidemiology using Mendelian randomization: The STROBE-MR statement. JAMA. 2021;326(16):1614-1621.
- Emdin CA, Khera AV, Kathiresan S. Mendelian randomization. JAMA. 2017;318(19):1925-1926.
- Burgess S, Thompson SG, CRP CHD Genetics Collaboration. Avoiding bias from weak instruments in Mendelian randomization studies. Int J Epidemiol. 2011;40(3):755-764.
- Hemani G, et al. The MR-Base platform supports systematic causal inference across the human phenome. eLife. 2018;7:e34408.
- Bowden J, Davey Smith G, Burgess S. Mendelian randomization with invalid instruments: Effect estimation and bias detection through Egger regression. Int J Epidemiol. 2015;44(2):512-525.
- Bowden J, Davey Smith G, Haycock PC, Burgess S. Consistent estimation in Mendelian randomization with some invalid instruments using a weighted median estimator. Genet Epidemiol. 2016;40(4):304-314.
- Hartwig FP, Davey Smith G, Bowden J. Robust inference in summary data Mendelian randomization via the zero modal pleiotropy assumption. Int J Epidemiol. 2017;46(6):1985-1998.
- Burgess S, Butterworth A, Thompson SG. Mendelian randomization analysis with multiple genetic variants using summarized data. Genet Epidemiol. 2013;37(7):658-665.
- Verbanck M, Chen CY, Neale B, Do R. Detection of widespread horizontal pleiotropy in causal relationships inferred from Mendelian randomization between complex traits and diseases. Nat Genet. 2018;50(5):693-698.
- Barrett T, et al. NCBI GEO: Archive for functional genomics data sets—update. Nucleic Acids Res. 2013;41(Database issue):D991-D995.
- Keleş İD, et al. Gene pathway analysis of the endometrium at the start of the window of implantation in women with unexplained infertility and unexplained recurrent pregnancy loss: Is unexplained recurrent pregnancy loss a subset of unexplained infertility? Hum Fertil (Camb). 2023;26(5):1129-1141.
- Kennedy WP, et al. Association of the interferon signature metric with serological disease manifestations but not global activity scores in multiple cohorts of patients with SLE. Lupus Sci Med. 2015;2(1):e000080.
- Matsumoto Y, et al. Characteristic DNA methylation profiles of chorionic villi in recurrent miscarriage. Sci Rep. 2022;12(1):11673.
- Sherman BT, Lempicki RA. Systematic and integrative analysis of large gene lists using DAVID bioinformatics resources. Nat Protoc. 2009;4(1):44-57.
- Szklarczyk D, et al. STRING v11: Protein–protein association networks with increased coverage, supporting functional discovery in genome-wide experimental datasets. Nucleic Acids Res. 2019;47(D1):D607-D613.
- Shannon P, et al. Cytoscape: A software environment for integrated models of biomolecular interaction networks. Genome Res. 2003;13(11):2498-2504.
- Jia P, Zheng S, Long J, Zheng W, Zhao Z. dmGWAS: Dense module searching for genome-wide association studies in protein–protein interaction networks. Bioinformatics. 2011;27(1):95-102.
- Chin CH, et al. cytoHubba: Identifying hub objects and subnetworks from complex interactome. BMC Syst Biol. 2014;8(Suppl 4):S11.
- Mohammadi M. A projection neural network for the generalized Lasso. IEEE Trans Neural Netw Learn Syst. 2020;31(6):2217-2221.
- Kumar R, Indrayan A. Receiver operating characteristic (ROC) curve for medical researchers. Indian Pediatr. 2011;48(4):277-287.
- de Hond AAH, Steyerberg EW, van Calster B. Interpreting area under the receiver operating characteristic curve. Lancet Digit Health. 2022;4(12):e853-e855.
- Xu H, et al. Single-cell transcriptomics reveals CCL3+ classical monocyte subset linked to autoimmune pathogenesis. J Inflamm Res. 2025;18:16273-16291.
- Zych M, et al. Surface immune checkpoints as potential biomarkers in physiological pregnancy and recurrent pregnancy loss. Int J Mol Sci. 2024;25(17):9378.
- Charoentong P, et al. Pan-cancer immunogenomic analyses reveal genotype-immunophenotype relationships and predictors of response to checkpoint blockade. Cell Rep. 2017;18(1):248-262.
- Liu J, Lu J, Wang G, Gu L, Li W. Prognostic characteristics of a six-gene signature based on ssGSEA in sarcoma. Aging (Albany NY). 2024;16(2):1536-1554.
- Mokbel A, et al. Pregnancy outcomes among Egyptian women with systemic lupus erythematosus: A prospective cohort study. Lupus. 2023;32(4):521-530.
- Illescas-Montes R, Corona-Castro CC, Melguizo-Rodríguez L, Ruiz C, Costela-Ruiz VJ. Infectious processes and systemic lupus erythematosus. Immunology. 2019;158(3):153-160.
- Banko A, et al. Epstein-Barr virus infection as a potential indicator of the occurrence and clinical presentation of systemic lupus erythematosus. Front Immunol. 2023;14:1307589.
- Nigro G, et al. Role of infections in recurrent spontaneous abortion. J Matern Fetal Neonatal Med. 2011;24(8):983-989.
- Yang D, et al. YY1-PVT1 affects trophoblast invasion and adhesion by regulating mTOR pathway-mediated autophagy. J Cell Physiol. 2020;235(10):6637-6646.
- Guan D, et al. Immunologic insights in recurrent spontaneous abortion: Molecular mechanisms and therapeutic interventions. Biomed Pharmacother. 2024;177:117082.
- Zhao X, et al. Identification of key biomarkers and immune infiltration in systemic lupus erythematosus by integrated bioinformatics analysis. J Transl Med. 2021;19(1):35.
- Villamayor L, et al. The IFN-stimulated gene IFI27 counteracts innate immune responses after viral infections by interfering with RIG-I signaling. Front Microbiol. 2023;14:1176177.
- Lim FY, et al. High-frequency home self-collection of capillary blood correlates IFI27 expression kinetics with SARS-CoV-2 viral clearance. J Clin Invest. 2023;133(23):e173715.
- Apps R, et al. Genome-wide expression profile of first-trimester villous and extravillous human trophoblast cells. Placenta. 2011;32(1):33-43.
- Li Y, et al. RNA sequencing of decidua reveals differentially expressed genes in recurrent pregnancy loss. Reprod Sci. 2021;28(8):2261-2269.
- Dankers W, et al. Failing maternal-fetal tolerance in SLE (FaMaLE): A prospective cohort study for finding the molecular mechanisms behind pregnancy complications. Lupus Sci Med. 2025;12(1):e001668.
- Xiang S, et al. Imbalance of helper T cell type 1, helper T cell type 2, and associated cytokines in patients with systemic lupus erythematosus: A meta-analysis. Front Pharmacol. 2022;13:988512.
- Tu J, et al. UC-BSC exosomes regulate Th17/Treg balance in patients with systemic lupus erythematosus via miR-19b/KLF13. Cells. 2022;11(24):4123.
- Wang W, et al. T helper (Th) cell profiles in pregnancy and recurrent pregnancy loss: Th1/Th2/Th9/Th17/Th22/Tfh cells. Front Immunol. 2020;11:2025.