This retrospective study of 160 patients developed a five-factor postpartum pelvic floor dysfunction (PFD) association model using pelvic floor ultrasound across resting, maximal contraction, and Valsalva states. The findings show strong associations in this single-center dataset but remain exploratory and require external validation before clinical application.
A subscription to JoVE is required to view this content. Sign in or start your free trial.
Research Article
Multimodal Pelvic Floor Ultrasound Parameters Associated with Postpartum Pelvic Floor Dysfunction: A Retrospective Study
In This Article
Summary
Abstract
Research on multimodal ultrasound parameters associated with postpartum pelvic floor dysfunction (PFD) across resting, maximal contraction, and Valsalva states remains limited. This retrospective study assessed these parameters in 172 patients examined between January 2022 and June 2025. After stratification into PFD and non-PFD groups, 1:1 propensity score matching (PSM) yielded 160 patients (80 per group) for analysis. Ultrasound parameters were evaluated across the three functional states. Logistic regression identified independent factors associated with PFD, and receiver operating characteristic (ROC) curve analysis assessed model performance. After PSM, baseline characteristics were comparable between groups (all p > 0.05). Compared with the non-PFD group, the PFD group had a larger resting levator ani hiatus area, a more inferior bladder neck position, and lower levator ani muscle thickness (all p < 0.001). During maximal contraction, the hiatus area reduction percentage and bladder neck elevation were lower. During the Valsalva maneuver, the hiatus area, bladder neck mobility, and most distal prolapse position were greater, and levator ani avulsion was more frequent (all p < 0.001). A larger resting levator ani hiatus area, lower resting muscle thickness, a lower hiatus area reduction percentage, greater bladder neck mobility during the Valsalva maneuver, and levator ani avulsion were independently associated with postpartum PFD (all p < 0.001). The five-parameter model had an area under the curve (AUC) of 0.870 (95% confidence interval, 0.815–0.926), with 91.3% sensitivity and 88.8% specificity. The model showed favorable internal fitting performance in the development dataset. Because independent validation was not performed, the findings should be considered hypothesis-generating; applications in clinical screening and individualized intervention remain unproven.
Introduction
Postpartum pelvic floor dysfunction (PFD) encompasses a range of pelvic floor symptoms after childbirth, including pelvic organ descent, stress or urgency urinary incontinence, fecal incontinence, chronic pelvic pain, and sexual dysfunction. These conditions may result from pregnancy- and delivery-related injury to the supportive soft tissues of the pelvic floor1. In this study, PFD was treated as a composite outcome rather than a single disorder; however, group assignment was based only on pelvic organ prolapse, stress or urgency urinary incontinence, and pelvic floor muscle strength, whereas fecal incontinence, chronic pelvic pain, and sexual dysfunction were not used as grouping criteria.
The pelvic floor support system consists of the levator ani muscle, including the puborectalis muscle, pelvic fascia, ligaments, and connective tissues surrounding the pelvic organs. Its structural integrity and functional coordination help maintain the normal position of the pelvic organs and support urinary and fecal function2. Childbirth is a major risk factor for PFD. Excessive stretching and laceration of the pelvic floor muscles and fascia during vaginal delivery may contribute to PFD3˒4. Because postpartum PFD may have an insidious onset, some patients do not seek medical attention until symptoms or tissue damage have progressed, which may complicate treatment5. Therefore, an accurate, noninvasive method for identifying patients at increased risk and developing an association model may support earlier clinical assessment. However, any clinical application would require appropriate validation.
Current methods for evaluating pelvic floor function include physical examination, imaging, and pelvic floor electromyography. Physical examination is simple and inexpensive but is subjective and may not quantify subtle structural or functional abnormalities6˒7. Pelvic floor electromyography reflects neuromuscular function but does not directly show morphological changes in pelvic floor anatomy8. Imaging provides structural and functional information and is widely used for pelvic floor assessment9.
Pelvic floor ultrasonography includes two-dimensional (2D), three-dimensional (3D), and four-dimensional (4D) imaging. Two-dimensional ultrasound provides basic morphological information, whereas 3D ultrasound permits reconstruction of the levator ani hiatus and visualization of axial and oblique planes10. Four-dimensional ultrasound enables dynamic assessment during maneuvers such as maximal pelvic floor muscle contraction and Valsalva. Translabial ultrasound provides a noninvasive view of pelvic floor anatomy and can be repeated during follow-up. Compared with magnetic resonance imaging, ultrasound is generally more accessible and less costly; however, measurements remain operator dependent11.
Pelvic floor morphology and organ position change across functional states. Assessment at rest provides a baseline view of anatomy and structural integrity. Maximal pelvic floor muscle contraction permits evaluation of muscle shortening, coordination, and functional reserve12˒13. The Valsalva maneuver increases intra-abdominal pressure and permits assessment of pelvic organ descent and pelvic floor support under strain. Together, these states provide complementary information about pelvic floor structure and function14. Assessment in only one state may therefore provide an incomplete representation of pelvic floor function.
Most previous studies have evaluated a single ultrasound mode, a single functional state, or a specific PFD-related condition15. Machine learning-based models have also been developed for selected PFD-related outcomes, but models addressing PFD as a composite outcome remain limited16. In this study, “combined association” referred to integrating multiple main-effect ultrasound parameters obtained across resting, maximal contraction, and Valsalva states into a weighted model; it did not refer to statistical interaction or synergy among predictors. PFD was defined as a composite outcome in accordance with the Expert Consensus on Diagnosis and Rehabilitation Treatment of Pelvic Floor Dysfunctional Diseases (2024 Edition)17.
Accordingly, this retrospective observational study evaluated multimodal pelvic floor ultrasound parameters obtained at rest, during maximal pelvic floor muscle contraction, and during the Valsalva maneuver in postpartum patients. The study aimed to identify factors independently associated with postpartum PFD and to assess the discrimination and calibration of a combined association model. Because the study was conducted retrospectively at a single center and did not include external validation, the findings should be considered exploratory and hypothesis-generating.
Access restricted. Please log in or start a trial to view this content.
Protocol
The Medical Ethics Committee approved the retrospective use and analysis of data collected between January 2022 and June 2025 under approval number 2026-023 and waived the requirement for informed consent. The research tools used in this protocol are listed in the Table of Materials.
1. Study design
Medical records were retrieved for 175 patients who underwent pelvic floor ultrasound evaluation at the hospital between January 2022 and June 2025. After screening according to the inclusion and exclusion criteria, 172 eligible patients were enrolled. All participants were assessed according to the diagnostic criteria specified in the Expert Consensus on Diagnosis and Rehabilitation Treatment of Pelvic Floor Dysfunctional Diseases (2024 Edition)17. Patients who met at least one diagnostic criterion were assigned to the PFD group, whereas those without identifiable pelvic floor-related manifestations on clinical assessment were assigned to the non-PFD group.
Before propensity score matching (PSM), the PFD group comprised 87 patients and the non-PFD group 85. One-to-one PSM was then performed to balance baseline confounders, resulting in 80 patients in each group. All matched patients were included in the subsequent analyses, and the study workflow is shown in Figure 1.
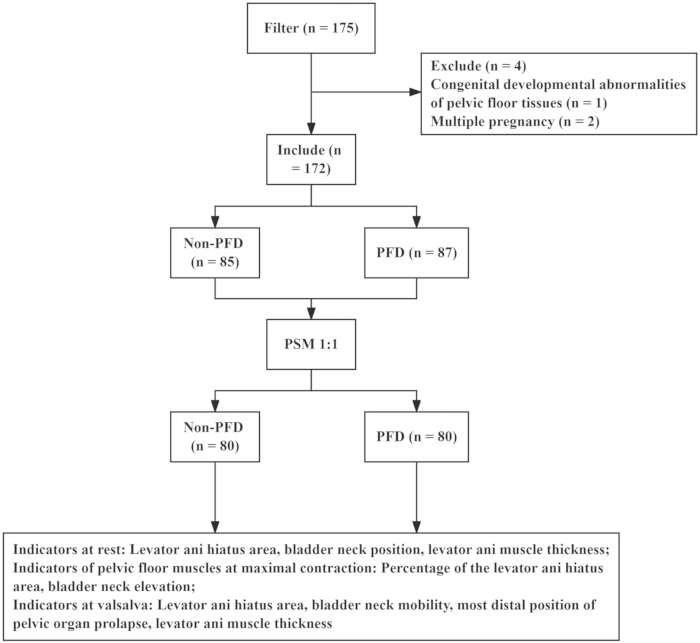
Figure 1: Research flowchart. A total of 175 patients were initially screened. After application of the eligibility criteria, 172 patients were included. Following propensity score matching, 160 patients were retained for analysis, with 80 patients in each group. Please click here to view a larger version of this figure.
2. Inclusion criteria
Patients were eligible if they were 20–45 years of age, had a singleton pregnancy, underwent multimodal pelvic floor ultrasound at 42 days ± 2 weeks after delivery, completed standardized multimodal pelvic floor ultrasound in the hospital’s Ultrasound Department in accordance with the Expert Consensus on Clinical Practical Standardized Examination of Pelvic Floor Ultrasound (2022)18, had complete clinical data, and completed a standardized clinical evaluation of postpartum pelvic floor function in accordance with the Expert Consensus on Diagnosis and Rehabilitation Treatment of Pelvic Floor Dysfunctional Diseases (2024 Edition)17.
Under this consensus, PFD was defined as a nonorganic disorder associated with weakness, defects, or dysfunction of the pelvic floor. Diagnosis was based on clinical symptoms, physical examination, and ancillary testing. Clinical manifestations included pelvic organ prolapse, stress urinary incontinence, urgency urinary incontinence, fecal incontinence, chronic pelvic pain, and sexual dysfunction. Pelvic organ prolapse was staged using the Pelvic Organ Prolapse Quantification (POP-Q) system. Ancillary assessments included pelvic floor ultrasound, urodynamic testing, and pelvic floor electromyography.
3. Exclusion criteria
Patients were excluded if they had a confirmed diagnosis of PFD before pregnancy, congenital pelvic floor abnormalities, or chronic pelvic pain syndrome; neurological disease, connective tissue disease, severe hepatic or renal dysfunction, diabetic peripheral neuropathy, or another systemic disorder; a history of pelvic surgery or poor healing after repair of a severe perineal laceration; more than 2 weeks of postpartum pelvic floor rehabilitation; a multiple pregnancy, fetal malformation, or severe pregnancy complication; or mental illness or cognitive impairment19.
Pre-existing PFD or congenital pelvic floor abnormalities could have confounded the assessment of postpartum pelvic floor changes. Neurological, connective tissue, and metabolic disorders could have independently affected pelvic floor neuromuscular function or tissue elasticity. Previous pelvic surgery or failed perineal repair could have altered pelvic floor anatomy and biomechanics. Postpartum pelvic floor rehabilitation lasting more than 2 weeks could have modified muscle morphology and contractile function. Multiple pregnancy, fetal malformation, and severe pregnancy complications could have increased baseline heterogeneity or altered the course of delivery. Mental illness or cognitive impairment could have affected cooperation with standardized ultrasound maneuvers and symptom assessment.
4. Data collection
Two investigators completed standardized training before data collection and extracted the data independently. Both sonographers had more than 5 years of experience in pelvic floor ultrasound. Training included a 2 h didactic session covering the study protocol, standardized image-acquisition planes, and predefined measurement landmarks; practical sessions using five representative cases; consensus discussions regarding measurement techniques; use of a structured measurement template; and a pilot interobserver agreement assessment.
Before formal data extraction, the sonographers independently assessed 20 non-enrolled cases. Intraclass correlation coefficients for key parameters, including levator ani hiatus area, bladder neck position, and levator ani muscle thickness, exceeded 0.85. Formal extraction then proceeded. During data extraction, one repeat measurement was inserted after every 10 cases as an internal calibration check. Because of the retrospective design, formal interobserver and intraobserver reliability statistics were not calculated for the full cohort. Extracted data included baseline clinical characteristics, multimodal ultrasound parameters, and outcome measures.
5. Outcome classification
The primary outcome was postpartum PFD, assessed at 42 days ± 2 weeks after delivery in accordance with the Expert Consensus on Diagnosis and Rehabilitation Treatment of Pelvic Floor Dysfunctional Diseases (2024 Edition)17 and International Continence Society definitions.
A patient was assigned to the PFD group if she met at least one of the following criteria: pelvic organ prolapse of POP-Q stage II or higher, with the most distal portion of the prolapse located within 1 cm above or below the hymenal ring; stress or urgency urinary incontinence confirmed by a specialist on the basis of medical history and physical examination, including a cough stress test when applicable, with involuntary urine leakage occurring at least once per week during the previous 3 months; or pelvic floor muscle strength below grade 3 on the Modified Oxford Scale during manual vaginal assessment.
Patients who met none of these criteria were assigned to the non-PFD group. Fecal incontinence, chronic pelvic pain, and sexual dysfunction were not used for group assignment.
6. Observation indicators
All ultrasound measurements were performed according to the standardized protocols in the Expert Consensus on Clinical Practical Standardized Examination of Pelvic Floor Ultrasound (2022)18. Baseline pelvic floor ultrasound measurements were retrieved from pre-pregnancy health screening records or routine first-trimester ultrasound examinations performed at ≤12 weeks of gestation. Postpartum ultrasound measurements were obtained from standardized examinations conducted at 42 days ± 2 weeks after delivery.
- Indicators at rest
The levator ani hiatus area was measured using three-dimensional (3D) ultrasound. The hiatus was bounded by the inferior margin of the pubic symphysis and the medial borders of the bilateral levator ani muscles, and the cross-sectional area was recorded20.
Bladder neck position was measured using two-dimensional (2D) ultrasound as the vertical distance from the midpoint of the bladder neck to the inferior margin of the pubic symphysis. In this study, a greater distance indicated a more inferior, or caudal, bladder neck position; that is, the bladder neck was located farther from the pubic symphysis in the caudal direction21.
Levator ani muscle thickness was measured using 2D ultrasound at the midpoint of the pubic segment of the muscle, excluding the surrounding fascia22. - Indicators during maximal pelvic floor muscle contraction
Patients performed maximal pelvic floor muscle contraction, similar to holding urine or stool, for 3–5 s. Dynamic images were acquired using four-dimensional (4D) ultrasound, with 3D reconstruction and 2D localization.
The reduction percentage of the levator ani hiatus area was calculated from measurements obtained at rest and during contraction as follows:
Reduction percentage = (resting area − contraction area) / resting area × 100%23˒24
Bladder neck elevation was measured using 2D ultrasound as the vertical upward displacement of the bladder neck midpoint from rest to maximal contraction25.
Levator ani avulsion was assessed during maximal contraction using 3D volume reconstruction. Continuity at the origin and insertion of the levator ani muscle was evaluated, and each patient was classified as having no avulsion, unilateral avulsion, or bilateral avulsion. The diagnostic criteria followed the Expert Consensus on Clinical Practical Standardized Examination of Pelvic Floor Ultrasound (2022)18. Assessment was performed during contraction because contraction improved delineation of the muscle borders and avulsion defects. - Indicators during the valsalva maneuver
Patients received standardized instructions for performing the Valsalva maneuver while avoiding concomitant levator ani contraction. When necessary, biofeedback training was provided to facilitate pelvic floor relaxation26. Dynamic pelvic floor changes were observed with 4D ultrasound, and 2D and 3D ultrasound were used for measurement and assessment.
The maneuver was performed as forced expiration against a closed glottis, and patients were instructed to push downward as if defecating while consciously relaxing the pelvic floor27. The maneuver lasted at least 6 s and was repeated until an optimal image was obtained27.
The levator ani hiatus area was measured using 3D ultrasound at maximal dilation28. Bladder neck mobility was measured using 2D ultrasound as the maximum vertical displacement of the bladder neck midpoint from rest to the Valsalva maneuver11. Bladder neck elevation during maximal contraction and bladder neck mobility during the Valsalva maneuver were treated as distinct indicators. The former represented active lifting during muscle contraction, whereas the latter represented passive descent under strain.
The most distal position of pelvic organ prolapse was measured using 2D ultrasound relative to the inferior margin of the pubic symphysis, which was defined as the zero point. In accordance with the convention used in this study, the caudal, or inferior, direction was recorded as positive, whereas the cephalic, or superior, direction was recorded as negative. Larger positive values, therefore, indicated a more distal prolapse position and greater prolapse severity29.
Levator ani muscle thickness was measured using 2D ultrasound at the midpoint of the pubic segment during the maneuver30.
7. Statistical analysis
Propensity score matching (PSM) was used to balance confounding factors between the PFD and non-PFD groups. The propensity score model included age, pre-pregnancy body mass index, parity, mode of delivery, duration of labor, fetal weight, degree of perineal laceration, and pregnancy complications. These covariates were selected based on their documented associations with PFD and their availability in the medical records.
Propensity scores were estimated using logistic regression. One-to-one nearest-neighbor matching without replacement was performed using a caliper of 0.02. Only pairs with a propensity score difference of 0.02 or less were matched. Baseline characteristics were compared after matching to assess covariate balance.
Continuous data were assessed using the Kolmogorov–Smirnov test for normality and Levene’s test for homogeneity of variance. Normally distributed continuous data with homogeneous variance were reported as mean ± standard deviation and compared using the independent-samples t-test for between-group comparisons and the paired t-test for within-group comparisons.
Non-normally distributed continuous data were reported as median and interquartile range [M (Q1, Q3)] and compared using the Mann–Whitney U test for between-group comparisons and the Wilcoxon signed-rank test for within-group comparisons. Categorical data were reported as n (%) and compared using the chi-square test.
Because of the limited sample size and collinearity among multiple ultrasound parameters, univariate screening was used as a dimensionality-reduction step. Variables with p < 0.05 in the univariate analysis were entered into the subsequent multivariable logistic regression model. This approach was intended to identify dominant main-effect predictors across the three functional states rather than to test statistical interactions or synergistic effects.
In this study, multimodal combined evaluation involved acquiring ultrasound data across resting, maximal contraction, and Valsalva states and integrating models of significant main-effect variables. A combined association model was constructed using the full matched dataset. A receiver operating characteristic (ROC) curve was generated to assess the model's internal-fit performance in the development cohort, and the area under the curve (AUC), sensitivity, and specificity were calculated. These performance metrics were descriptive measures of model fit in the development cohort and did not represent validated predictive accuracy.
Bootstrap resampling with 1,000 iterations was performed solely to derive empirical standard errors, bootstrap p values, and bias-corrected 95% confidence intervals for the regression coefficients. This procedure was used to assess parameter estimation and coefficient stability. It did not provide optimism-corrected AUC estimates or equivalent adjustments to model-performance metrics and was therefore not considered model validation.
No internal validation, such as a training/test split or k-fold cross-validation, and no external validation in an independent cohort were performed. Consequently, the reported AUC, sensitivity, and specificity reflected discrimination within the development dataset only and remained subject to overfitting. The generalizability and clinical applicability of the model, therefore, remain unproven and require independent validation. All statistical tests were two-sided, and p < 0.05 was considered statistically significant.
8. Sample size calculation
No a priori sample size calculation was performed. The final sample included 80 patients in the PFD group and 80 in the non-PFD group, determined by the number of eligible patients with complete data.
A post hoc power analysis was performed using software. One previous retrospective cohort study included 320 postpartum patients, of whom 114 had PFD and 206 did not, and developed a model based on pelvic floor ultrasound parameters31. Another study used multimodal ultrasound to predict postpartum PFD in 200 patients, including 67 patients with PFD and 133 without PFD32.
Based on the reported between-group differences and model discrimination in these studies, Cohen’s d values for key ultrasound parameters ranged from 0.50–0.80. Using a conservative Cohen’s d of 0.65, a two-sided significance level of α = 0.05, and a type II error rate of β = 0.05, the estimated required sample size was approximately 63 patients per group. The actual sample size of 80 patients per group exceeded this estimate. The minimum detectable effect for levator ani muscle thickness was additionally estimated as 0.07, which was smaller than the observed effect size of 0.701.
Access restricted. Please log in or start a trial to view this content.
Results
Baseline data
Before propensity score matching (PSM), age, neonatal birth weight, and total duration of labor differed significantly between the two groups (all p < 0.05). After PSM, no baseline characteristic differed significantly between the groups (all p > 0.05). These findings indicated that PSM balanced the measured baseline confounders between the groups (Table 1).
Access restricted. Please log in or start a trial to view this content.
Discussion
This single-center retrospective observational study evaluated pelvic floor ultrasound indicators across three functional states. At rest, the PFD group had a larger levator ani hiatus area, a more caudal bladder neck position, and lower levator ani muscle thickness than the non-PFD group. During maximal pelvic floor muscle contraction, the reduction percentage of the levator ani hiatus area and bladder neck elevation were lower in the PFD group, indicating reduced active pelvic floor muscle contraction. During the Valsa...
Access restricted. Please log in or start a trial to view this content.
Disclosures
The authors declare no financial conflicts of interest.
Acknowledgements
The authors have no acknowledgments to report. This study received no external funding.
Access restricted. Please log in or start a trial to view this content.
Materials
| Name | Company | Catalog Number | Comments |
|---|---|---|---|
| G*Power | Heinrich Heine University Düsseldorf | Version 3.1.9.7 | Sample size calculation |
| GE RAB4-8-D transperineal 3D/4D volumetric probe | GE Healthcare | RAB4-8-D | Ultrasound measurement |
| GE Voluson E10 color Doppler ultrasound system | GE Healthcare | GE Voluson E10 | Ultrasound measurement |
| IBM SPSS Statistics | IBM | Version 27.0.1 | Statistical analysis |
References
- Romeikiene KE, Bartkeviciene D. Pelvic-Floor Dysfunction Prevention in Prepartum and Postpartum Periods. Medicina (Kaunas). 2021; 57(4). https://doi.org/10.3390/medicina57040387
- Mantilla Toloza SC, Villareal Cogollo AF, Pena Garcia KM. Pelvic floor training to prevent stress urinary incontinence: A systematic review. Actas Urol Esp (Engl Ed). 2024; 48(4): 319-327.
- Wu JC et al. Pelvic floor dysfunction and electrophysiology in postpartum women at 6-8 weeks. Front Physiol. 2023; 14: 1165583. https://doi.org/10.3389/fphys.2023.1165583
- Fernandes A et al. Conservative non-pharmacological interventions in women with pelvic floor dysfunction: a systematic review of qualitative studies. BMC Womens Health. 2022; 22(1): 515. https://doi.org/10.1186/s12905-022-02104-x
- Sitaraman L, Lewicky-Gaupp C, Rao SS. Postpartum Anorectal and Pelvic Floor Disorders: Evaluation, Treatment, and Prevention. Curr Gastroenterol Rep. 2025; 27(1): 48. https://doi.org/10.1007/s11894-024-00962-w
- Lin Y et al. Transperineal ultrasound versus digital palpation: Identifying key parameters for objective pelvic floor muscle contraction assessment. Acta Obstet Gynecol Scand. 2026; 105(7): 1318-1327.
- Michalik D, Herman U, Stangel-Wojcikiewicz K. Quantitative tools to assess pelvic floor muscle function - systematic review. Ginekol Pol. 2024; 95(9): 718-728.
- Skoura A et al. Diastasis Recti Abdominis Rehabilitation in the Postpartum Period: A Scoping Review of Current Clinical Practice. Int Urogynecol J. 2024; 35(3): 491-520.
- Chen L, Lu C. Image Enhancement Algorithm-Based Ultrasound on Pelvic Floor Rehabilitation Training in Preventing Postpartum Female Pelvic Floor Dysfunction. Comput Math Methods Med. 2022; 2022: 8002055. https://doi.org/10.1155/2022/8002055
- Li M, Wang N, Wang R, Liang B. Ultrasonographic evaluation of diastasis recti abdominis and its association with pelvic floor dysfunction in postpartum women: a cross-sectional study of a two-year retrospective cohort. Front Med (Lausanne). 2024; 11: 1441127. https://doi.org/10.3389/fmed.2024.1441127
- Zhang L et al. Application of Four-Dimensional Pelvic Floor Ultrasound in the Diagnosis of Postpartum Pelvic Floor Dysfunction and Evaluation of Curative Effect. Altern Ther Health Med. 2024; 30(9): 294-299.
- Yao L, Li F, Wang D, Sheng S. Evaluation of acupuncture treatments of postpartum female pelvic floor dysfunction by four-dimensional transperineal pelvic floor ultrasound. Medicine (Baltimore). 2021; 100(42): e27236. https://doi.org/10.1097/MD.0000000000027236
- Lima CTS et al. Pelvic floor ultrasound finds after episiotomy and severe perineal tear: systematic review and meta-analysis. J Matern Fetal Neonatal Med. 2022; 35(12): 2375-2386.
- Ge L, Jiang H, Deng C, Ren Z. The Clinical Significance of Real-Time 3-D Transperineal Ultrasound in the Treatment of Postpartum Pelvic Floor Dysfunction Using a Combined Magnetic and Electrical Repair Approach. Altern Ther Health Med. 2024. https://pubmed.ncbi.nlm.nih.gov/?term=Ge+The+Clinical+Significance+of+Real-Time+3-D+Transperineal+Ultrasound
- Sun HQ, Chen XQ, Chen XL. Nomogram for predicting postpartum pelvic floor dysfunction based on ultrasound and serum biomarkers FGF2 and HBP. Am J Transl Res. 2025; 17(11): 8858-8868.
- Wang L et al. Development and Validation of Machine Learning Models for Risk Prediction of Postpartum Stress Urinary Incontinence: A Prospective Observational Study. Int Urogynecol J. 2025; 36(6): 1217-1228.
- Pelvic Floor Disease Professional Committee of Jiangsu Provincial Association of Integrated Chinese and Western Medicine et al. Expert consensus on diagnosis and rehabilitation treatment of pelvic floor dysfunction. Chin J Clinicians (Electron Ed). 2024; 18(02): 113-121.
- Wang RL. Expert Consensus on Clinical Practical and Standardized Examination of Pelvic Floor Ultrasound (2022 Edition). Chin J Med Imaging. 2023; 31(2): 97-99, 107.
- Qu E et al. The ultrasound diagnostic criteria for diastasis recti and its correlation with pelvic floor dysfunction in early postpartum women. Quant Imaging Med Surg. 2021; 11(2): 706-713.
- Asif Z et al. Levator ani muscle volume and architecture in normal vs. muscle damage patients using 3D endovaginal ultrasound: a pilot study. Int Urogynecol J. 2023; 34(2): 581-587.
- Dellar B, Chung E, Hodges PW. Do Ultrasound Measures of Bladder Neck Location and Movement During Pelvic Floor Contraction or Straining Relate to Bladder Neck Support During Voiding? Neurourol Urodyn. 2026. https://pubmed.ncbi.nlm.nih.gov/?term=Dellar+Do+Ultrasound+Measures+of+Bladder+Neck+Location
- Delgado-Perez E et al. Intra- and inter-rater reliability of ultrasound measurements of the levator ani muscle thickness in and M-mode in asymptomatic individuals: a cross-sectional study. PeerJ. 2025; 13: e19427. https://doi.org/10.7717/peerj.19427
- Li ML, Lu R. Value of detecting morphology and function of the levator ani muscle by transperineal ultrasound in diagnosis of pelvic organ prolapse. Chin J Med Ultrasound (Electron Ed). 2025; 22(3): 209-214.
- Takaoka S, Taniguchi T, Kobayashi Y. Intra- and inter-rater reliability of offline ultrasound measurement of ΔAPD-LH (%) for assessing pelvic floor muscle contraction. Journal of Japan Academy of Midwifery. 2025; 39(3): 467-477.
- Zhuang Y, Yao L, Liu Y. Value of transperineal three-dimensional ultrasonography in diagnosis of pelvic floor dysfunction. Br J Radiol. 2024; 97(1163): 1799-1805.
- Garcia-Mejido JA et al. 2D ultrasound diagnosis of middle compartment prolapse: a multicenter study. Quant Imaging Med Surg. 2022; 12(2): 959-966.
- Mulder FE, Shek KL, Dietz HP. What's a proper push? The Valsalva manoeuvre revisited. Aust N Z J Obstet Gynaecol. 2012; 52(3): 282-285.
- Hilde G et al. Postpartum pelvic floor muscle training, levator ani avulsion and levator hiatus area: a randomized trial. Int Urogynecol J. 2023; 34(2): 413-423.
- Li X, Yan J. Correlation between Clinical Diagnosis of Pelvic Organ Prolapse via Pelvic Floor Ultrasound and Quantitative Staging Method: A Clinical Study. Br J Radiol. 2025. https://pubmed.ncbi.nlm.nih.gov/?term=Li+Correlation+between+Clinical+Diagnosis+of+Pelvic+Organ+Prolapse
- Barca JA et al. 3D Ultrasound in Pelvic Floor: Is It Useful as a Prognostic Tool in Type of Labor Development and Subsequent Pelvic Floor Diseases? Int J Environ Res Public Health. 2022; 19(18). https://doi.org/10.3390/ijerph191811283
- Zhang Y et al. Based on pelvic ultrasound before measuring chamber structure parameters prediction model is build maternal postpartum pelvic floor dysfunction. J Hunan Norm Univ (Med Sci). 2025; 22(4): 66-71.
- Chen Y et al. Predictive analysis of postpartum pelvic floor dysfunction based on multimodal ultrasound observation of pelvic floor structure during pregnancy. Chin J Clin Obstet Gynecol. 2025; 26(5): 425-428.
- Peinado-Molina RA et al. Pelvic floor dysfunction: prevalence and associated factors. BMC Public Health. 2023; 23(1): 2005. https://doi.org/10.1186/s12889-023-16901-3
- de Carvalho M et al. Pelvic floor muscle training in women with urinary incontinence and pelvic organ prolapse: A protocol study. PLoS One. 2024; 19(8): e0308701. https://doi.org/10.1371/journal.pone.0308701
- Quaghebeur J, Petros P, Wyndaele JJ, De Wachter S. Pelvic-floor function, dysfunction, and treatment. Eur J Obstet Gynecol Reprod Biol. 2021; 265: 143-149.
- Jorge CH et al. Pelvic floor muscle training as treatment for female sexual dysfunction: a systematic review and meta-analysis. Am J Obstet Gynecol. 2024; 231(1): 51-66 e51.
- Mustapha SG, Hussain MN. Cortisol Signaling in Stress-Induced Pathophysiology: Molecular Mechanism and Therapeutic Implication. Adv Mod Biomed. 2025; 1(4): 1-14.
- Braga A, Serati M. New Advances in Female Pelvic Floor Dysfunction Management. Medicina (Kaunas). 2023; 59(6). https://doi.org/10.3390/medicina59061105
- Cattani L et al. Pelvic Floor Ultrasound Findings and Symptoms of Pelvic Floor Dysfunction During Pregnancy. Int Urogynecol J. 2024; 35(12): 2423-2430.
- Coppola C et al. Ultrasound Diagnosis of Levator Ani Hiatus Enlargement and Cystocele in Standing and Supine Positions in the Postpartum Period. J Ultrasound Med. 2025; 44(4): 681-689.
- Siafarikas F et al. Levator ani muscle avulsion and subsequent vaginal delivery: 8-year longitudinal follow-up. Ultrasound Obstet Gynecol. 2024; 64(1): 112-119.
Access restricted. Please log in or start a trial to view this content.