This protocol presents a comprehensive, end-to-end untargeted metabolomics workflow using Volumetric Absorptive Microsampling (VAMS) devices. The goal is to efficiently analyze the sample using a single extraction across two complementary analytical platforms (RP-LC-MS and GC-MS), establishing a robust framework for large-scale, decentralized clinical studies.
Method Article
A Comprehensive Dual Platform, End-to-end Workflow for Metabolic Profiling of Dried Blood Microsamples
In This Article
Summary
Abstract
Blood microsampling (BµS) has emerged as a robust, minimally invasive alternative to traditional venipuncture, enabling the collection of low-volume specimens outside conventional clinical settings. By supporting decentralized sampling and improving patient adherence, these devices can be integrated with advanced omics technologies to facilitate large-scale and longitudinal study designs. However, successful implementation requires optimization of multiple critical steps, from sample collection and storage to extraction and analytical preparation. In this work, we propose a comprehensive end-to-end untargeted metabolomics workflow for BµS, with an emphasis on key parameters governing sample preparation and analytical performance. Volumetric absorptive microsampling (VAMS) devices were evaluated using two complementary platforms: reversed-phase liquid chromatography coupled to mass spectrometry and gas chromatography coupled to mass spectrometry. Application of the optimized workflow demonstrated broad metabolomic coverage across diverse chemical classes, highlighting the potential of VAMS-based sampling to support scalable, decentralized metabolomics studies while maintaining analytical robustness, reproducibility, and biological relevance.
Introduction
Metabolomics, the systematic study of low-molecular-weight molecules in biological matrices, has attained significant prominence as a critical tool for elucidating cellular phenotypes and dynamic metabolic states1,2. In clinical settings, blood metabolomics holds great promise by enhancing diagnostic efficiency and enabling more comprehensive disease risk assessment, frequently bridging gaps left by conventional diagnostics. However, capturing the full metabolome is inherently challenging. Given the vast chemical complexity and diverse concentration ranges of endogenous metabolites, no single analytical platform can achieve complete coverage, making the deployment of complementary analytical techniques essential for maximizing metabolic overview.
Blood Microsampling (BµS) is a minimally invasive sample collection technique that involves collecting a few µL of blood. Its simplified sample acquisition eliminates the need for phlebotomy, allowing for in-home collection and enhancing patient comfort. Furthermore, the transition from a liquid to a dried matrix has been shown to enhance the stability of various labile metabolites and simplify transport and storage logistics since cold temperatures are not required3,4,5. While BµS has been used for decades, primarily as Dried Blood Spots (DBS) for the diagnosis of inborn errors of metabolism, this classic technique has some analytical drawbacks. The collection procedure doesn't allow for quantitative sample collection, making the technique prone to the “hematocrit effect,” in which variations in blood viscosity alter the distribution of blood, thereby compromising quantitative accuracy. To overcome this limitation, quantitative BµS devices have been developed. Volumetric absorptive microsampling (VAMS) is a recent BµS technology that utilizes a polymeric tip designed to sample an accurate volume of blood and overcome the limitations of traditional DBS6,7,8.
Consequently, the global metabolic profile of BµS has attracted increasing interest in recent years9,10,11,12,13,14,15,16,17,18,19,20,21. Published works comparing BµS with traditional matrices use several analytical techniques, covering a broad range of polarities, from Capillary Electrophoresis17 (CE) and Hydrophilic Interaction Liquid Chromatography18,19(HILIC) coupled to mass spectrometry (MS) for polar species to Reversed-Phase-Mass-Spectrometry18,19,21(RP-MS) for mid-polarity metabolites and lipids. Traditional extraction methods face a fundamental bottleneck: optimizing for a single instrument often means discarding crucial chemical fractions and losing metabolic data. When sample volumes are highly limited, running multiple separate analyses is challenging. Thus, developing a single extraction protocol compatible with multiple analysis platforms remains a significant hurdle.
This workflow details the procedures for the dual RP-LC-MS and Gas Chromatography (GC) analyses of VAMS devices. To our knowledge, this is the first workflow for untargeted metabolic profiling of BµS that combines these two orthogonal platforms using a single sample-extraction procedure. Furthermore, it highlights the most critical steps required to ensure the reliable and reproducible acquisition of a comprehensive untargeted metabolic profile.
Protocol
All participants provided written informed consent to participate. The study was approved by the Research Ethics Committee of the Aristotle University of Thessaloniki (#306272/2022).
1. Sample collection
- Wash the subject's hands with warm water to remove potential contaminants and increase blood flow.
- Clean the finger using a 70% ethanol solution. Wait until the solution has naturally evaporated.
NOTE: The use of iodine-based disinfectants or soap may interfere with LC-MS analyses. - Twist off the cap of a sterile, single-use contact-activated lancet (1.5 mm depth). Place it against the center of the fingertip and press.
- Wipe away the first drop of blood and wait for a new drop to form.
NOTE: Due to possible contamination by localized extracellular fluid, the first drop may not reflect systemic circulating levels. - Without removing the device from its holder, touch the 20 µL tip of the VAMS device to the drop of blood. The device should be positioned vertically above the sample. Avoid completely submerging the tip into the blood, as this could lead to oversampling.
NOTE: When sampling from a tube containing venous blood, as may be necessary in a laboratory environment, ensure the tip touches only the surface of the liquid, without submerging it, to avoid oversampling. - After the saturation of the tip, achieved when it has been completely turned red, hold it in place for two extra seconds, then remove it from the blood sample.
- Place the samples in their original boxes on a flat, clean surface, away from direct sunlight or heat, while preventing the tip from touching any external object, and allow them to dry for 2 h at room temperature in ambient humidity.
- Store the samples in a bag with desiccant at −80 °C until the time of the analysis. Transport must be made under dry ice.
NOTE: In cases of targeted analysis of BµS in which the stability of the analyte has already been investigated, the samples may be stored at room temperature for the suggested time. However, for untargeted analysis, storage at –80 °C is recommended, as some analytes remain prone to degradation even in the dried matrix. A troubleshooting table for the most common problems in sample collection is shown in Table 1.
2. Metabolite extraction procedure
- Detach the entire tip from the plastic handler and place it into a round-bottom microcentrifuge tube (use the cap of a microcentrifuge tube to detach the tip from the handle).
- Rehydrate by adding 50 µL of ultrapure water directly onto the tip.
- Add 400 µL of methanol containing an IS mix (e.g., isotopically labeled D-Myristic acid) to extract the metabolites and promote protein precipitation.
NOTE: CAUTION: Methanol is toxic and highly flammable. It should be handled in a fume hood. - Sonicate the samples in an ice bath for 10 min under continuous operation (Recommended potency 215/860 W, frequency 35 kHz).
- Carefully remove the tip with tweezers, cleaning them with methanol between samples.
- Centrifuge at 6720 x g for 10 min at 4 °C.
- Transfer 150 µL of the supernatant to new tubes. Use the same volume for every sample. Use a new microcentrifuge tube for the RPLC analysis, and a new 1.5 mL glass vial for the GC analysis.
- Transfer 50 µL from each sample supernatant into a single vial to prepare a pooled intra-study QC sample.
- Vortex briefly to ensure complete homogenization and then partition into multiple aliquots of the same volume as study samples. Use a new microcentrifuge tube for the RPLC analysis, and a new 1.5 mL glass vial for the GC analysis.
- Evaporate the supernatants to dryness using a vacuum concentrator, in aqueous evaporation mode, under a vacuum level of −600 mmHg (−800 mbar), a rotation of 1400 rpm, at room temperature. The samples are dried in approximately 2 h.
NOTE: Carefully monitor evaporation and remove the vials from the concentrator to prevent loss of volatile compounds once the solvent has completely evaporated. Pause point: Samples can be frozen at −80 °C in dried form overnight until analysis.
3. Procedure prior to LC-MS analysis
- Reconstitute the dried residue in 100 µL of a reconstitution solvent like the initial mobile phase (e.g., 5–10% methanol in water).
NOTE: The volume and reconstitution solvent may be adjusted based on the chromatographic conditions. - Reconstitute QC in the same solvent and volume as the study sample (keep always same sample to solvent volume ratio).
- Vortex briefly and transfer to the centrifuge for 10 min at 6720 x g at 4 °C.
- Transfer the supernatant into an autosampler vial with an insert.
4. Procedure prior to GC-MS analysis
NOTE: All the following steps should be performed in a fume hood.
- Prepare the methoxyamination agent by dissolving 40 mg of methoxyamine hydrochloride into 1 mL of pyridine.
NOTE: CAUTION: Pyridine is toxic. It should be handled in a fume hood. - Prepare the derivatization agent by adding 10 µL of trimethylchlorosilane (TMCS) to 1 mL of N-Methyl-N-(trimethylsilyl)trifluoroacetamide (MSTFA).
NOTE: CAUTION: TMCS and MSTFA are both toxic. They should be handled in a fume hood. - Add 10 µL of the methoxyamination agent (Methoxyamine hydrochloride 40 mg/mL in pyridine) into the dried residues of the test samples and QC samples.
- Vortex the samples briefly to ensure the reagent is thoroughly mixed.
- Incubate the samples at 30 °C for 90 min. Incubation is performed statically.
- Wait for the samples to cool down to room temperature, then add 90 µL of the derivatization agent (MSTFA 1% TMCS).
- Change the vial caps to new ones and vortex the samples for 30 s to ensure a homogeneous mixture.
- Incubate the mixture at 37 °C for 30 min. Incubation is performed statically.
- Wait for the samples to cool down to room temperature, then add 10 µL of injection standard (e.g., pentadecane 6.25 mg/L in pyridine) to each sample.
- Change the vial caps to new ones, vortex briefly, and transfer the final mixture into glass chromatography vials with micro-inserts.
- Load the vials into the autosampler tray.
- Allow the samples to equilibrate in the autosampler for 4 h at room temperature prior to the first injection.
NOTE: Derivatization is completed after 4 h, and metabolites are stable at room temperature up to 24 h after complete derivatization. Adjust the number of samples in each batch accordingly so that samples are not left at the autosampler for more than 28 h (after the addition of MSTFA 1% TMCS). Schematics of the sample preparation methods are shown in Figure 1A–C.
5. RP-LC-MS Configuration
- Prepare the RP eluents and wash solutions following Table 2.
NOTE: CAUTION: Formic acid and isopropanol are flammable. Formic acid is also toxic. Both should be handled in a fume hood. - Install the HSS T3 C18 (100 mm x 2.1 mm, 1.7 µm) column in the column oven.
- Put all the lines into the corresponding channel and purge each channel accordingly.
- Set the column temperature to 40 °C.
- Start flushing the column with 100% A:0% B with a flow rate of 0.1 mL/min.
- Increase the flow rate at 0.1 mL/min steps, waiting for the column pressure to stabilize between steps, until the 0.35 mL/min flow is reached. Check for leaks.
- Equilibrate the column at the initial conditions of the gradient (0% B) for about 30 min.
NOTE: Monitor the column pressure and ensure it remains within the expected range (5000–6000 psi). - Start the sample sequence.
6. GC-MS Configuration
- Install the DB-5 capillary column (5% – phenyl-methyl-polysiloxane) in the column oven.
- Set the column at the initial temperature of 60 °C.
- Set the PTV injector at the initial temperature of 110 °C.
- Start the sample sequence.
Results
Representative outcomes from the untargeted analysis of VAMS devices, following the procedure described above, are presented here.
The data from the triplicate analysis of a pooled sample prepared from venous blood of 10 individuals, sampled by VAMS, were evaluated, and the characteristics of the resulting metabolic fingerprints are shown. The quality of the data and the captured information from the VAMS devices were assessed using two primary criteria: the total number of detected chemical features and the reproducibility of the features (n = 3), expressed as the percentage relative standard deviation (%RSD). The total number of features was used to assess the breadth of extraction and chemical coverage of the solvent, while the %RSD was monitored to ensure the method's technical precision and robustness; a lower %RSD indicates a highly reproducible extraction process that minimizes analytical noise.
After raw data extraction and processing, a matrix of m/z-retention time (RT) features, along with their intensities, was obtained. Only features with a detectable signal in two out of three replicates were considered, after proper pre-processing and blank-filtering steps. Figure 2A,B displays m/z-over-RT plots for the same sample analyzed according to the described protocols for both LC-MS and GC-MS.
The high number of features eluted early in the RPLC run is attributed to highly hydrophilic metabolites extracted by the applied protocol but poorly retained on the reversed-phase column. Although early-eluting metabolites pose identification challenges, accurate annotations are still possible by using MS/MS fragmentation data alongside comparisons with spectral databases and in-house reference standards. Furthermore, a significant portion of this hydrophilic fraction is expected to be captured via GC-MS analysis. Ultimately, this represents an inherent limitation of the field, as the sheer complexity of the metabolome necessitates the use of multiple analytical platforms.
The multi-platform evaluation of the methanolic extracts clearly demonstrates the highly complementary nature of the LC and GC analytical workflows, with the performance metrics within the expected range for a comprehensive metabolomics profiling. Figure 3A,B depicts the overall feature numbering and the RSD% distribution for each platform. The LC platform provided extensive chemical coverage, resolving 4,169 features, which aligns with its established capacity to capture a vast array of polar, semi-polar, and non-volatile compounds. Concurrently, the GC platform displayed a smaller subset of features, with 187. This was expected, since GC can only detect volatile compounds amenable to derivatization.
Regarding reproducibility, as shown in the violin plot, the overall distribution and spread of RSD% values are remarkably similar between LC-MS and GC-MS. The average %RSD was typical for both platforms, at around 29.7% for LC (2,655 out of 4,169 had an %RSD lower than 30%) and 32.3% for GC (114 out of 187 had an %RSD lower than 30%). While a small number of features did display higher RSD values on both sides, this variation is common and expected in untargeted metabolomics. These higher values typically belong to low-abundance metabolites that are close to the instrument's limit of detection. Overall, the tight distribution profiles confirm satisfactory reproducibility for both analytical setups.
The chemical space of metabolites captured by the protocol can be considered by the metabolite’s annotations. Various compounds were detected by LC-MS and GC-MS, as expected given the inherent complementarity of the two platforms. A complete list of metabolite annotations for VAMS devices is provided in Supplementary Table 1 and Supplementary Table 2. In total, 97 metabolites were detected and annotated (level 1 and 2, as proposed by Sumner et al. (2007)22) by this protocol via the two techniques, in addition to other level 3 putatively characterized compounds. GC annotations were further confirmed by comparing the experimental retention indexes – obtained through comparison with FAMES – with tabulated ones23. Figure 4A,B shows the subclass distribution of the annotated metabolites for both methods, while Figure 4C shows the overlap between the techniques, highlighting their complementarity. Few key intermediary metabolites can be cross-validated by both techniques, while structurally unique or platform-specific features can fill gaps in central carbon and secondary metabolic pathways. Although amino acids and peptides are the major chemical classes in both analyses, only a few metabolites overlap between the techniques. Many metabolite classes are instrument-specific, such as acyl carnitines in LC-MS and hexoses in GC-MS.
To demonstrate the efficiency of methanol as an extraction solvent for both techniques, comparative trials were performed on VAMS samples using various solvent systems, followed by LC-MS and GC-MS analyses. Three distinct solvent systems were compared with methanol in triplicate: pure acetonitrile (ACN), a methanol–water mixture (60:40, v/v), and an acetonitrile–methanol mixture (70:30, v/v). The selection of these solvents and mixtures was informed by preliminary experiments conducted by our group, as well as previously published literature13,14,24,25. The extraction efficiency of each system was evaluated using three key parameters: the total number of detected features, overall feature intensity, and feature reproducibility, expressed as the relative standard deviation (RSD, %).
For the LC-MS workflow, the highest number of features was detected using MeOH-H2O (60:40, v/v), with an average of 4,514 features across triplicates, followed closely by pure MeOH (4,169 features). The ACN–MeOH (70:30, v/v) mixture yielded an average of 3,502 features, while pure ACN yielded the lowest average feature count, 2,836. A graphical representation of these feature counts per replicate is illustrated in Figure 5A.
To examine precision characteristics for each extraction condition, feature intensities and RSDs (%) from triplicate injections were analyzed. A comparison of the total feature abundance and the average %RSD per extract solvent for LC-MS is shown in Figure 5A. The log2 signal distributions were similar for all extracts, with MeOH-H2O 60:40 (v/v), ACN, and MeOH yielding slightly higher abundances than ACN-MeOH 70:30 (v/v). MeOH yielded a lower overall average %RSD, indicating that the extraction was more reproducible with this solvent.
A similar assessment of the efficiency of the extraction solvent system was performed in the GC-MS data. Once more, for the evaluation of the number of features, only those with a signal detected in at least two out of three replicates were considered. The solvent yielding the highest number of features was ACN-MeOH 70:30 (v/v) (216 features) followed closely by MeOH (187 features). A graphical illustration of the number of detected features per extraction solvent and BµS is shown in Figure 5B.
Regarding the overall abundance of the detected features, MeOH appeared to be the most efficient, yielding higher abundance, as shown in Figure 5B. MeOH-H₂O 60:40 (v/v) was the second best, followed by ACN-MeOH 70:30 (v/v). ACN was the least effective solvent. Regarding feature %RSD, MeOH-H₂O 60:40 (v/v) provided the lowest RSDs for VAMS (RSD = 38.57%), closely followed by ACN (42.65%), MeOH (44.14%), and ACN-MeOH 70:30 (v/v) (49.14%). These values are represented in Figure 5B.
The above align well with previously published literature. Couacault et al. (2026)19 reported a comparable number of features in the RP-LC-MS analysis of DBS and VAMS using a similar extraction solvent composition (rehydration with 80 µL of water, followed by the addition of 320 µL of MeOH). Similarly, Cala et al. (2017)11 detected a comparable feature count (153) via GC-MS analysis of VAMS tips. Although most existing studies did not evaluate the precision of these devices' analyses, our overall findings align with expectations for an untargeted analysis. Furthermore, the LC results agree with those reported by Bossi et al. (2025)26 for the HILIC analysis of DBS and qDBS microsamples, in which most detected features had RSDs < 30%.
Overall, these results demonstrate that methanol-based extraction provides a robust balance of feature counts, intensity, and precision (average RSD, %) for both LC-MS and GC-MS analysis of VAMS samples. Therefore, a single methanol extraction protocol can streamline dual sample preparation, facilitate the parallel acquisition of complementary metabolic profiles, and maximize information output.
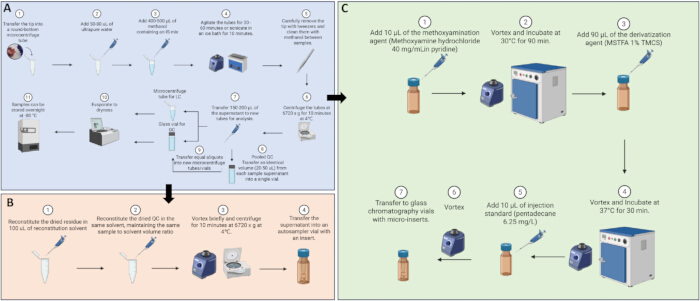
Figure 1: Protocol schematics showing (A) Sample extraction protocol, (B) LC-MS reconstitution, and (C) GC-MS/MS derivatization. Created in BioRender. Marques, D. (2026) https://BioRender.com/dprdv18, https://biorender.com/xu2qh34, https://biorender.com/7ztz2qv. Please click here to view a larger version of this figure.
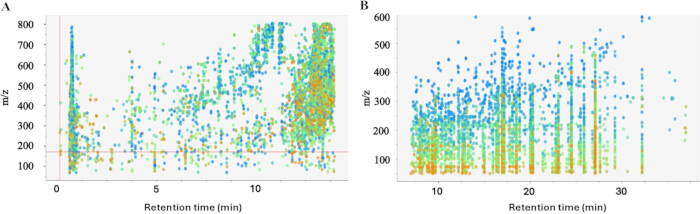
Figure 2: m/z and rt comparisons of a representative sample for (A) LC-MS and (B) GC-MS analysis. Each dot represents a single signal before it is grouped into features. The colors represent the intensity of the MS1 signal for a given feature, with intensity increasing from blue to red. Please click here to view a larger version of this figure.
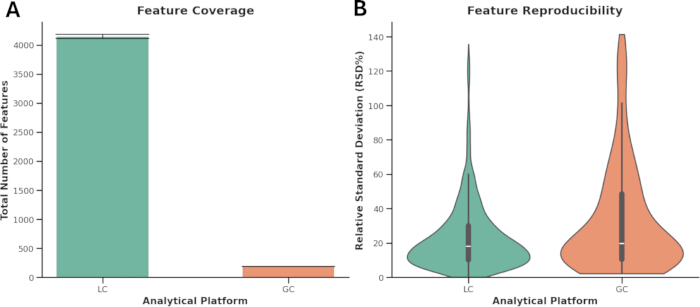
Figure 3: Feature coverage and reproducibility across analytical platforms. (A) Feature Coverage: Total number of unique features detected by LC (teal) and GC (orange), with exact counts annotated above each bar. (B) Feature Reproducibility: Violin plots showing the distribution density of relative standard deviations (RSD%) for all features. Embedded box plots indicate the median and interquartile ranges; individual data points are omitted for visual clarity. Please click here to view a larger version of this figure.
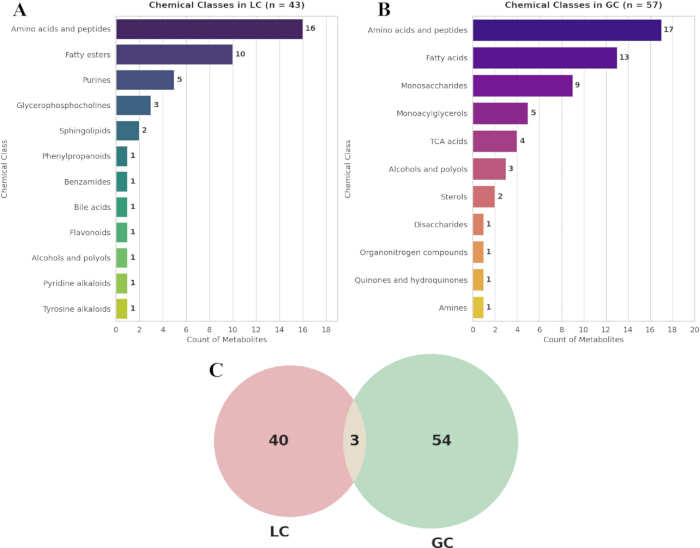
Figure 4: Histograms showing the number of compounds of the different chemical classes detected by (A) LC-MS and (B) GC-MS. (C) Overlap of metabolites annotated by levels 1 and 2 between platforms. Please click here to view a larger version of this figure.
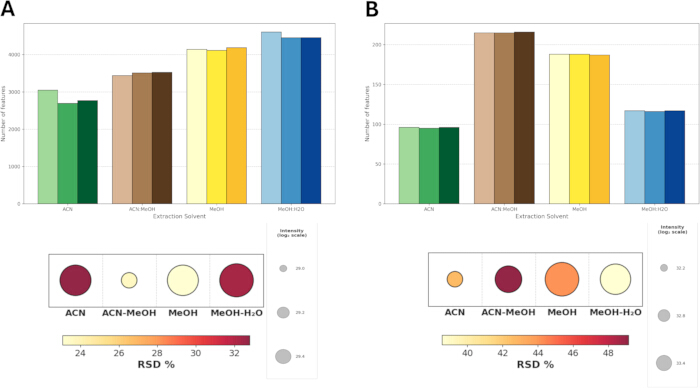
Figure 5: Extraction solvent results from the LC-MS (A) and GC-MS (B) analysis of VAMS devices. The bar plots on the top of the figure represent the number of features yielded from each extraction solvent applied to VAMS devices per replicate. The plots at the bottom of the figure show the sum of intensities and the average RSD (%) for each extraction solvent used with the VAMS device. Circle size represents the total sum intensity of detected features on a log2 scale, reflecting the extraction efficiency. The color gradient indicates analytical precision, expressed as the Relative Standard Deviation (RSD), with yellow representing higher precision and red indicating greater variability. Please click here to view a larger version of this figure.
Table 1: Troubleshooting table. Overview of common sampling problems, reasons, and solutions of sampling using VAMS devices. Please click here to download this file.
Table 2: RP eluents and wash solutions. Overview of the mobile phases, seal wash, purge solvent, and wash solvent compositions utilized for chromatographic analysis. Please click here to download this file.
Supplementary File 1: Additional Experimental Details. LC-MS and GC-MS parameters. Please click here to download this file.
Supplementary Table 1: LC-MS annotations. Compounds identified with the current protocol on the LC-MS platform. Please click here to download this file.
Supplementary Table 2: GC-MS annotations. Compounds identified with the current protocol on the GC-MS platform. Please click here to download this file.
Discussion
Untargeted metabolomics offers a unique insight into the chemical composition of biological samples. However, given the large chemical diversity of the metabolome, no technique can completely characterize the small molecules present in blood. Therefore, the use of complementary techniques is necessary to increase metabolite coverage and improve the overall information from those studies. However, the small volume of blood microsamples, such as VAMS, renders sample prep for different analyses challenging.
In this protocol, a comprehensive workflow for metabolic profiling of VAMS tips using dual extraction and two complementary analytical techniques is presented. Although previous works performing untargeted analysis on VAMS samples have been published11,12,13,15,17,18,19,20,21,27, each focuses on a single analytical technique. This is the first protocol that adapts the extraction of VAMS devices to support both LC and GC-MS analyses within a single workflow.
This protocol provides specific volumes of solvents and extracts to generate the presented results; slight modifications can be tailored to individual setups based on equipment sensitivity, available injection volumes, and QC sample requirements. For instance, the rehydration volume of water added in step 2.2 could be changed from 50 to 80 µL, to ensure the tip is fully wet. The volume of methanol in step 2.3 could be increased from 400 to 500 µL to obtain a larger extract volume for aliquoting into more QC samples. It should be noticed, however, that increasing the solvent volume will lead to higher dilution of the analytes. Furthermore, the volumes aliquoted for the analysis and QC samples in steps 2.7 and 2.8, respectively, can be adjusted (from 150 to 200 µL in step 2.7 and from 20 to 50 µL in step 2.8) to match the desired volume for each sample. Notably, these solvent volumes can be adjusted freely without requiring proportional scaling. Although a standard 3:1 solvent-to-sample ratio is typically sufficient for complete extraction, this method uses a larger excess of solvent to ensure the entire BµS device remains fully submerged, making the protocol robust and directly applicable across all suggested volumes.
Both LC-MS and GC-MS data can be analyzed using various open-source software tools. Herein, the LC-MS results were obtained using the Metabonaut workflow28 with XCMS. For the GC-MS samples, data processing was performed using MSDial v. 5.5.260323. Tutorials can be found at (https://systemsomicslab.github.io/mtbinfo.github.io/MS-DIAL/tutorial.html). Detailed parameters for data processing of LC-MS and GC-MS are provided in Supplementary File 1.
It is recommended to process each dataset individually, using the QC samples in a separate batch to optimize processing parameters before applying them to the entire dataset. Normalization should be performed after data preprocessing. Both XCMS and MSDial have built-in tools for normalization. For the present work, normalization was performed with the open-source software QCMXP29, using a linear model based on QC responses.
Some critical steps, mainly in the sample preparation part, must be highlighted to ensure the outcomes are trustworthy.
The current protocol was developed using an LC system coupled to a quadrupole time-of-flight mass spectrometer (LC-QTOF-MS) and a gas chromatography–mass spectrometry (GC-MS) system, with parameters listed in Supplemental Material S1. If a different LC or GC type is used, the parameters need to be optimized for the specific setup. In GC- and LC-MS-based metabolomics analyses, blank injections should be scheduled at the beginning and end of the analytical batch. Before injecting any QC samples, conditioning QCs must be injected 10 to 15 times in the LC-MS system and 5 to 10 times in the GC-MS system to condition the column with the matrix to be analyzed. Conditioning QCs must be prepared following the same procedure as the other QCs. Intra-study QC samples should be injected periodically and comprise around 10% of the injected solutions.
Handling the VAMS tips is one of the most critical steps in this workflow. It is important that the tip doesn’t touch any surfaces other than the interior of the microcentrifuge tube, as this might cause analyte loss. Furthermore, the pre-hydration step is essential for proper analyte extraction: While initial rehydration appears to enhance recovery by facilitating analyte release prior to precipitation, it is hypothesized that adding organic solvents directly triggers immediate protein precipitation within the tip's structure, creating a physical barrier that limits subsequent metabolite extraction.
Furthermore, one must ensure the tip is removed before the centrifugation step. Although this might lead to a small loss of solution, failing to do so affects the recovery of the supernatant. The tip can easily resuspend the precipitate, rendering the collection of a clean supernatant impossible.
Some general concerns regarding stability should be raised to ensure the best outcomes. Firstly, samples should be stored under refrigeration, preferably at −80 °C until the time of analysis. Thawing the samples under an ice bath or in a fridge is recommended. To prevent degradation, it is recommended to inject the sample into the chromatographic system as soon as possible. However, if injection isn't possible due to time constraints, the dried extract can be frozen overnight without considerable loss to stability.
Some steps in the GC-MS workflow must also be highlighted. The derivatization process is composed of two steps. The first one is methoxyamination, which protects ketone groups that undergo carboxyl loss as carbon dioxide if left unprotected. This is followed by trimethylsilylation. The MSTFA reacts with molecules containing acidic protons, which are common in carboxyl, hydroxyl, amino, imino, and sulfonyl groups. Such a reaction reduces analyte polarity and introduces a large, hindering group, thereby lowering their boiling point23. It is crucial that the sample is completely dry before adding methoxyamine, as water can interfere with analyte protection. One should also be aware that leaving the samples to stabilize at room temperature after removing them from the oven is important, as opening the vial before then can cause the loss of volatile metabolites. Furthermore, the GC caps may dilate upon heating, which can lead to improper sealing of the vial and loss of analytes over time. For that reason, is recommended to change the GC cap after every incubation step.
Still, regarding the GC-MS protocol, some considerations must be made regarding the derivatization time. It has been shown that metabolites continue to react even after being removed from the oven, reaching a plateau in concentration after 4 h. This plateau is stable for up to 24 h after complete derivatization30,31. Therefore, it is very important to organize sample preparation to ensure that derivatized samples remain in the autosampler for no more than 28 h after the reaction with MSTFA. For large analytical batches, it is recommended that all samples be prepared simultaneously to reduce inter-day variability in sample preparation and ensure that aliquots from every sample can be pooled into the QC mix. The samples can be stored as dried residues at −80 °C, and only those to be analyzed within the next 24 h should be thawed and derivatized27. It is also recommended to cover the vials with laboratory film to prevent the sample from absorbing moisture in the freezer. Lastly, it is recommended to use freshly prepared derivatization solutions and to follow the general guidelines for quality assurance in metabolomics analysis across both methodologies to ensure trustworthy results32.
While comparing the present workflow to traditional plasma analysis falls outside the scope of this work, this topic has been extensively explored in the literature17,18,19,20,21,27. Generally, VAMS devices provide qualitative profiles comparable to plasma, but abundances vary between matrices in analyte-specific ways, even at equivalent volumes (20 µL). These differences are likely due to the cellular component present in the BµS, differences between capillary and venous blood, or interference from the dried matrix in the analysis. This necessitates validation of the findings from the BµS devices before their application in clinical practice.
To adapt the proposed protocol for routine high-throughput laboratory workflows, several modifications and troubleshooting strategies can be implemented. First, extraction solvent volumes may be scaled up, particularly when preparing larger batches of QC samples. One should bear in mind, however, that increasing the extraction volume inherently dilutes the sample, potentially reducing intensity unless the subsequent reconstitution volume is adjusted proportionally. Additionally, the reconstitution solvent composition for liquid chromatography can be optimized to match the initial mobile phase gradient of specific instrument configurations.
The primary limitation of this protocol is the small sample size. Because a single 20 µL sample is split for analysis on two different systems, low-abundance compounds may fall below detectable levels on the less sensitive instrument. Nevertheless, this drawback is outweighed by the convenience of sample collection offered by BµS and the broader chemical coverage afforded by complementary techniques. Additionally, while the protocol's evaporation step could theoretically cause the loss of volatile compounds, its actual impact on volatiles has not been assessed. Even so, because evaporation is essential for sample derivatization and allows for reconstitution in a smaller volume to enhance LC sensitivity, its practical benefits outweigh any potential signal loss. Although previous studies have addressed untargeted microsample analysis7,11,12,13,15,17,18,19,20,27 this protocol is, to the authors' knowledge, the first complete workflow for analyzing volumetric absorptive microsampling (VAMS) devices across LC and GC-MS analysis from a single extraction.
Furthermore, evaluating additional metrics would further strengthen these findings. First, validating the results through a multi-laboratory comparison using the exact same dual-platform protocol would confirm the method's robustness and assess performance across different LC-MS and GC-MS instruments. Additionally, the current study did not evaluate operator-to-operator variability during sample preparation or sample collection. Finally, further analysis exploring storage effects on sample integrity and hematocrit effect represents key areas where the current investigation could be expanded. Given that, in untargeted analysis, we prioritize breadth of metabolite coverage and relative comparisons across samples, individual differences in specific metabolites across diverse chemical classes do not compromise data validity. Hematocrit and storage effects should therefore be studied under that aspect. Such data are scarce, aside from a study by Volani et al. (2023), which showed that VAMS devices remain stable at −80 °C for 6 months24.
Disclosures
The authors have no competing interests to declare that are relevant to the content of this article.
Acknowledgements
This work was supported by the HUMAN-HORIZON-MSCA-2021-DN-01. The project was funded by the European Union Horizon 2020, Marie Curie Actions, grant number 101073062. The authors would like to thank Dominiki Gallou for her support during the video shooting.
Materials
| Name | Company | Catalog Number | Comments |
|---|---|---|---|
| 1.5 mL Glass Vials | Lab Solutions | ACSV0902A | Used for transferring and evaporating the GC fraction, performing derivatization reactions, and final GC injection. |
| Acetonitrile (AcN) | VWR BDA Chemicals | BDH92497.320 | LC-MS grade. Evaluated as an extraction solvent component. |
| D27-Myristic acid | Sigma Aldrich | 366889 | Added into the methanol extraction solvent to monitor extraction efficiency and analytical performance. |
| DBS-5 Capillary Column (5% - phenyl-methyl-polysiloxane) | Agilent Technologies | 122-5332UI | Gas chromatography capillary column installed in the GC oven for GC-MS analysis. |
| Eppendorf Concentrator plus | Eppendorf | 5.3E+09 | Used to evaporate sample supernatants to absolute dryness prior to storage or reconstitution/derivatization. |
| Fatty acids methyl ester standard mix | Sigma Aldrich | SMB00937-1ML | Used to obtain the retention indexes of the metabolites for GC annotation. |
| Formic Acid | VWR BDA Chemicals | PI85178 | LC-MS grade. Used as a 0.1% additive in Mobile Phases A and B for RP-LC-MS. |
| HSS T3 C18 Column (100 mm x 2.1 mm, 1.7 µm) | Waters Corporation | 1.9E+08 | Reversed-phase liquid chromatography column installed in the column oven for RP-LC-MS/MS analysis. |
| Isopropanol | Chem-Lab | CL00.0926.2500 | LC-MS grade. Component of the seal wash solution (H2O:Isopropanol 80:20 v/v). |
| Labfilm | Parafilm | PM-996 | Used to wrap and cover the vials during storage at -80°C to avoid intake of humidity. |
| Methanol (MeOH) | VWR BDA Chemicals | AA47192-K2 | LC-MS or GC-MS grade. Used for extraction solvent optimization, internal standard preparation, and mobile phases. |
| Methoxyamine Hydrochloride | Sigma Aldrich | 89803 | Used to prepare the methoxyamination agent (40 mg/mL in pyridine) to protect ketone/carbonyl groups. |
| Micro-Inserts | Lab Solutions | ACIV300IC | Used to hold the solution before injection. |
| Mitra Blood Microsampling (BµS) Devices 20 µL | Neoteryx / Trajan Scientific and Medical | 200004 | Volumetric absorptive microsampling (VAMS) polymeric tips used for accurate low-volume blood specimen collection. |
| N-Methyl-N-(trimethylsilyl)trifluoroacetamide (MSTFA) | Restek | 35601 | Silylation reagent used to reduce analyte polarity and boiling points by reacting with acidic protons. |
| Oven | Heraleus | 8.1E+09 | Used for derivatization reactions: methoxyamination at 30°C for 90 min and trimethylsilylation at 37°C for 30 min. |
| Pentadecane | Sigma Aldrich | K2015R | Prepared at 6.25 mg/L. Added to each sample prior to final GC vial transfer to verify injection quality. |
| Pro-Research Refrigerated Centrifuge | Centurion Scientific Lab | CL00.1688.2500 | Capable of cooling to 4°C and reaching speeds up to 10,000 x g. |
| Pyridine | Sigma Aldrich | 23053 | Anhydrous grade. Solvent used to dissolve methoxyamine hydrochloride for the first derivatization step. |
| Round-bottom Microcentrifuge Tubes | FL Medical | TS-88530 | Used for detaching and housing the VAMS tip during rehydration, extraction, and centrifugation. |
| Trimethylchlorosilane (TMCS) | Alfa Aesar | N/A | Derivatization catalyst. Added to MSTFA at 1% v/v ratio. |
| Tweezers | N/A | N/A | Used to carefully remove the VAMS tips from tubes. Must be cleaned with methanol between samples. |
| Ultrapure Water (H2O) | Hydrolab demineralizer (Straszyn, Poland) | N/A | 18.2 MΩ·cm resistivity. Used for tip rehydration, extraction mixtures, and mobile phase A. |
| Ultrasonic Bath Sonorex Digitec DT | Bandelin | N/A* | Used with an ice bath for a 10-minute extraction option instead of a 30-60 minute agitation table. |
| Single-use contact-activated lancet (1.5 mm depth) | [company — please confirm] | [catalog # — please confirm] | Used to perform the fingerprick for capillary blood collection (Step 1.3). |
| Ethanol solution (70%) | [company — please confirm] | [catalog # — please confirm] | Used to disinfect the fingertip prior to sampling (Step 1.2). |
| LC-QTOF-MS system (Bruker Elute LC coupled to a quadrupole time-of-flight mass spectrometer) | Bruker | [catalog # — please confirm] | Reversed-phase LC-MS system used for RP-LC-MS analysis (Section 5); previously named directly in Discussion prose without a Table of Materials entry. |
| GC-MS system (Bruker EVOQ-456) | Bruker | [catalog # — please confirm] | Gas chromatography-mass spectrometry system used for GC-MS analysis (Section 6); previously named directly in Discussion prose without a bb, of Materials entry. |
References
- Gertsman I, Barshop BA. Promises and pitfalls of untargeted metabolomics. J Inherit Metab Dis. 2018;41(3):355-366.
- Gika H, Theodoridis G, Plumb RS, Wilson ID. Metabolic phenotyping (metabonomics/metabolomics) by liquid chromatography-mass spectrometry. In: Fanali S, Chankvetadze B, Haddad PR, Poole CF, Riekkola ML, editors. Liquid Chromatography. 3rd ed. Amsterdam: Elsevier; 2023. p. 403-429.
- Bossi E, et al. Revolutionizing blood collection: innovations, applications, and the potential of microsampling technologies for monitoring metabolites and lipids. Metabolites. 2024;14(1):46.
- Nys G, Kok MGM, Servais AC, Fillet M. Beyond dried blood spot: current microsampling techniques in the context of biomedical applications. TrAC Trends Anal Chem. 2017;97:326-332.
- Londhe V, Rajadhyaksha M. Opportunities and obstacles for microsampling techniques in bioanalysis: special focus on DBS and VAMS. J Pharm Biomed Anal. 2020;182:113102.
- Denniff P, Spooner N. Volumetric absorptive microsampling: a dried sample collection technique for quantitative bioanalysis. Anal Chem. 2014;86(16):8489-8495.
- de Sá e Silva DM, et al. Volumetric absorptive microsampling in the analysis of endogenous metabolites. Metabolites. 2023;13(10):1038.
- Thaitumu M, Gkanali V, Theodoridis G, Gika H. Connecting the dots: bridging microsamples and conventional blood matrices in metabolic biomarker analysis. Anal Sci Adv. 2025;6(2):e70044.
- Chiu HH, et al. A comparative study of plasma and dried blood spot metabolomics and its application to diabetes mellitus. Clin Chim Acta. 2024;552:117655.
- Tobin NH, et al. Comparison of dried blood spot and plasma sampling for untargeted metabolomics. Metabolomics. 2021;17(7):62.
- Cala MP, Meesters RJW. Comparative study on microsampling techniques in metabolic fingerprinting studies applying gas chromatography-MS analysis. Bioanalysis. 2017;9(17):1329-1340.
- Shen X, et al. Multi-omics microsampling for the profiling of lifestyle-associated changes in health. Nat Biomed Eng. 2024;8(1):11-29.
- Volani C, et al. VAMS-based blood capillary sampling for mass spectrometry-based human metabolomics studies. Metabolites. 2023;13(2):146.
- Drolet J, et al. Integrated metabolomics assessment of human dried blood spots and urine strips. Metabolites. 2017;7(3):35.
- Petrick LM, et al. Effects of storage temperature and time on metabolite profiles measured in dried blood spots, dried blood microsamplers, and plasma. Sci Total Environ. 2024;912:169383.
- Kong ST, Lim SH, Ching J, Ho PCL. GC-MS uncovers unique metabolic markers of drug-resistant epilepsy in capillary but not venous dried blood spots. J Pharm Biomed Anal. 2025;253:116561.
- Londoño-Osorio S, et al. Integrating blood microsampling devices with CE-MS for untargeted analysis of polar metabolomics. Microchem J. 2025;218:115278.
- Avella D, et al. An LC-MS untargeted metabolomic comparison between three blood microsampling devices, whole blood, and plasma. Metabolomics. 2026;22(3):89.
- Couacault P, Witting M. RPLC- and HILIC-based non-targeted metabolomics workflow for blood microsamples. Metabolomics. 2026;22(2):23.
- Londoño-Osorio S, et al. Deep insights into microsampling technologies for global lipidomic profiling of human whole blood using high-throughput LC-MS. Microchem J. 2025;213:113760.
- Thaitumu MN, et al. LC-MS-based global metabolic profiles of alternative blood specimens collected by microsampling. Metabolites. 2025;15(1):62.
- Sumner LW, et al. Proposed minimum reporting standards for chemical analysis. Metabolomics. 2007;3(3):211-221.
- Fiehn O. Metabolomics by gas chromatography-mass spectrometry: combined targeted and untargeted profiling. Curr Protoc Mol Biol. 2016;114(1):30.4.1-30.4.32.
- Volani C, et al. Pre-analytic evaluation of volumetric absorptive microsampling and integration in a mass spectrometry-based metabolomics workflow. Anal Bioanal Chem. 2017;409(26):6263-6276.
- Want EJ, et al. Solvent-dependent metabolite distribution, clustering, and protein extraction for serum profiling with mass spectrometry. Anal Chem. 2006;78(3):743-752.
- Bossi E, et al. Pre-analytic assessment of dried blood and dried plasma spots: integration in mass spectrometry-based metabolomics and lipidomics workflow. Anal Bioanal Chem. 2025;417(9):1791-1805.
- Marques de Sá e Silva D, et al. Toward minimally invasive metabolomics: GC-MS metabolic fingerprints of dried blood microsamples in comparison to plasma. Analyst. 2025;150(24):5445-5456.
- Louail P, et al. rformassspectrometry/Metabonaut: v1.1.0. Zenodo. 2025. Available from: https://doi.org/10.5281/zenodo.15190305
- Broadhurst D. broadhurstdavid/QC-MXP: QC:MXP version 2.0. Zenodo. 2025. Available from: https://doi.org/10.5281/zenodo.15233092
- Moros G, et al. Investigation of the derivatization conditions for GC-MS metabolomics of biological samples. Bioanalysis. 2017;9(1):53-65.
- Ioannidis M, et al. Analytical workflow for comprehensive blood metabolomics analysis by GC-MS: application to children with ventilator-associated pneumonia. J Chromatogr A. 2025;1753:465924.
- Kirwan JA, et al. Quality assurance and quality control reporting in untargeted metabolic phenotyping: mQACC recommendations for analytical quality management. Metabolomics. 2022;18(9):70.
Reprints and Permissions
This article has been published
Video Coming Soon