This protocol provides a reproducible survey and partial least squares structural equation modeling workflow for assessing association pathways among online learning experience, basic psychological needs, and learning engagement in university students, including questionnaire adaptation, screening, measurement assessment, indirect-association testing, robustness checks, and reproducibility records.
A subscription to JoVE is required to view this content. Sign in or start your free trial.
Method Article
A Survey and Protocol for Assessing Online Learning Experience, Basic Psychological Needs, and Learning Engagement in University Students
In This Article
Summary
Abstract
Online learning is embedded in higher education, but evaluations often rely on access, satisfaction, or completion indicators that do not identify where engagement problems arise. This article presents a reproducible English-language survey and partial least squares structural equation modeling protocol for assessing association pathways among online learning experience, basic psychological needs, and learning engagement in university students. Online learning experience is measured through platform usability, instructional support, interaction quality, and learning flexibility; basic psychological needs through autonomy, competence, and relatedness; and learning engagement through behavioral, cognitive, and emotional engagement. The workflow specifies item-source mapping, questionnaire adaptation, expert review, pilot testing, electronic consent, eligibility screening, response-quality checks, construct scoring, common method bias diagnostics, higher-order construct estimation, measurement-model assessment, structural pathway testing, indirect-association analysis, psychological-need sensitivity analysis, regression-based robustness checks, and reproducibility file locking. Representative results from 386 valid responses demonstrate acceptable reliability, moderate construct correlations, retained measurement quality, a supported indirect association through basic psychological needs, nonsignificant control paths, and uneven dimensional scores. The protocol supports transparent diagnosis of how online learning experience is associated with psychological need satisfaction and engagement while avoiding causal interpretation from cross-sectional survey data.
Introduction
Online learning has become part of routine higher education through learning management systems, video platforms, recorded materials, synchronous sessions, and blended course designs. However, many evaluations still rely on access logs, satisfaction ratings, or completion indicators, which show whether students used an online course but do not clarify whether lower engagement is associated with platform usability, instructional support, interaction quality, learning flexibility, psychological need satisfaction, or a specific engagement dimension1. Online learning experience should therefore not be reduced to a single satisfaction score. Prior online engagement research emphasizes learner-content, learner-instructor, and learner-learner interaction as important elements of students’ online learning experience2. The present protocol measures online learning experience through platform usability, instructional support, interaction quality, and learning flexibility.
Learning engagement is also multidimensional. It includes behavioral participation, cognitive investment, and emotional involvement. Online-course engagement instruments show that engagement cannot be fully represented by visible participation or task completion alone3. Broader educational technology research also shows that behavioral engagement is often easier to observe than cognitive or affective engagement4. For this reason, the protocol measures learning engagement through behavioral, cognitive, and emotional engagement rather than collapsing engagement into one undifferentiated score.
Self-determination theory provides the theoretical basis for linking online learning experience with learning engagement. Basic psychological need theory identifies autonomy, competence, and relatedness as central conditions for motivation and adjustment5. In online learning, autonomy refers to perceived choice and control, competence to perceived capability in completing learning tasks, and relatedness to felt connection with instructors and classmates. Prior online learning studies using self-determination theory have linked contextual support, need satisfaction, motivation, and engagement6,7. These findings support examining basic psychological needs as an indirect-association construct between online learning experience and learning engagement, while avoiding causal interpretation because the data are cross-sectional.
A methodological problem in online engagement research is the lack of consistent operational structure. Studies vary in how they define learning conditions, measure engagement, and connect the learning environment to students’ psychological experience8. Self-report surveys are also vulnerable to careless responding, patterned answers, post hoc exclusions, missing-data decisions, and common method bias9. Therefore, this protocol fixes the English-language questionnaire structure, item-source mapping, scoring rules, electronic consent procedure, eligibility screening, attention-check rule, completion-time threshold, straight-lining criterion, long-string response check, missing-data handling, model specification, and dataset-locking procedure before structural analysis begins.
The conceptual framework specifies online learning experience as the independent construct, basic psychological needs as the indirect-association construct, and learning engagement as the outcome construct. The primary pathway tests whether online learning experience is associated with basic psychological needs, whether basic psychological needs are associated with learning engagement, and whether online learning experience remains directly associated with learning engagement after accounting for basic psychological needs. The protocol is guided by four research questions: whether the structured survey protocol can measure the three constructs with acceptable response quality and construct reliability; whether online learning experience is positively associated with basic psychological needs and learning engagement; whether the association between online learning experience and learning engagement is partly carried through basic psychological needs as an indirect association; and whether psychological-need subdimension analyses and regression-based robustness checks support the same interpretation as the primary PLS-SEM workflow.
This article is positioned as a method-focused contribution rather than a conventional explanatory cross-sectional study. The protocol provides a reproducible workflow for questionnaire adaptation, expert review, pilot testing, survey administration, response screening, construct scoring, measurement-model assessment, structural pathway testing, indirect-association analysis, sensitivity analysis, robustness checking, and reproducibility file locking. Transparent educational research workflows require analytic decisions to be documented before final model interpretation10. Partial least squares structural equation modeling is used because it allows measurement and structural components to be examined within one workflow, with reflective first-order constructs and analytically derived higher-order construct scores through a disjoint two-stage approach11. Prior work on online student engagement, social presence, learner support, and retention shows that communication, support, connection, and inclusive course design matter beyond simple access or flexibility12,13. Systematic reviews further indicate that behavioral, cognitive, and emotional engagement may respond differently to online learning conditions14. Representative results are therefore used only to demonstrate the output of the protocol, not to claim causal effects from cross-sectional survey data15.
Access restricted. Please log in or start a trial to view this content.
Protocol
The study protocol was reviewed and approved by the Universiti Malaya Research Ethics Committee (Non-Medical) under approval number UM.TNC (P&I)/UMREC_4892 on 7 August 2025. Conduct all procedures in accordance with institutional guidelines for research involving human participants. Obtain electronic informed consent before administering the questionnaire. Use anonymous participant codes during recruitment, screening, scoring, analysis, and file storage. The research tools and software are listed in the Table of Materials.
1. Define the study design and analytical framework
- Use a cross-sectional quantitative survey design to assess association pathways among online learning experience, basic psychological needs, and learning engagement in university students.
- Define online learning experience as the independent latent construct, basic psychological needs as the indirect-association latent construct, and learning engagement as the outcome latent construct.
- Specify the three multidimensional constructs before data collection. Represent online learning experience by platform usability, instructional support, interaction quality, and learning flexibility; basic psychological needs by autonomy need, competence need, and relatedness need; and learning engagement by behavioral engagement, cognitive engagement, and emotional engagement.
- Use partial least squares structural equation modeling as the primary analytical method to assess measurement quality, higher-order construct scores, structural paths, and the prespecified indirect pathway.
- Specify the main pathway before analysis: online learning experience → basic psychological needs, basic psychological needs → learning engagement, and online learning experience → learning engagement.
- Treat all structural paths as association estimates. Do not interpret any pathway as causal because all variables are measured at one time point. Conduct a priori sample-size and power checking before recruitment. Use at least 380 valid responses as the target sample and 350 valid responses as the minimum acceptable post-screening sample.
- Present the protocol workflow in Figure 1, including recruitment, consent, questionnaire administration, expert review, pilot testing, response screening, dataset locking, measurement assessment, structural testing, indirect-association analysis, robustness checking, and reproducibility-file preparation.
NOTE: Keep the conceptual model and structural paths unchanged from questionnaire construction through final analysis.
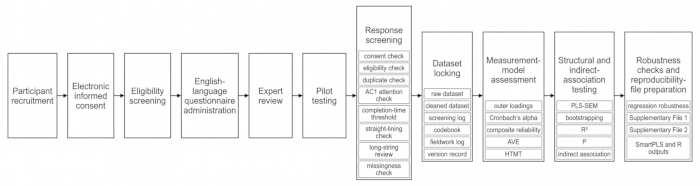
Figure 1: Operational workflow for assessing online learning experience, basic psychological needs, and learning engagement. The figure shows the protocol workflow from recruitment, consent, questionnaire administration, expert review, pilot testing, response screening, and dataset locking to measurement assessment, structural testing, indirect-association analysis, robustness checking, and reproducibility-file preparation. Please click here to view a larger version of this figure.
2. Recruit eligible participants
- Recruit university students who have participated in at least one online or blended course during the current or most recent academic semester.
- Include participants who are 18 years of age or above, currently enrolled as undergraduate or postgraduate students, exposed to online or blended learning, able to read the English-language questionnaire, and willing to provide electronic informed consent.
- Exclude responses when consent is not confirmed, eligibility criteria are not met, the attention-check item is failed, duplicate submission is detected, completion time is below the prespecified threshold, straight-lining is detected, or unresolved eligibility inconsistency is present.
- Recruit participants through university learning platforms, course communication groups, student email lists, and institutional student channels.
- Do not collect direct identifiers, including names, student identification numbers, telephone numbers, private email addresses, exact residential addresses, IP addresses, device identifiers, or account identifiers.
- Record recruitment dates, recruitment channels, submitted responses, exclusion counts by category, retained responses, and final valid sample size in the fieldwork log and screening log.
PAUSE POINT: Check recruitment progress weekly. Review only response count, recruitment-channel coverage, and preliminary exclusion rate. Do not inspect construct scores, correlations, or pathway estimates during recruitment.
3. Construct the questionnaire
- Prepare a structured English-language questionnaire with electronic informed consent, eligibility screening, participant background information, substantive scale items, and one instruction-based attention-check item.
- Use a 5-point Likert response scale for all substantive items: 1 = strongly disagree, 2 = disagree, 3 = neutral, 4 = agree, and 5 = strongly agree.
- Adapt online learning experience items from prior measures of online learning perception, instructional support, interaction quality, platform usability, and learning flexibility. Adapt basic psychological needs items from established autonomy, competence, and relatedness measures. Adapt learning engagement items from established behavioral, cognitive, and emotional engagement measures.
- Revise item wording only to fit university online and blended learning contexts. Use clear, non-leading wording and avoid wording that implies high satisfaction, high psychological need satisfaction, or high engagement is expected.
- Prepare an item-source mapping table before pilot testing. Record item code, construct, dimension, adapted wording, source basis, adaptation note, questionnaire language, and scoring direction for each substantive item.
- Use 33 substantive Likert-scale items: 12 for online learning experience, nine for basic psychological needs, and 12 for learning engagement. Use three items for each online learning experience dimension, three items for each basic psychological need dimension, and four items for each learning engagement dimension.
- Place one instruction-based attention-check item after the basic psychological needs block. Use this item only for response-quality screening and exclude it from construct scoring, reliability analysis, validity analysis, PLS-SEM estimation, indirect-association testing, and robustness analysis.
- Keep the expected questionnaire completion time within 8–12 min during pilot testing. Use Table 1 to document construct domains, dimensions, item codes, number of items, response scale, scoring direction, and adaptation basis. Use Supplementary File 1 to provide the full questionnaire, item-source mapping, variable coding, and scoring rules.
NOTE: Keep the predictor, indirect association, and outcome items conceptually distinct.
Table 1: Construct domains, dimensions, questionnaire structure, and scoring rules. This table summarizes the questionnaire structure, including construct domains and dimensions, item codes and numbers, example items, adaptation basis, response scale, and scoring rules. The attention-check item is identified as a screening-only item. Please click here to download this Table.
4. Conduct expert review and pilot testing
- Invite three to five experts in educational psychology, online learning, quantitative methodology, higher education research, or survey design to review the questionnaire.
- Ask experts to assess item clarity, construct relevance, wording redundancy, response burden, cultural suitability, language clarity, and alignment between each item and its assigned dimension.
- Record expert-review outcomes in an item-revision log, including original wording, reviewer concern, revision decision, final wording, and reason for retention, revision, or removal.
- Revise items that are ambiguous, double-barreled, overly similar, culturally inappropriate, weakly aligned with the target dimension, or inconsistent with the English-language survey context.
- Conduct a pilot test with 30–50 university students who meet the same eligibility criteria as the main study. Ask pilot participants to identify unclear wording, technical display problems, excessive length, repetitive wording, or discomfort caused by any questionnaire item.
- Record pilot completion time for each participant. Define the formal-study minimum completion-time threshold as the larger value between 3 min and one-third of the pilot median completion time.
- Calculate preliminary internal consistency for each construct and inspect item-total correlations after pilot testing. Revise or remove weak items only when deletion improves measurement quality and does not weaken construct coverage.
- Finalize and lock the questionnaire, codebook, item-source mapping, expert-review log, pilot-test record, completion-time threshold, attention-check rule, duplicate-detection rule, and exclusion criteria before formal recruitment.
PAUSE POINT: Do not begin formal recruitment until all questionnaires, screening, and coding files have been locked.
5. Administer the online questionnaire
- Build the questionnaire in an online survey system that supports anonymous participation, consent confirmation, eligibility screening, required-response settings, response-time recording, non-identifying duplicate-submission restriction, attention-check placement, and spreadsheet export.
- Place electronic informed consent before eligibility screening and questionnaire items. Allow participants to proceed only after confirming voluntary participation and present the study purpose in neutral language. State that the study examines students’ perceptions of online learning, psychological need satisfaction, and learning engagement.
- Set consent, eligibility questions, and all 33 substantive Likert-scale items as required fields. Disable fields for direct identifying information. Do not request names, student numbers, telephone numbers, private email addresses, exact residential addresses, IP addresses, device identifiers, or account identifiers.
- Allow participants to exit the questionnaire before final submission without penalty. Restrict repeated submissions only through non-identifying survey-platform settings when available. Keep the questionnaire open for 4–6 weeks. Monitor response counts twice per week and document recruitment progress in the fieldwork log.
NOTE: Do not provide personal score feedback after questionnaire submission.
6. Export and protect the raw data
- Export all submitted responses in .xlsx and .csv formats immediately after recruitment closes.
- Save one unchanged .xlsx file as RawData_OnlineLearning_BPN_Engagement_YYYYMMDD.xlsx and one unchanged .csv file as RawData_OnlineLearning_BPN_Engagement_YYYYMMDD.csv.
- Create a working copy for screening, coding, and analysis. Name it WorkingData_OnlineLearning_BPN_Engagement_YYYYMMDD.xlsx. Assign each submitted response an anonymous participant code in the format P001, P002, P003, and so on.
- Store the raw dataset in a read-only folder and create a checksum, file-version record, or institutional version-history record before screening begins.
- Preserve the de-identified raw submitted-record archive and screening metadata in the protected institutional verification folder. Do not include raw excluded records, directly identifiable information, or participant-level raw data in the manuscript or supplementary files submitted for publication.
PAUSE POINT: Do not begin screening until the raw .xlsx file, raw .csv file, fieldwork log, raw-data version record, and protected raw-data folder have been saved.
7. Screen responses and apply exclusion rules
- Apply all exclusion rules before examining construct correlations, measurement-model output, structural paths, or indirect-association estimates. Remove responses without consent confirmation or without age, enrollment, online-learning exposure, or questionnaire-language eligibility.
- Remove duplicate responses according to the prespecified duplicate-detection rule. Identify possible duplicates only by non-identifying survey-platform duplicate flags and anonymous response-pattern information. Retain the earliest complete response when duplicate responses are identified.
- Remove responses that fail the instruction-based attention-check item or are completed below the formal-study minimum completion-time threshold. Define straight-lining as selecting the same response option for at least 90% of the 33 substantive Likert-scale items. Remove responses that meet this criterion.
- Flag long-string response patterns when the same response option is selected for 20 or more consecutive substantive Likert-scale items. Remove flagged responses only when they also show implausibly short completion time, failed attention check, straight-lining, or another prespecified quality violation.
- Flag inconsistent background responses when the participant reports no online or blended learning exposure but reports weekly online learning hours above zero. Remove responses with unresolved eligibility inconsistency.
- Record every excluded case in a de-identified screening log with anonymous participant code, exclusion category, exclusion reason, screening date, and screening decision.
- Use Table 2 to document submitted responses, exclusion categories, exclusion counts, retained responses, and final valid sample size. If raw exclusion counts cannot be reconstructed for the representative dataset, state this explicitly.
NOTE: Exclude cases only according to prespecified consent, eligibility, duplicate, attention-check, completion-time, response-pattern, missingness, or consistency rules. Do not begin coding until the raw dataset, cleaned dataset, screening log, exclusion-rule file, fieldwork log, and dataset-version record have been saved separately and locked.
Table 2: Response screening, exclusion rules, and data-handling decisions. This table summarizes the prespecified screening rules and data-handling decisions for consent, eligibility, duplicate responses, attention check, completion time, response-pattern checks, missingness, and dataset locking. Exclusion rules are applied before examining construct correlations, measurement-model output, structural paths, or indirect-association estimates. Each excluded response is recorded in a de-identified screening log using the anonymous participant code, exclusion category, exclusion reason, screening date, and screening decision. Please click here to download this Table.
8. Handle missing data
- Prevent missing values in consent, eligibility questions, and the 33 substantive Likert-scale items by setting these fields as required in the survey system. Inspect the cleaned dataset for missing values after screening.
- Treat missing values in optional background variables as “not reported.” Do not impute optional demographic or background variables.
- Exclude a background variable from covariate analysis if its missing rate exceeds 10%. Retain a background variable as a covariate only when its missing rate is 10% or lower and the variable is theoretically relevant.
- Do not impute missing values in the 33 substantive Likert-scale items. If substantive item missingness is detected despite required-response settings, identify whether the problem is caused by survey export, survey logic, or incomplete submission handling before finalizing the cleaned dataset.
NOTE: Record the missing-data check. Report the number of missing values and the missing rate for participant code, background variables, substantive Likert-scale items, dimension scores, and global construct scores.
9. Code variables and calculate scores
- Code all substantive Likert-scale items from 1 to 5: 1 = strongly disagree, 2 = disagree, 3 = neutral, 4 = agree, and 5 = strongly agree. Code gender, academic level, year of study, discipline category, weekly online learning hours, and prior online learning experience according to the locked codebook.
- Inspect all variables for out-of-range values before calculating dimension or global construct scores.
- Calculate online learning experience dimension scores as item means: platform usability = mean(OLE_PU1–OLE_PU3), instructional support = mean(OLE_IS1–OLE_IS3), interaction quality = mean(OLE_IQ1–OLE_IQ3), and learning flexibility = mean(OLE_LF1–OLE_LF3).
- Calculate basic psychological needs dimension scores as item means: autonomy need = mean(BPN_AU1–BPN_AU3), competence need = mean(BPN_CO1–BPN_CO3), and relatedness need = mean(BPN_RE1–BPN_RE3).
- Calculate learning engagement dimension scores as item means: behavioral engagement = mean(LE_BE1–LE_BE4), cognitive engagement = mean(LE_CE1–LE_CE4), and emotional engagement = mean(LE_EE1–LE_EE4).
- Calculate global construct scores as dimension means: online learning experience = mean (platform usability, instructional support, interaction quality, learning flexibility); basic psychological needs = mean (autonomy need, competence need, relatedness need); and learning engagement = mean (behavioral engagement, cognitive engagement, emotional engagement).
- Retain item-level data for measurement-model assessment, dimension scores for higher-order construct estimation and subdimension analysis, and global construct scores for descriptive statistics, correlation analysis, structural-model checking, and regression-based robustness analysis.
NOTE: Do not include the attention-check item in any score, reliability analysis, validity analysis, PLS-SEM estimation, indirect-association analysis, or robustness analysis. Do not standardize original 1–5 scores before descriptive analysis.
10. Control and evaluate common method bias
- Apply procedural controls before analysis by using anonymous responses, neutral wording, separated construct blocks, one instruction-based attention-check item, required-response settings, and restricted raw-data access.
- After response screening, use Harman’s single-factor test to examine whether one unrotated factor accounts for a dominant share of item variance. Treat the result as acceptable when the first unrotated factor accounts for less than 50% of total variance.
- Calculate full collinearity variance inflation factor values for the focal constructs. Treat values below 3.30 as indicating that severe common method bias is unlikely. Record common method bias as a limitation if the first unrotated factor accounts for 50% or more of total variance or if any full collinearity variance inflation factor is 3.30 or higher.
NOTE: Do not state that common method bias is absent. State only whether the diagnostics indicate severe evidence of a dominant common method factor.
11. Conduct descriptive and preliminary checks
- Use R 4.4.1 for descriptive statistics, distribution checks, correlation analysis, and regression-based robustness analysis. Calculate frequencies and percentages for categorical participant characteristics.
- Calculate mean, standard deviation, minimum, maximum, skewness, and kurtosis for substantive items, dimension scores, and global construct scores.
- Inspect item and score distributions for floor effects, ceiling effects, and severe non-normality. Define a potential floor or ceiling effect as more than 20% of participants selecting the lowest or highest response option for a substantive item.
- Calculate Pearson correlations among global constructs and dimension scores. Treat correlations as preliminary descriptive evidence only and do not use them as a substitute for the prespecified structural model.
NOTE: Record floor or ceiling effects as data features. Do not delete cases for distributional reasons unless they also violate prespecified response-quality rules.
12. Estimate the higher-order measurement model
- Use Smart PLS 4.1 for the primary PLS-SEM analysis and import the cleaned item-level dataset. Specify platform usability, instructional support, interaction quality, learning flexibility, autonomy need, competence need, relatedness need, behavioral engagement, cognitive engagement, and emotional engagement as reflective first-order constructs.
- Use the disjoint two-stage approach. In the first stage, estimate the reflective first-order constructs and save their latent variable scores.
- In the second stage, use latent variable scores of platform usability, instructional support, interaction quality, and learning flexibility to represent online learning experience; latent variable scores of autonomy need, competence need, and relatedness need to represent basic psychological needs; and latent variable scores of behavioral engagement, cognitive engagement, and emotional engagement to represent learning engagement.
- Treat higher-order construct scores as analytically derived representations of multidimensional constructs. Do not describe them as formative unless a formative model is explicitly specified and justified. Save first-stage settings, second-stage settings, latent variable scores, and model-output files in the verification folder.
NOTE: Use the same higher-order construct procedure in the main structural model, psychological-need subdimension analysis, and regression-based robustness analysis.
13. Assess the measurement model
- Assess the measurement model before interpreting the structural model. Examine standardized outer loadings for all retained indicators. Retain indicators with loadings of at least 0.70 when possible.
- Review indicators with loadings between 0.40 and 0.70. Remove an indicator only when deletion improves reliability or convergent validity and does not weaken content coverage. Remove indicators below 0.40 unless a documented theoretical reason supports retention.
- Assess internal consistency using Cronbach’s alpha and composite reliability. Treat values between 0.70 and 0.95 as acceptable. Assess convergent validity using average variance extracted. Treat values of at least 0.50 as acceptable.
- Assess discriminant validity using the heterotrait-monotrait ratio. Use 0.85 as the conservative threshold and 0.90 as the maximum acceptable threshold for theoretically adjacent constructs.
- Record retained indicators, standardized outer loadings, Cronbach’s alpha, composite reliability, average variance extracted, heterotrait-monotrait values, and any item-deletion decisions in the locked measurement-model output.
NOTE: Do not delete items only to improve statistical values. Remove an item only when statistical weakness and conceptual redundancy are both documented.
PAUSE POINT: Do not begin structural testing until retained indicators, loading values, reliability values, convergent validity, discriminant validity, codebook entries, and measurement-output values have been checked against the locked analysis files.
14. Test the structural model and mediation pathway
- Specify three structural paths: online learning experience → basic psychological needs, basic psychological needs → learning engagement, and online learning experience → learning engagement.
- Include weekly online learning hours and prior online learning experience as prespecified control variables. Treat gender, academic level, year of study, and discipline category as descriptive variables unless included in a prespecified sensitivity model.
- Examine structural-model collinearity before interpreting path coefficients. Treat variance inflation factor values below 3.30 as indicating that harmful collinearity is unlikely.
- Estimate standardized path coefficients, t values, p values, and 95% confidence intervals using 5,000 bootstrap resamples with two-tailed testing. Use bias-corrected confidence intervals when available.
- Estimate the indirect pathway from online learning experience to learning engagement through basic psychological needs. Treat the indirect-association pathway as supported when the bootstrap confidence interval for the indirect effect does not include zero.
- Record the direct effect, indirect effect, total effect, R2 values, adjusted R2 values, f2 effect sizes, structural-model variance inflation factor values, and control-variable paths in the locked structural-model output. Interpret all structural estimates as association-based pathways rather than causal effects.
NOTE: Do not remove a prespecified path because it is nonsignificant. Retain the prespecified model unless a coding error or model-specification error is identified.
15. Examine psychological need subdimensions
- Replace the global basic psychological needs construct with autonomy need, competence need, and relatedness need as parallel indirect-association constructs. Estimate indirect pathways from online learning experience to learning engagement through autonomy need, competence need, and relatedness need separately.
- Use 5,000 bootstrap resamples for each subdimension pathway. Compare the direction, magnitude, and confidence interval of each subdimension indirect pathway. Treat this analysis as a sensitivity analysis rather than the primary model.
NOTE: Do not reinterpret the subdimension sensitivity analysis as a new primary model.
16. Conduct regression-based robustness analysis
- Export the cleaned construct-score dataset and save it as ConstructScores_OnlineLearning_BPN_Engagement_YYYYMMDD.csv. Use R 4.4.1 to regress global basic psychological needs on global online learning experience, weekly online learning hours, and prior online learning experience.
- Regress global learning engagement on global online learning experience, global basic psychological needs, weekly online learning hours, and prior online learning experience. Estimate the indirect pathway using 5,000 bootstrap resamples.
- Compare the regression-based indirect pathway with the PLS-SEM indirect pathway. Classify the pathway as robust only when the direction remains consistent and the substantive interpretation does not change. Save the R script, bootstrap settings, and robustness output in the verification folder.
PAUSE POINT: Do not begin final file locking until the structural model, subdimension analysis, and regression-based robustness analysis have been cross-checked.
17. Handle suboptimal analytical outcomes
- If Cronbach’s alpha or composite reliability is below 0.70, inspect item-total correlations and standardized outer loadings. If the average variance extracted is below 0.50, inspect retained indicators and identify whether one or more indicators weaken convergent validity.
- If heterotrait-monotrait values exceed the prespecified threshold, inspect item wording for semantic overlap between theoretically close constructs. Remove a weak item only when it is statistically weak and conceptually redundant. Keeping theoretically adjacent constructs separate when merging them would reduce conceptual clarity.
- If the indirect pathway is not supported, record the result as an unsupported indirect association. If control variables show nonsignificant associations, record the results without overinterpretation.
NOTE: Do not revise the theoretical model after analysis to force stronger support.
18. Lock software outputs and reproducibility files
- Create a final institutional verification folder named Verification_OnlineLearning_BPN_Engagement_YYYYMMDD.
- Save the raw dataset archive, cleaned dataset, construct-score dataset, codebook, questionnaire, item-source mapping table, expert-review log, pilot-test record, fieldwork log, screening log, exclusion-rule file, completion-time threshold record, Smart PLS outputs, R scripts, R output tables, software-version record, and version-change log in the verification folder.
- Save Smart PLS 4.1 project files and exported measurement-model, structural-model, bootstrap, and heterotrait-monotrait outputs in a subfolder named SmartPLS_Output. Save R scripts and R output tables in a subfolder named R_Output. Save the questionnaire, item-source mapping, variable coding, and scoring rules as Supplementary File 1.
- Save final analytic dataset verification, screening summary, missing-data record, common method bias diagnostics, measurement-model results, structural-model results, indirect-association results, subdimension analysis, regression-based robustness record, software settings, and version record as Supplementary File 2.
- Do not include directly identifiable information, raw excluded records, or participant-level raw data in the manuscript or supplementary files submitted for publication. Lock the final verification folder after consistency checking. Save later corrections as new, dated versions and document the reason in the version-change log.
Access restricted. Please log in or start a trial to view this content.
Results
Final analytic dataset and participant characteristics
The final analytic dataset included 386 university students. Formal recruitment was conducted from 18 August 2025 to 26 September 2025 through university learning platforms, course communication groups, student email lists, and institutional student channels. A total of 432 submitted responses were screened, and 386 responses were retained, giving a valid-response rate of 89.4%. The locked dataset contained 33 substantive ...
Access restricted. Please log in or start a trial to view this content.
Discussion
This protocol provides a reproducible methodological workflow for assessing association pathways among online learning experience, basic psychological needs, and learning engagement in university students. Rather than treating online learning as a single condition, the protocol separates the perceived learning environment into platform usability, instructional support, interaction quality, and learning flexibility. This structure allows researchers to identify which part of the online learning experience is most closely ...
Access restricted. Please log in or start a trial to view this content.
Disclosures
The authors declare that they have no financial or personal relationships that could have influenced the work reported in this paper.
Acknowledgements
We sincerely thank all participating students for their time, cooperation, and valuable responses. We also thank the relevant academic and administrative staff for their support throughout the survey process.
Access restricted. Please log in or start a trial to view this content.
Materials
| Name | Company | Catalog Number | Comments |
|---|---|---|---|
| Qualtrics online survey platform | Qualtrics | Institutional account; version not applicable | Used to administer the anonymous English-language questionnaire, including consent confirmation, eligibility screening, required-response settings, AC1 attention-check item, response-time recording, and data export. |
| Microsoft Excel for Microsoft 365 | Microsoft Corporation | Microsoft 365 institutional version | Used to store the raw exported dataset, cleaned dataset, codebook, screening log, construct-score file, and verification records in .xlsx and .csv formats. |
| G*Power | Heinrich Heine University Düsseldorf | G*Power 3.1.9.7 | Used for a priori sample-size and power checking before recruitment. |
| SmartPLS | SmartPLS GmbH | SmartPLS 4.1 Professional | Used for the primary PLS-SEM workflow, including disjoint two-stage higher-order construct estimation, measurement-model assessment, structural-pathway testing, bootstrapping, R², f², and model-output export. |
| R statistical software | R Foundation / CRAN | R 4.4.1 | Used for descriptive statistics, Pearson correlations, common method bias diagnostics, and regression-based robustness analysis. |
| R package: psych | CRAN | psych 2.4.6 | Used for descriptive statistics, reliability checks, and psychometric summaries. |
| R package: boot | CRAN | boot 1.3-30 | Used for bootstrap-based regression robustness checks. |
| R package: semPlot | CRAN | semPlot 1.1.6 | Used only for optional path-diagram cross-checking when R-based visual verification is needed. |
| OneDrive for Business or SharePoint version history | Microsoft Corporation | Microsoft 365 institutional account | Used to store the verification folder and preserve version history for raw data, cleaned data, codebook, screening log, SmartPLS outputs, R scripts, and supplementary files. |
| Questionnaire and coding file | Author-prepared study file | Supplementary File 1 | Contains the final questionnaire, item-source mapping, variable names, coding rules, dimension-score formulas, global construct-score formulas, and data-handling rules. |
| Screening and reproducibility record | Author-prepared study file | Supplementary File 2 | Contains final dataset verification, screening checks, missing-data record, reliability results, common method bias diagnostics, measurement-model output, structural-model output, indirect-association results, sensitivity analysis, robustness record, and final consistency checklist. |
| Figure-preparation software | Adobe Illustrator or equivalent vector-editing software | Institutional version | Used to prepare publication-ready workflow and structural-model figures. |
References
- Organization for Economic Co-operation and Development. OECD digital education outlook 2021: pushing the frontiers with artificial intelligence, blockchain and robots. Paris: OECD Publishing; 2021. doi:10.1787/589b283f-en.
- Martin F, Bolliger DU. Engagement matters: student perceptions on the importance of engagement strategies in the online learning environment. Online Learn. 2018;22(1):205-222. doi:10.24059/olj.v22i1.1092.
- Dixson MD. Measuring student engagement in the online course: the Online Student Engagement scale (OSE). Online Learn. 2015;19(4). doi:10.24059/olj.v19i4.561.
- Bond M, Buntins K, Bedenlier S, Zawacki-Richter O, Kerres M. Mapping research in student engagement and educational technology in higher education: a systematic evidence map. Int J Educ Technol High Educ. 2020;17(1):2. doi:10.1186/s41239-019-0176-8.
- Vansteenkiste M, Ryan RM, Soenens B. Basic psychological need theory: advancements, critical themes, and future directions. Motiv Emot. 2020;44(1):1-31. doi:10.1007/s11031-019-09818-1.
- Chen KC, Jang SJ. Motivation in online learning: testing a model of self-determination theory. Comput Human Behav. 2010;26(4):741-752. doi:10.1016/j.chb.2010.01.011.
- Chiu TKF. Applying the self-determination theory to explain student engagement in online learning during the COVID-19 pandemic. J Res Technol Educ. 2022;54(sup1):S14-S30. doi:10.1080/15391523.2021.1891998.
- Bedenlier S, Bond M, Buntins K, Zawacki-Richter O, Kerres M. Facilitating student engagement through educational technology in higher education: a systematic review in the field of arts and humanities. Australas J Educ Technol. 2020;36(4):126-150. doi:10.14742/ajet.5477.
- Ward MK, Meade AW. Dealing with careless responding in survey data: prevention, identification, and recommended best practices. Annu Rev Psychol. 2023;74:577-596. doi:10.1146/annurev-psych-040422-045007.
- Zawacki-Richter O, Kerres M, Bedenlier S, Bond M, Buntins K, editors. Systematic reviews in educational research: methodology, perspectives and application. Wiesbaden: Springer VS; 2020. doi:10.1007/978-3-658-27602-7.
- Hair JF, Hult GTM, Ringle CM, Sarstedt M. A primer on partial least squares structural equation modeling. 3rd ed. Thousand Oaks: Sage Publications; 2022.
- Wut TM, Ng PML, Low MP. Engaging university students in online learning: a regional comparative study from the perspective of social presence theory. J Comput Educ. 2024;11(3):763-789. doi:10.1007/s40692-023-00278-8.
- Stone C, O’Shea S. Older, online and first: recommendations for retention and success. Australas J Educ Technol. 2019;35(1):57-69. doi:10.14742/ajet.3913.
- Salas-Pilco SZ, Yang Y, Zhang Z. Student engagement in online learning in Latin American higher education during the COVID-19 pandemic: a systematic review. Br J Educ Technol. 2022;53(3):593-619. doi:10.1111/bjet.13190.
- Maxwell SE, Cole DA. Bias in cross-sectional analyses of longitudinal mediation. Psychol Methods. 2007;12(1):23-44. doi:10.1037/1082-989X.12.1.23.
- Richardson JC, Maeda Y, Lv J, Caskurlu S. Social presence in relation to students’ satisfaction and learning in the online environment: a meta-analysis. Comput Human Behav. 2017;71:402-417. doi:10.1016/j.chb.2017.02.001.
- Meade AW, Craig SB. Identifying careless responses in survey data. Psychol Methods. 2012;17(3):437-455. doi:10.1037/a0028085.
- Deci EL, Ryan RM. The “what” and “why” of goal pursuits: human needs and the self-determination of behavior. Psychol Inq. 2000;11(4):227-268. doi:10.1207/S15327965PLI1104_01.
- Fredricks JA, Blumenfeld PC, Paris AH. School engagement: potential of the concept, state of the evidence. Rev Educ Res. 2004;74(1):59-109. doi:10.3102/00346543074001059.
- Garrison DR, Anderson T, Archer W. Critical inquiry in a text-based environment: computer conferencing in higher education. Internet High Educ. 2000;2(2-3):87-105. doi:10.1016/S1096-7516(00)00016-6.
- Cole DA, Maxwell SE. Testing mediational models with longitudinal data: questions and tips in the use of structural equation modeling. J Abnorm Psychol. 2003;112(4):558-577. doi:10.1037/0021-843X.112.4.558.
- Podsakoff PM, MacKenzie SB, Lee JY, Podsakoff NP. Common method biases in behavioral research: a critical review of the literature and recommended remedies. J Appl Psychol. 2003;88(5):879-903. doi:10.1037/0021-9010.88.5.879.
- Gašević D, Dawson S, Siemens G. Let’s not forget: learning analytics are about learning. TechTrends. 2015;59(1):64-71. doi:10.1007/s11528-014-0822-x.
Access restricted. Please log in or start a trial to view this content.
Reprints and Permissions
This article has been published
Video Coming Soon