Here, a multimodal fusion inference approach is proposed for large-scale power trading that converts natural language queries into analytics and visualization tasks. This experimental evaluation, based on the FMST and ENTSO-E datasets, revealed that our approach outperforms current approaches in forecasting, querying, and chart generation.
Research Article
Multimodal Fusion Inference for Power Trading Data Using Natural Language Queries and Explainable Analytics
In This Article
Summary
Abstract
This research aims to design an innovative multimodal fusion inference technique for analyzing big data in power trading, enabling the transformation of natural language-based queries into structured analysis and the automation of chart creation. The previous state-of-the-art multimodal predictive models have shortcomings in handling natural-language-based reasoning, visualization, and heterogeneous power-trading scenarios. A framework for multimodal inference for power trading is proposed, which brings together natural language dialogue, market intelligence, and explainable analytics. The key scientific innovation is the provision of unified multimodal reasoning that will help convert natural language questions into analytical insights and visual decision aids for large-scale power trading systems. To resolve such limitations, the current multimodal framework uses federated market-sensor transformer (FMST) and European network of transmission system operators for electricity (ENTSO-E) electricity market datasets for creating an integrated multimodal power trading scenario using time series, market information, financial news, power grid details, and past trading trends. The experimental evaluation was carried out on large FMST and ENTSO-E data sets, which consisted of records from financial markets, electricity trading, and grid operations, and compared with the autoregressive integrated moving average (ARIMA), long short-term memory (LSTM), gated recurrent unit (GRU), iTransformer, temporal fusion transformer (TFT), building information modeling coder (BIMCoder), multimodal-bidirectional encoder representations from transformers (BERT), and federated averaging (FedAvg) models. It was observed that the proposed framework provided excellent results in root mean squared error (RMSE) and mean absolute error (MAE), R2 prediction accuracy, interpretation accuracy of queries, multimodal fusion efficiency, and generation of charts accuracy.
Introduction
Financial markets have reached an extremely standardized and networked stage due to the swift expansion of electronic trading platforms and information technologies1. The adaptive market hypothesis asserts that market structures are flexible because individuals constantly modify their actions in response to shifting information landscapes and environmental circumstances2. Massive amounts of diverse data from various sources, such as traditional price-volume patterns, granularity this evolutionary process is reflected in order book depth, market sentiment, and macroeconomic indicators3. A thorough knowledge of market processes under conventional centralized paradigms is frequently impeded by the inherent information friction across dispersed institutions, despite the fact that a distinct window into the underlying market situation is provided by each of these data types4.
Participants in practical decision-making must integrate these conflicting and fragmented signals in order to assess trends and threats in a more and more interconnected global context5. As a result, a crucial research problem that connects financial economics with intelligent computers is the process of extracting and combining valuable information from complex, multi-source streams of information6. Building analytical frameworks that can incorporate these different data sources while maintaining the dispersed structure of market information is potentially very helpful for describing the dynamic variations of trading systems and promoting market equilibrium7,8.
However, multi-source data is frequently dispersed across various financial institutions or trading platforms in real financial application environments, and these data are usually restricted by business sensitivity, safeguarding privacy, and regulatory standards, which render direct sharing or centralized storage challenging9,10. Additionally, trading behavior, investing framework, and market mechanisms vary greatly throughout regional markets, which frequently results in noticeable non-independent and identically distributed (non-IID) features among information foundations11. This issue impairs model steadiness in cross-region submissions and makes model training even more challenging.
Natural language processing (NLP) tools are rapidly changing economic predictions as deep learning's use in time series forecasting grows. When used in real-world financial time series prediction applications, textual data frequently contains subtle details that may be more insightful than only numerical economic series12. In order to capture these extra insights, recent research has started integrating textual information into financial prediction models. To find feelings and accurate data that could influence depositor behavior and market patterns, for example, some algorithms examine a lot of financial news13.
Transformers have also been extensively employed for time-series analysis, demonstrating notable advancements across numerous applications. Transformers employ self-attention to capture long-term dependencies in sequential data, enabling more precise and effective predictions14,15. For instance, the patch time series transformer (PatchTST)16 reduces the quadratic complexity of attention computations by incorporating a patch-based input structure, which increases transformer efficiency. The iTransformer framework17 introduces an inverted perspective for multivariate time series modeling, thereby totally redefining Transformers' handling of sequential data. Unlike traditional transformer topologies, which handle all variables at a single time step as a single token (temporal token), iTransformer represents each variable's whole historical sequence as a distinct entity known as a variate token.
The goal of multimodal learning is to improve model representation capabilities by the integration of diverse data, including text, images, and temporal sequences. Due to the limitations of manually created features, early methods mostly used feature concatenation or cross-modal alignment techniques (such as maximum mean discrepancy [MMD] and contrastive predictive coding [CPC])18,19. Pre-trained multimodal foundation models have progressively gained attention in research as deep learning has advanced. For example, CLIP20 uses contrastive learning to establish semantic alignment between text and images, and ViLT21 uses the Transformer architecture to facilitate cross-modal interaction in image-text representation challenges. Existing research in the field of financial technology has tried to integrate structured data with financial writing, such as the integration used in FinBERT22.
In the area of financial risk control, power time series data has drawn more attention as a crucial physical indicator of business output and operational status. Early research mostly used statistical analysis to extract implicit information about enterprise risk, such as variations in electricity use and load curve characteristics23. The incorporation of electricity data with other modalities, like financial text and business information, has been the subject of recent studies24. For example, several studies build LSTM-based time series fusion models25, but their modeling power is constrained by the encoding of single structured characteristics. During the pre-training stage, ChatTime learns cross-modal representations of textual data and time series signals, and it accomplishes dynamic alignment in subsequent tasks26.
Financial markets, corporate surveillance, and smart sensing systems are just a few of the many fields where time-series data are frequently used. These fields are characterized by complex dynamic dependencies and continuous temporal evolution27. Statistical techniques dominated time-series modeling in early research. However, deep learning has steadily emerged as a key technical approach for intricate time-series modeling due to ongoing advancements in computing power and data volume28. Deep learning methods exhibit distinct benefits in capturing intricate dynamic patterns by automatically learning latent features hidden in data using multilayer nonlinear architectures29. RNNs are among the first significant models used in deep learning procedures for time-series modeling30.
Recent hybrid forecasting architectures that leverage the synergy of signal decomposition, temporal convolutional networks, and multi-feature fusion techniques have proven successful in improving energy forecasting results31,32. In particular, a combination of rolling mapping decomposition with temporal convolutional networks has helped to achieve better forecasting results in the case of highly nonlinear wind speed prediction, whereas multi-feature fusion deep learning models have improved long-term predictions related to energy efficiency. These developments highlight the significance of leveraging complementary feature representations in energy systems and further inspire the development of our multimodal fusion model for large-scale power trading analysis.
Existing multimodal forecasting and financial analytics systems have achieved remarkable results in handling multimodal datasets for forecasting purposes33. Models like FMST are more concerned with integrating multimodal sensing, Federated Learning, and transformer models for forecasting based on structural market data, textual news, and macroeconomic factors34. Yet there is still a problem: these approaches focus solely on prediction and do not consider other essential aspects, such as natural language analysis, query processing, and visualizations for power trading ecosystems. Moreover, deep-learning-based forecasting models and transformer models for economic forecasting concentrate mainly on time-series analysis and textual fusion and ignore the user interaction-based analytical and visualization process. Thus, there has been no attempt at an approach that provides users with the ability to transform their natural language queries into meaningful structures and visualizations. Recent LLM-driven retrieval approaches, such as BIMCoder, have improved natural language query understanding and domain-specific retrieval. However, they remain limited in handling heterogeneous multimodal data, structured analytical inference, and power trading applications. Existing multimodal financial intelligence systems also face challenges in domain adaptation, interpretability, cross-regional generalization, and visualization-driven analytics. Therefore, there remains a need for a unified multimodal fusion inference framework that integrates LLM-based query understanding, cross-modal transformer learning, graph-based power trading analytics, explainable AI, and automated chart generation.
The main goal of this project is to build a smart multimodal fusion inference framework for large-scale power trading analysis that enables users to ask natural-language questions and receive well-structured analytical outputs and visualization reports in return. The goal of this framework is to incorporate various data modalities, such as time-series signals related to the market, electricity trading data, textual information in news articles, macroeconomic data, and grid-related data, based on the FMST and ENTSO-E datasets. This framework also aims to leverage the use of LLM-based semantic query interpretation, cross-modal transformer fusion, graph neural network-based grid topography modeling, federated collaborative learning, and analytical reasoning using explainable AI techniques for improved predictions, structured inference, and visualization creation. The federated component is evaluated using heterogeneous logical client partitions constructed from the FMST and ENTSO-E datasets, while its application across genuinely independent regional electricity markets represents a potential future deployment scenario.
The main contribution of the proposed work is given below:
A new multimodal fusion inference approach is proposed for analyzing big data in large-scale power trading, which leverages the natural language query understanding of large language model (LLM) and cross-modal Transformer learning for structured analytical reasoning and automatic charting. Next, the multimodal power trading scenario is established using the FMST and ENTSO-E datasets by considering time series market signals, electricity transactions, financial news data, and macroeconomic information. Additionally, the BIMCoder-based semantic query interpretation approach is developed to convert user-specified natural-language queries into structured analytical intents for forecasting, anomaly detection, and visualization-driven inference. Moreover, a novel deep hybrid model comprising Temporal Transformers, FinBERT, Vision Transformers (ViTs), and Graph Neural Networks (GNNs) is developed to model temporal relations, semantic relations in text data, visual representations of charts, and power grid topology. Lastly, a federated collaborative learning framework is developed to support distributed model optimization across heterogeneous logical client partitions and multimodal inference. The experimental evaluation examines the framework's behavior under distributed data partitions; validation across genuinely independent geographic electricity markets and real-world privacy-preserving deployments is outside the scope of the present study. It is shown through empirical studies that the proposed approach achieves promising results in terms of RMSE, MAE, and R2 accuracy metrics for forecasting, and outperforms other methods in terms of query interpretation efficiency and effectiveness, multimodal fusion performance, and chart generation capabilities.
Protocol
This work proposes a multimodal fusion inference model for large-scale power trading analytics by fusing natural language understanding, multimodal deep learning, federated learning, and automatic chart generation. Initially, heterogeneous multimodal data is gathered from the FMST dataset and the ENTSO-E electricity market dataset. This consists of the following types of data: time series data of electricity trading transactions, market metrics, financial news data stream, macroeconomic variables, order book data, and electricity grid information. Then, the gathered data is processed individually, depending on its modality, via missing-value imputation, normalization, sliding-window segmentation, tokenization, embedding, and visual feature extraction. Subsequently, a BIMCoder framework for interpreting the semantic query is adapted for use. Prior to its implementation, the original BIM-focused vocabulary and ontology were substituted with electricity market vocabularies through the FMST and ENTSO-E data sets; the framework was then further refined by training on power trading queries and their analytical intentions. The created query embedding can help to perform downstream analytical inference tasks. After that, feature extraction is done based on modality with the help of Temporal Transformers and iTransformers for temporal dependency learning. iTransformer is a transformer-based multivariate time-series forecasting architecture aimed at efficient capture of heterogeneous variable interaction in the form of time-series. It is applied as the benchmark and complementary temporal modeling tool. FinBERT is a transformer language model pre-trained on financial text analysis and learning of the representation of finance-related sentiments. It is used for the extraction of contextual semantic embeddings from financial news and market reports. Vision transformer (ViT) is a transformer-based visual representation architecture that uses the self-attention mechanism for processing image patches. It is meant to be used for chart understanding and visual features extraction. Visual features extraction and graph neural networks are deep learning models designed for graph-structured data. They are applied for capturing the power grid topology and the interconnection relationship. Temporal Transformer is a transformer-based sequence learning architecture utilized for modeling long-range temporal dependencies of electricity trading and market time-series data. It is meant to be the primary temporal feature extractor in the proposed framework.
Following feature extraction, a cross-modal transformer fusion technique is employed to combine heterogeneous features from textual, numerical, visual, and graph-based modalities through cross-attention mechanisms and multimodal fusion layers. The resulting multimodal representations are used for structured analysis and inference, including forecasting, anomaly detection, trend analysis, and explainable analytics for power trading applications. In addition, the proposed system automatically generates charts using a chart-aware reasoning module based on LLM-driven visualization selection. Finally, multiple evaluation metrics are used to assess the performance of the proposed framework in forecasting, classification, natural language understanding (NLU), query interpretation, and chart generation tasks. The overall architecture of the proposed framework is illustrated in Figure 1.
This architecture in Figure 1 shows the inference architecture of multimodal fusion designed for analyzing power trading on large scales with the FMST and ENTSO-E datasets. At first, various datasets, including electrical trading logs, order-book depth logs, financial news, macroeconomic indicators, renewable energy statistics, and power grid congestion, will be collected. All datasets undergo various preprocessing techniques, such as imputation of missing values, normalization, time synchronization, sliding-window segmentation, tokenization, and image resizing. Next, the user's queries will be semantically understood using BIMCoder-based natural language understanding and converted into structured intents. Then, feature extraction is performed across all modalities using Temporal Transformers and iTransformers for temporal features, FinBERT for financial news analysis, ViT for chart and image features, and a GNN for power grid topology analysis. The extracted heterogeneous features are finally combined with a cross-modal Transformer fusion model with an attention mechanism. To improve scalability, preserve privacy, and enable regionally generalizable predictions, the federated collaborative learning technique is used, whereby regional nodes build local models using their data while exchanging model parameters only with the central server. In the end, the combined representations are used by the inference engine powered by explainable AI to produce forecasts, abnormality detection outcomes, risk assessments, trend analyses, and visualization charts.
The framework can utilize multiple input modes such as electric power exchange logs, financial news, market data, power grid structure, and user natural language queries. The system will have semantic understanding through BIMCoder, modality encoding, cross-modal transformer fusion, federated collaborative learning, structured analytical inference, automated chart generation, and explainable AI components. The framework will generate forecasting results, anomaly detections, risk analysis, structured analytical reports, and visualization dashboards by enhancing forecasting accuracy and interpretability.
It is important to note that the nodes depicted in Figure 1 (such as North America, Europe, and Asia) are included to demonstrate how such a federated learning framework can be scalable and applied in practice. For the experimental evaluation in this paper, the FMST and ENTSO-E datasets were employed; however, no North American or Asian electricity market datasets were used. As such, the nodes indicated in Figure 1 do not reflect the real-life datasets used in this research.
Multimodal data collection
The proposed multimodal fusion inference system employs heterogeneous datasets derived from the FMST and the ENTSO-E electricity market. The main focus of the data collection process is to create a common multimodal analysis environment that supports structured inference using natural language, multimodal forecasting, anomaly detection, and automatic chart generation. The collected multimodal data includes numerical trade data, time-series data representing the electricity market, order book depth data, financial news and macroeconomic indicators, power grid operation data, and historical chart data for visualizations. The above-mentioned heterogeneity in modalities will be temporally synchronized in a unified manner to ensure effective cross-modal learning and structured analysis. Moreover, the collected multimodal data will help in capturing temporal dependencies, semantic financial relations, regional trade behavior, and grid topology interactions for large-scale power trading analysis.
FMST dataset
The FMST dataset2,33 has been used as the main multimodal learning dataset because of its large-scale heterogeneous financial sensing dataset. The FMST dataset includes high-frequency price-trading data, order-book snapshot depth data, financial news, Chinese market news, and macroeconomic datasets collected from various international trading environments from January 2018 to December 2024. The initially available data comprised approximately 4.8 × 10⁸ instances of high-frequency price trading data, 1.6 × 10⁸ instances of order-book snapshot data, 1.02 × 10⁶ instances of financial news articles, 7.8 × 10⁵ instances of Chinese news articles, and 2.4 × 10⁴ instances of macroeconomic data.
Records with duplicate entries, missing or inaccurate timestamps, and incomplete critical data were eliminated prior to model construction. While textual records were cleaned and converted into contextual representations using FinBERT-based embeddings, numerical records underwent missing-value treatment, outlier identification, normalization, and sliding-window segmentation. A common temporal reference of one minute was then used to synchronize the diverse modalities. The mean, maximum, minimum, standard deviation, and volume-related characteristics of high-frequency order-book observations were combined to create one-minute statistical representations. While slowly changing macroeconomic variables were kept until the next available official update, textual records were aligned based on their publication timestamps.
Only the valid multimodal time frames resulting from preprocessing, filtering, and temporal synchronization were used for model training and assessment. The 70% training, 15% validation, and 15% testing subsets of these viable samples were divided chronologically. To avoid information leakage from subsequent observations into the training process, the temporal frames were kept mutually exclusive. Only the validation set was used for hyperparameter selection and early stopping, whereas the test set was used solely for the final assessment. To ensure reliability and equitable comparison, the same chronological division technique was applied consistently across the studies.
Table 1 offers a complete description of the FMST data set used in the designed multimodal reasoning inference system. In particular, this dataset comprises heterogeneous data from international financial trading systems and macroeconomic data repositories. High-frequency numerical data and order book information are extracted to capture variations over time and in market microstructure. Moreover, financial news and market reports have been incorporated into the designed system to represent semantic information for a better understanding of economic and trading events. Furthermore, macroeconomic data have been introduced to explain the effect of the economy on electricity trade and markets.
ENTSO-E electricity market dataset
ENTSO-E electricity market data34 is integrated into the proposed framework to modify the multimodal learning setting for practical applications in power trading analysis and smart grid analytics. ENTSO-E electricity market data refers to large-scale data on the electricity market, including electricity prices, generation capacity, load demand, renewable energy generation, cross-border flows, and other relevant information obtained from ENTSO-E. In this research, the following features of the ENTSO-E dataset are used: electricity price data, load-demand data, renewable generation data, cross-border trade data, and transmission congestion data for the period from 2019 to 2025. Around 3.2 × 10⁷ electricity prices, 1.8 × 10⁷ load demands, 9.5 × 10⁶ renewables generation, and 6.4 × 10⁶ cross-border flow data are used in this case.
Table 2 presents the ENTSO-E electricity market data used in the proposed approach for large-scale power trading analytics. The dataset includes heterogeneous electricity market data acquired from several European power trading regions and transmission system operators. Records related to electricity prices and load demand are useful for predicting future time series and understanding the behavior of electricity market transactions. On the other hand, records related to renewables are important for modeling variations in renewable energy and their impact on supply and demand imbalances. Lastly, cross-border transmission flow records and congestion indices have been considered to study the inter-regional grid operations and transmission constraints in the network. Following filtering, duplicate removal, quality control, and temporal synchronization, the heterogeneous ENTSO-E data streams were integrated into 2,400,000 final usable multimodal analysis samples. These samples were subsequently arranged chronologically, with 1,680,000 samples (70%) used for training, 360,000 samples (15%) used for validation, and 360,000 samples (15%) reserved for testing. Grid congestion indicators were temporally aligned with the corresponding analysis windows and used for the downstream congestion-related classification task.
Data preprocessing
Once data is gathered from both FMST and ENTSO-E electricity markets datasets in terms of heterogeneous information from multiple channels, including numerical records, unstructured text documents, and visualization charts, a series of comprehensive data preprocessing tasks is carried out to enhance consistency, synchronization, quality, and multimodal learning ability. As heterogeneous data includes both structured numeric records, unstructured text, and visualization data, each modality undergoes its own independent preprocessing tasks before being fused into a multimodal data format. Specifically, frequent trading records, order-book depth data, load demand data, renewable energy generation data, as well as macroeconomic data undergo missing value filling, normalization, outlier detection, and sliding-window-based time series segmentation. At the same time, financial news reports and market information text data are subject to tokenization, stopword removal, semantic cleansing, and FinBERT-based contextual embedding generation. Visualization data is preprocessed via image scaling, feature extraction, and label detection using an optical character recognition (OCR)-based approach. Finally, all modalities are synchronized in terms of the time axis and standardized in terms of features. Preprocessing was required because the FMST and ENTSO-E datasets contain heterogeneous data with different temporal resolutions, including high-frequency trading records, financial news, macroeconomic indicators, electricity prices, renewable generation, and cross-border transmission data. The preprocessing pipeline performed temporal alignment, denoising, semantic representation learning, and feature standardization, producing unified multimodal representations for query analysis, forecasting, anomaly detection, explainable analytics, and automated chart generation.
As a result of the fact that the time resolution of FMST and ENTSO-E data is quite different, the hierarchical approach to temporal alignment was used prior to multimodal fusion. To align these data sets, the 1-min time step was chosen as the common reference frame, which retains most of the high frequency dynamics in the market and allows observation of electricity markets. For FMST market orders recorded with 10 s resolution, the statistical one-minute features such as average value, maximum value, minimum value, standard deviation, and volume were used to retain high-frequency market dynamics. The hourly and daily ENTSO-E variables were aligned with respect to the common timeline through forward propagation in each interval. Slowly evolving variables such as macroeconomic indicators were retained until the next official update. Linear interpolation was performed on short missing periods in continuous numerical signals, and text data was aligned according to the actual publication timestamp. The efficiency of temporal alignment was checked by comparing statistical properties before and after the resampling process, including mean, variance, temporal autocorrelation, and spectral properties.
Numerical data
Inconsistencies in the observations from the datasets are a result of sensor failure, delayed reporting in the markets, disruption of the transmission process, and asynchronous updates in different regions. Linear interpolation and temporal mean imputation techniques have been used to deal with the missing values for variables such as electricity prices, load demand, order book observations, and renewable energy production. The mathematical descriptions are described in Supplementary File 1.
Text data
The FMST dataset includes finance-related news texts, Chinese market-related news texts, and event-driven economic news. The textual data undergoes tokenization and semantic cleaning to extract salient language-based information for multimodal reasoning. Following semantic cleaning of the text, contextual semantic embeddings are created by leveraging FinBERT to create an embedding of financial power trading semantics in a multidimensional vector space. Embedding creation is represented mathematically as follows:
Et = FinBERT(Tt) (5)
where: Tt is the tokenized text, Et are contextual semantic embeddings.
Chart/image data
Historical trading charts, heat maps, and dashboard visualization elements are resized to fixed sizes before the visual feature extraction stage for consistent computation. Resizing is achieved by the following transformation:
I' = Resize(I, h, w) (6)
Here, I is the input image. I' is the output resized image. h, w represent the target height and width. This pre-processing allows for stable vision transformer-based feature extraction. Chart information from electricity trading dashboards and historical market charts is extracted with the help of ViTs. This process extracts spatial and structure-related information from the visual chart data. Feature extraction can be described as follows:
Fv = ViT (I') (7)
Where, I' is the input chart images. Fv represents the extracted visual features. To increase interpretability and recognition of charts, OCR is used to extract text, such as labels, axis information, timestamps, and numbers, from historical trading charts. The OCR-based feature extraction stage can be written as follows:
L = OCR (I') (8)
Where, L is the extracted text labels. I' represents the chart images.
The preprocessing workflow that creates a uniform feature representation for multimodal fusion and inference from heterogeneous data from the FMST and ENTSO-E datasets is shown in Figure 2. Three modalities—numerical, textual, and visual data—are initially used to classify the gathered data, which includes numerical electricity trading records, financial news, historical market charts, renewable energy statistics, and grid operation data. To capture temporal dependencies, numerical data are subjected to sliding-window segmentation, Min–Max normalization, and missing value imputation. While visual data is scaled, preprocessed, and analyzed with OCR and Vision Transformers for label and feature extraction, textual data is tokenized, cleaned, and encoded with FinBERT embeddings. Ultimately, a unified multimodal representation is created by temporally aligning and integrating all modality-specific characteristics. This representation is then used as the input for large-scale power trading analysis using the cross-modal transformer fusion framework.
Multimodal feature extraction
In addition to preprocessing and synchronization processes, the suggested framework implements multimodal feature extraction that will help extract valuable insights from different heterogeneous data gathered from FMST and ENTSO-E electricity market data. Considering the types of data collected, which include number-based time series information, textual information in finance, power grid network topologies, and visualized data in the form of charts, modality-specific deep learning models called encoders are used to extract specific features from various modalities. Time series data on electricity trading records, prices, renewables, and load demand are used with temporal transformers and iTransformers to model temporal relations and behaviors in the markets. For the multivariate temporal input sequence Xt, the process of temporal feature extraction can be mathematically denoted as follows:
Ft = Transformer (Xt) (9)
where: Xt – time series electricity market sequences, Ft extracted temporal features. Self-attention mechanisms implemented through the Transformer take into account dynamic dependencies in trading, prices, and electricity demand across regions. Such an attention mechanism can be calculated below:
 (10)
where: QU, KE, and VA are the value, key, and query matrices, respectively; feature dimensions are denoted by dk. Here,  ,
 , and
 represent the query, key, and value matrices, respectively, which are created from the input feature representations. In this context, n is the sequence length and d is the dimensionality of the feature embeddings. The value d acts as a scaling factor for stable gradient computation.
At the same time, financial news articles, market reports, and economic events data included in the FMST dataset are also semantically encoded through FinBERT for extracting contextual financial representation that can influence electricity market operations. Let Ts be tokenized textual input data sequences. The generation of semantic embeddings through textual feature extraction is mathematically formulated as follows:
FEs = FinBERT(Ts) (11)
where: FEs represents the extracted semantic text features. With such extracted semantic embeddings, the framework can learn about market sentiments, financial risk factors, relationships between economic events, and contextual trade influences in the power market domain. On the other hand, this framework can model interconnected power grid structures and transmission relations by using Graph Neural Networks (GNNs). Let G = (V, E) denote the electricity transmission graph, where V refers to grid nodes, and E denotes the connection transmissions. The graph feature extraction approach is mathematically expressed as:
FEg = GNN (G) (12)
where: FEg stands for graph topology feature representations. The last step is that the features of all modalities are combined to form a single multimodal feature representation by employing cross-modal feature alignment. Mathematically, the multimodal feature fusion can be written as
FEm = [FEt, FEs, FEg, FEv] (13)
Where, FEt stands for temporal features created from electricity market time series, FEm stands for textual semantic features created by using FinBERT, FEv represents visual features created by using Vision Transformers from chart images, and FEg stands for graph features created using power grid topology by Graph Neural Networks. Here, F fusion represents the final multimodal fused feature.
In which, FEm is the unified multimodal feature space consisting of time, semantics, graph, and visual features. Then, the multimodal feature embeddings are employed in cross-modal Transformer fusion, structure analysis, forecasting, anomaly detection, reasoning, and automated charting as part of the intelligent power trading framework. Following modality-specific feature extraction, multimodal fusion is carried out right away. To guarantee uniform dimensionality across all modalities, the temporal embeddings produced by the temporal transformer/iTransformer, semantic embeddings generated by FinBERT, visual embeddings extracted using the ViT, and graph embeddings learned by the GNN are first projected into a common latent feature space. The suggested cross-modal transformer fusion module then concatenates and processes these aligned embeddings. The fusion module learns complementary correlations between temporal market dynamics, financial semantics, visual trading patterns, and power grid architecture through multi-head cross-attention. The downstream inference engine then uses the resulting unified multimodal representation for explainable analytics, forecasting, anomaly detection, structured analytical reasoning, and automated chart creation.
The FMST dataset contains heterogeneous multimodal data on financial and market sensor data for large-scale multimodal fusion. As shown in Table 3 below, numeric features such as electricity or financial trading prices, trading volumes, bidding price, asking price, and bid-ask spread are obtained to describe market dynamics, financial trading behaviors, and fluctuations. The use of temporal features, namely timestamps, is required to enable the Transformer to learn market behavior sequentially. Furthermore, macroeconomic features such as inflation rates and GDP growth rates are taken to describe external economic impacts on electricity and financial trading markets. Financial news textual features are represented in contextualized semantics via FinBERT, enabling modeling of market sentiment, events impact, and financial risk indicators. Volatility indices, moving averages, liquidity metrics, and event types are also extracted to improve anomaly detection, forecast accuracy, and multimodal reasoning.
The electricity market data set from ENTSO-E gives insights into large-scale operations and transactions in interconnected European electricity markets and transmission systems. As is evident from Table 4, features of the electricity market, such as hourly electricity prices, day-ahead market prices, and cross-border trades, are extracted to study the behavior of regional energy trading and price fluctuations. Features such as demand loads and reserve balances are used to infer the electricity consumption patterns and the grid's balancing capacity. Renewable energy metrics such as solar and wind power output are also used to study the intermittency of renewables and varying demand-supply scenarios within the smart grid environment. Moreover, operational metrics of the grid include features such as the congestion index, transmission flows, and grid frequency stability to capture interconnections within the grid and the reliability status of the power system. The carbon emission rates and penetration rates of renewable energy sources are also added to perform sustainability-based forecasting and explainable reasoning.
Cross-modal transformer fusion
In the proposed model architecture, semantic queries produced by the LLM-based NLP Natural Language Query Understanding module serve as guides for contextual queries, whereas temporal signals, semantic representations, graph topology features, and visual chart embeddings are used as the keys and value pairs, respectively, in multimodal reasoning. These capabilities allow the model to learn complex interactions, such as the result of economic news on electricity prices, the consequence of generation variability on cross-border trading behavior, and how power grid congestion affects volatility.
Multi-head fusion attention is also incorporated into the architecture in order to facilitate the interaction between heterogeneous features and the multimodal representation learning capabilities. The model may simultaneously learn various semantic interactions in several representation subspaces by using the multi-head fusion technique. The process of multi-head attention fusion can be described as:
 (14)
where: headi refers to the ith attention head, WO denotes the output projection matrix.
The resultant fused multimodal embedding is further enhanced by applying feed-forward neural networks with residual normalization for more stable feature processing and analytical generalization. Mathematically, the resultant fused multimodal embedding can be characterized as follows:
 (15)
Where FEfusion denotes the resultant fused multimodal embedding.
Cross-modal Transformer fusion results in cross-modal embeddings, which are then used for forecasting, anomaly detection, reasoning analysis, interpretable inference, and automatic chart creation in the proposed intelligent power trading system. The introduction of cross-modal Transformer fusion enhances feature interactions, context-based reasoning, multimodal dependencies, and prediction accuracy in power trading compared to traditional unimodal forecasts.
The novel cross-modal transformer fusion architecture employs heterogeneous multimodal representations obtained from electricity trading data to form an analytical feature space for intelligent trading decisions in the electricity domain, as given in Algorithm 1 (Supplementary File 1). First, the modality-dependent features obtained from Temporal Transformers, FinBERT, GNNs, ViTs, and LLMs are mapped into a common latent representation space via trainable mapping matrices, ensuring all modalities share the same dimensionality. Next, the combined multimodal representations will be sent into the cross-attention Transformer architecture, where query, key, and value matrices will be created to capture context-aware interactions across heterogeneous modalities. This technique allows the framework to account for the complex dependencies among electricity prices, market sentiment, fluctuations in renewable energy production, power grid congestion, and visual trading trends. Additionally, to capture various semantic relations among representation subspaces, the proposed framework employs a multi-head attention fusion technique. Following attention-based fusion, feedforward neural networks are used to further improve feature stability while avoiding any loss of information when performing multimodal integration. Finally, the fused multimodal representation that has been created will be used for various analysis purposes, such as prediction, anomaly detection, structural reasoning, explainable inference, and automatic chart creation within the suggested intelligent power trading system.
Federated collaborative learning
The suggested architecture uses federated collaborative learning (FCL) to facilitate distributed multimodal model training across heterogeneous logical client partitions after the cross-modal transformer fusion procedure. To replicate heterogeneous distributed learning settings, the clients in the current experimental setup are built as non-overlapping partitions of the FMST and ENTSO-E datasets. The experimental clients do not represent independently acquired datasets from distinct geographic regions, even though the datasets contain information across several markets and geographic settings. Therefore, rather than directly illustrating real-world cross-region generalization or privacy preservation, the current evaluation concentrates on the efficacy of FCL for distributed multimodal learning and model optimization. Future deployment scenarios include the framework's possible use in privacy-sensitive real-world deployments and autonomously run regional markets. For this reason, the proposed framework adopts a federated learning approach, in which various decentralized market nodes train their respective multimodal models without exchanging sensitive information, such as raw electricity market transactions, financial data, and grid operational information. Each decentralized regional node performs localized optimization using its own multimodal trading dataset, which includes electricity price information, renewable energy production information, financial stream data, and grid congestion data. However, in the experimental analysis, the aforementioned decentralized clients correspond to distinct logical data partitions of the FMST and ENTSO-E datasets, while the geographical locations, as shown in Figure 1, are intended to illustrate possible use cases and are not the actual geographical datasets used in the experimental validation process. Let Di refer to the local dataset of the ith region, and wi refer to the local model parameters. Mathematically, the local optimization problem can be formulated as follows:
 (16)
Where:  represents parameters of the model at iteration t, η represents the learning rate, and
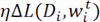 represents gradient updates performed using local multimodal data. Where, represents the model parameters of client i at communication round t,
 is the updated model parameters of the client after the local training, η is the learning rate, and
 represents the gradient of the local loss function using client i’s dataset.
This decentralized learning algorithm allows each regional trading point to train the local model by learning the behavior of the local market, variations in electricity demand, renewable energy sources, and characteristics of the electrical grid without revealing any critical market data.
After training the model locally, the proposed approach uses global collaborative aggregation via Federated Averaging (FedAvg) to create a single global multimodal inference model. In this way, rather than sending raw data for analysis, the model parameters are sent in an encrypted form to the centralized aggregation server. The global federated averaging process can be mathematically stated as:
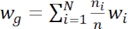 (17)
Where: wg denotes global model parameters, N denotes total amount of participating nodes, ni denotes amount of models in node i, n denotes overall quantity of models in all nodes. Where, wg denotes the new global model parameters after aggregation, wi is the local model parameters of client i, ni is the number of training data samples with client i, ni is the total number of training data samples, and N is the total number of federated clients.
The federated aggregation approach enhances the global generalization performance by fusing diverse multimodal information learned from different electricity trading scenarios and regional markets. Therefore, the proposed learning framework can manage better regional market differences, variability of electricity trade between regions, and diverse power grids compared to centralized approaches.
Moreover, the proposed FCL framework combines privacy-preserving multimodal inference and communication-efficient distributed optimization for improved robustness and scalability of analytics in intelligent power trading systems.
To reduce the communications required for federated learning, adaptive model synchronization and selective parameter updating are used between the participating nodes. Global multimodal fusion model is updated repeatedly in the process of optimizing locally and aggregating globally until convergence. The final federated optimization problem is formulated as:
 (18)
Where Li(w) refers to the local loss function of node i, w indicates optimized global model parameters. Where, L denotes the complete federated learning objective, Li is the local loss of client i, ni is the number of data samples with client i, and N is the total number of federated clients. Multimodal representation that is formed via federated learning is then leveraged for the purpose of prediction, anomaly detection, interpretive analysis, structured inference creation, and automatic chart plotting.
Structured analytical inference
Following FCL, the suggested framework applies structured analytical inference (SAI) to convert the fused multimodal representations into structured analytical outputs for making intelligent decisions related to power trading. The main focus of this process is to create forecasts, anomaly detection reports, trend analysis outcomes, and SQL-like structured analytics using various multimodal data gathered from FMST and ENTSO-E datasets. Firstly, the optimally fused multimodal representation produced by the Cross-Modal Transformer Fusion layer will be fed into an inference engine that uses the semantic embeddings generated by the Natural Language Query Understanding module. Suppose it used FEfusion to represent the optimally fused multimodal representation and Eq to represent semantic query embeddings. The structured analytical inference process can be formally described as:
 (19)
where: As refers to structured analytical outputs, Infer(cdot) denotes a multimodal analytical inference function. These analytics representations include forecasting metrics, electricity prices’ trends, volatility analysis, renewable production trends, congestion risks, and electricity trading insights with respect to user-defined analytical intents. With this approach, it becomes possible to map natural language market queries into machine-readable structured analytics representations that can be used in generating explainable decision-making support systems and visualization tools. Following that, forecasting and trend analysis are achieved using fused multimodal embeddings obtained using electricity trading information, financial news feeds, renewables’ trends, and electrical grids' topology relations. Suppose Xt is temporal electricity trading information and Ffusion is the fusion of the multimodal embeddings. Then the forecasting task can be formulated mathematically as follows:
 (20)
Here,  are forecasts for electricity market output, f(cdot) is the multimodal forecasting function. The forecasting component forecasts market prices, load demand, renewable generation, and cross-border electricity transfers for upcoming trading periods. Moreover, anomalies are detected for any irregularities such as abnormal market behavior, congestion on the transmission grid, price spikes, and other factors. The process of anomaly detection can be expressed mathematically as:
 (21)
where: Ai are anomalies, Xi represent observations in trading period i, μ and σ are mean and standard deviation, λ is anomaly threshold. Moreover, the proposed framework creates structured analytics reports and natural language summaries based on SQL-type queries and explainable inference models. Some of the types of generated analytics reports include forecasting reports, market volatility summaries, renewable energy analysis, market risks explanation, and congestion-aware electricity trading. The analytics report creation is formulated mathematically as:
 (22)
where: R denotes produced analytical reports and summary outputs.
Automated chart generation
After the structured analytical inference stage, the framework conducts automated chart generation (ACG) by mapping the structured analytical results into a dynamic visualization that supports intelligence-based power trading analytics. In this regard, the main goal of this phase is to automatically generate visualizations, including bar charts, trend lines, volatility graphs, heatmaps, and trading dashboards, from the multimodal analytical representations derived from the FMST and ENTSO-E data. Unlike typical visualization solutions, where visualization chart types must be manually selected and parameters configured As, the proposed framework adopts an LLM-based visualization reasoning mechanism to select the appropriate chart type according to user analytical queries, structured inference results, and multimodal contexts. At first, the multimodal visualization representation Eq obtained through inference engine analysis is mapped along with the semantic query embedding to derive an optimal visualization structure. The visualization chart selection equation can be written as follows:
 (23)
where: Ct represents the selected type of chart, Select(cdot) is the visualization suggestion function. In this regard, the volatility analysis is plotted in line and heatmap types, whereas the comparison of electricity demand by categorization is done in bar charts, and the distribution of renewable energy in various regions is done in the form of a dashboard and a pie chart type. The visualization approach makes it more understandable to make decisions and analyze in big power trading environments.
Subsequently, after visualization, the framework generates chart templates according to the structure of forecasting outputs, anomaly detection indicators, market trends, and grid statistics generated from the multimodal inference engine. Where FEfusion is the multimodal analytical representation after fusion and R is the generated structured report. Chart generation is represented as:
 (24)
Where, Vc is a set of generated visualization outputs, Generate(cdot) refers to automated chart generation.
The generated charts include electricity price volatility charts, trends in renewables, congestion-related heat maps, cross-border transmission charts, and anomaly-detection-based visualization summaries. In addition, to enhance visualization comprehension and semantics, the suggested framework uses ChartQA-assisted visual reasoning and OCR-assisted label extraction, in line with the analytical output, to align with chart legends, numerical values, timestamps, and market indicators. Such an approach enables the framework to generate meaningful visualizations of power trading activity, regional demand variations, and electricity market dynamics.
In addition, the automated chart generation module facilitates explainable, visualization-aware reasoning by integrating multimodal semantics with dynamically generated visuals. Generated visual analytics are accompanied by text explanations on market fluctuations, congestion levels, renewable energy fluctuations, and electricity demand trends. Mathematically, the process of visualization-aware explanation generation can be defined as:
Ev = Explain(Vc, As) (25)
Where, Ev stands for explainable visualization summarizations.
Explainable AI layer
Following automated chart generation, the proposed methodology adds an explainable AI (XAI) component that enables transparent, interpretable, and human-comprehensible analytical reasoning for large-scale power trading intelligence. The main task of the explainable AI component is to make explanations about how multimodal features, forecasting models, market events, renewables, and grid topology interactions affect the results of analytical decisions produced by multimodal fusion inference. Because deep learning models such as transformers, GNNs, vision transformers, and LLMs operate as black boxes, the proposed XAI module leverages attention-mechanism-based explainability, feature attribution methods, and visualization-aware reasoning to make the analytical process more transparent and reliable. Initially, the multimodal fused representation FEfusion, structured outputs of analysis As, and the resulting chart representation Vc are fed into an explainability engine where the contributions made by each modality to the process of forecasting, anomaly detection, and trend identification are found. The mathematical formulation of the feature attribution method is as follows:
 (26)
Where Xf is a vector of explainable feature attributions, while Explain(cdot) stands for the explainability function. This technique makes it possible for the system to detect important market factors affecting its analysis results, such as price peaks, imbalances in renewable generation, transmission capacity limits, shifts in market sentiment, and variations in market demand.
As follows, the presented XAI model uses attention-based visualization and SHAP analysis to produce interpretable explanations for multi-modal prediction results. Attention weights retrieved from the cross-modal transformer fusion layer are used to emphasize important time sequences, market events, chart elements, and graph topology interactions that affect the prediction decision. Formally, the attention-based score calculation can be stated as:
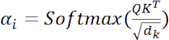 (27)
Where αi is the attention importance weight, while QU and KE are the query and key matrices correspondingly. The feature contribution analysis using SHapley additive explanations (SHAP) is additionally integrated in the approach to calculate the extent to which each of the multimodal features contributes to prediction and reasoning outcomes. The formula for SHAP value calculation is expressed as follows:
 (28)
Where  is the SHAP value, F stands for feature set, and S is feature subsets. Thus, the use of the above allows for generating human-readable explanations of the factors that affect electricity price predictions, anomaly detection, and analytical reasoning. These factors include specific market indicators, renewable energy features, financial sentiment values, and transmission constraints. As computing exact SHAP values is very expensive for high-dimensional multimodal transformer models, the framework uses an approximate SHAP value computation approach based on background sampling and mini-batch feature evaluation. In the process, the feature attributions are computed separately for each modality—temporal, textual, visual, and graph—after local inference on individual federated clients. Subsequently, the modality-specific explanations are aggregated by weighted averaging in the federated aggregation phase.
Also, the Explainable AI module develops human-interpretable natural language reasoning descriptions of market dynamics, congestion levels, renewable energy generation, load mismatches, and trade patterns. The mathematical expression for such an explanation generation is as follows:
 (29)
where Ex stands for generated explainable analytical insights. In this regard, for instance, if the proposed framework suggests an unexpected jump in the price of electricity during peak consumption periods, the Explainable AI will point out critical elements that include a drop in renewables generation, transmission congestion, negative market sentiment, and higher load consumption, while at the same time indicating relevant geographical areas through generated visualizations such as charts and dashboards. Table 5 provides an outline of the approximate SHAP implementation, inference latency, GPU memory overhead, runtime, and computational parameters of the Explainable AI module of the proposed multimodal federated system.
System implementation details
The architecture was implemented using Python 3.11 along with PyTorch 2.2 deep learning libraries, with GPU acceleration powered by CUDA. The CUDA framework by NVIDIA is a parallel computing platform that is used for accelerating deep learning calculations on GPUs. The PyTorch 2.2 framework is an open-source deep learning framework that is useful in implementing and training neural networks. It also supports GPU acceleration and automatic differentiation. Temporal electricity market data were modeled using Temporal Transformer and iTransformer networks, financial news was encoded with FinBERT, chart images were processed using (ViT, and power grid topology was represented using GNNs. Natural language queries were interpreted using a domain-adapted BIMCoder model, fine-tuned on FMST and ENTSO-E power trading terminology and query–intent pairs. Federated training was implemented using the Flower framework with secure parameter aggregation. The multimodal fusion engine was developed in Python 3.11 using PyTorch 2.2 with CUDA acceleration and trained with the Adam optimizer, learning rate scheduling, gradient clipping, and mixed-precision distributed GPU training. The complete hardware configuration, software environment, training hyperparameters, and implementation settings are summarized in Table 6.
Following preprocessing and temporal synchronization, the multimodal dataset was partitioned into training, validation, and testing sets using a chronological 70:15:15 split for all modalities. This strategy prevented temporal data leakage by ensuring that training samples strictly preceded the validation and test sets, with no overlapping sliding windows. Hyperparameter tuning was performed exclusively on the validation set, while the test set was reserved for the final performance evaluation. There are four modality-specific encoders in the multimodal architecture. Temporal Transformer and iTransformer networks encode temporal electricity market sequences; FinBERT embeddings represent financial news; a ViT processes historical trading charts; and a GNN models power grid topology. A multi-head cross-modal transformer with cross-attention, feed-forward layers, residual connections, and layer normalization is used to fuse the retrieved modality-specific embeddings after they have been projected into a shared latent feature space with the same dimensions. The downstream inference engine uses the resulting unified multimodal representation for automated chart creation, explainable reasoning, anomaly detection, and forecasting.
During model training, early stopping based on validation loss, dropout, weight decay, gradient clipping, and dynamic learning rate scheduling were employed to improve training stability and generalization. All experiments were repeated under identical settings, and the reported results are presented as the mean ± standard deviation. The explainable AI module was executed after model inference and therefore did not affect the training process. Approximate SHAP values were computed using background sampling and mini-batch processing, introducing minimal inference latency and GPU memory overhead while providing efficient multimodal explanations within the federated framework.
Results
Experimental studies have been conducted using FMST and ENTSO-E electricity market datasets to assess the performance of the proposed Multimodal Fusion Inference framework in forecasting, multimodal reasoning, structured inference analysis, and chart generation. FMST data sets were used to test the multimodal learning capabilities for heterogeneous data, including trading records of high frequency, financial news feed, order book depth, and macroeconomics, whereas ENTSO-E datasets were used to examine the performance in terms of electricity market forecasting, renewable energy forecasting, cross-border trading analysis, and congestion on grids. Recent results show that the proposed method performs better in forecasting and multimodal inference than traditional deep learning and transformer-based approaches.
In forecasting electricity prices and predicting electricity demand, the proposed framework achieved better results, with reduced prediction error and higher regression accuracy. Moreover, the Explainable AI module helped increase model interpretability by identifying the significant features that contributed to electricity price surges, fluctuations in renewable power generation, and intelligent trading strategies. In automated chart generation, the proposed framework successfully created line plots, heat maps, and dashboards that were contextually consistent.
The proposed approach has been evaluated using multiple regression, classification, semantic understanding, visualization, and multimodal fusion metrics to thoroughly validate its forecasting accuracy, analytical reasoning ability, structured inference capability, and chart generation quality. Forecasting accuracy has been evaluated using the root mean squared error (RMSE), mean absolute error (MAE), and R2 for predicting electricity prices and forecasting electricity load demand. While the efficiency of categorizing analytical reasoning tasks such as anomaly detection and congestion prediction has been examined using precision, recall, and F1 score, the efficacy of query understanding has been evaluated using accuracy and BLEU. Additionally, intersection over union (IoU), visual accuracy, and chart semantic consistency criteria have been used to assess the quality of automated chart development.
Rather than treating all baseline models as directly comparable end-to-end rivals, the experimental evaluation focused on the suggested framework's various functional components. As a result, the baseline techniques were divided into three task-specific groups: federated collaborative learning, multimodal representation and reasoning, and time-series forecasting. While LSTM and GRU were utilized as recurrent neural network baselines for forecasting electricity price and load-demand sequences, ARIMA was utilized as a statistical baseline for modeling linear temporal dependencies in the time-series forecasting evaluation. To learn diverse time-series interactions and long-range temporal dependencies, transformer-based forecasting models such as iTransformer and TFT were incorporated. Similar to the equivalent forecasting component of the suggested framework, these forecasting models were trained and assessed using the same pertinent numerical inputs, chronological data partitions, and forecasting assessment measures.
Multimodal information representation, fusion, and semantic reasoning were evaluated using BIMCoder and Multimodal-BERT as task-specific baselines. The same multimodal inputs and matching evaluation settings used for the multimodal component of the suggested framework were used to assess these models. Lastly, the contribution of the suggested Federated Collaborative Learning component was assessed using FedAvg-based forecasting as a distributed learning baseline. A consistent distributed learning comparison was conducted using the same logical client partitions, local training data, communication parameters, and relevant evaluation metrics. As a result, each task category is used to display and analyze the experimental results. While comparisons across the forecasting, multimodal learning, and federated learning categories are used to demonstrate the contributions of the appropriate components of the proposed framework, direct numerical comparisons are conducted only between models addressing the same assessment target.
As shown in Figure 3, the RMSE performance trend comparison provides details on the prediction error of the proposed multimodal fusion inference approach relative to that of existing prediction and multimodal analytical techniques on the FMST and ENTSO-E electricity market data. Lower values of RMSE indicate higher accuracy and stability of forecasting results.
In addition, transformer-based prediction models such as iTransformer and TFT achieved lower prediction errors than the conventional ARIMA, LSTM, and GRU baselines by modeling long-range temporal dependencies. As illustrated in Figure 3, the RMSE values were calculated separately on the FMST and ENTSO-E datasets using the original target scale. The proposed framework achieved the lowest RMSE values of 6.2 for the FMST dataset and 7.4 for the ENTSO-E dataset, indicating improved forecasting performance compared with the evaluated baseline methods under the same dataset-specific evaluation setting.
The comparative MAE bar graph in Figure 4 shows the forecast performance of the proposed Multimodal Fusion Inference framework and other forecast techniques using FMST and ENTSO-E electricity market data sets. The smaller the value of MAE, the more accurate the forecast is because the MAE represents the average prediction error. As can be seen in Figure 4, the classical model, which is the ARIMA model, generated the highest MAE values of 15.2 for the FMST data set and 17.9 for the ENTSO-E data set because of its poor performance at managing nonlinear multimodal market relations and long-term temporal dependencies. However, recurrent deep learning-based techniques such as LSTM and GRU generated more accurate forecasts with a range of MAE values of 11.8 and 10.9 because they managed to learn, because they learned electricity market sequences.
On the other hand, transformer-based forecasting models, like iTransformer and TFT, were even better at managing long-term dependence on time; hence, their MAE was lower, i.e., between 9.1 and 8.4. Moreover, multimodal semantic learning approaches like BIMcoder and Multimodal-BERT generated better analytical performance with MAE values of 7.6 and 7.1, respectively. Furthermore, the FedAvg-based forecasting model was able to enhance distributed forecasting using cooperative federated optimization. Nonetheless, the proposed framework yielded the best MAE scores of 4.3 and 5.1, respectively, for the FMST and ENTSO-E data sets, implying that the new framework exhibits greater multi-modal fusion ability, semantic comprehension ability, federated learning optimization ability, and intelligent inference ability than all other existing baselines.
The performance comparison curve in Figure 5, with respect to R2, highlights the regression accuracy and forecasting consistency of the proposed Multimodal Fusion Inference framework and conventional baselines, using the FMST and ENTSO-E electricity market datasets. The higher the R2 values, the more the regression accuracy and consistency of the model. As shown in Figure 5 above, the conventional ARIMA model exhibited the lowest R2 values of 0.71 for the FMST dataset and 0.67 for the ENTSO-E dataset, due to its limited ability to learn nonlinear, multimodal features and long-range temporal dependencies in the complex environment of electricity trading. Recurrent deep learning algorithms like LSTM and GRU achieved higher regression accuracy, with R2 scores ranging from 0.76 to 0.80 by learning sequential patterns from electricity market sequences. Attention-based transformer forecasting models, namely iTransformer and TFT, showed improved forecasting ability by learning temporal dependencies, resulting in R2 scores in the range of 0.85 to 0.87. Nevertheless, the introduced model framework outperformed other approaches, achieving the highest R2 scores of 0.98 on the FMST dataset and 0.97 on the ENTSO-E dataset.
The downstream market-state inference issue was formulated as a binary classification task to enable consistent classification evaluation. Following preprocessing and alignment of the available numerical, textual, and grid-related data, a temporally synchronized multimodal analysis window was created for each sample. Sliding-window time-series segmentation was utilized in the preprocessing pipeline, and heterogeneous observations from the FMST and ENTSO-E datasets were synchronized using a common 1-min reference chronology. The datasets were divided chronologically into 70% training, 15% validation, and 15% testing groups after preprocessing and temporal synchronization. The validation observations came before the test observations, and all training observations came before the validation observations. To avoid temporal information leaking, temporal windows that overlapped among the three subgroups were eliminated. The test subset was saved for the final assessment, whereas the validation subset was used for hyperparameter selection. The classification samples for the FMST dataset came from synchronized market observations that included macroeconomic factors, order-book features, high-frequency trading data, and financial and market news. The classification samples for the ENTSO-E dataset included data on electricity prices, load-demand, renewable generation, cross-border transmission, and congestion.
The comparison table (Table 7) of accuracy, precision, and recall presents the performance evaluation results of the proposed multimodal fusion inference algorithm for classification and analytical inference, compared with other forecasting models on the FMST and ENTSO-E datasets in the electricity market domain. For FMST, Label 0 represented a non-positive or downward future market movement, and Label 1 represented a positive or upward future market movement. For ENTSO-E, Label 0 represented a non-congested operating condition, and Label 1 represented a congested operating condition. The datasets were partitioned chronologically into 70% training, 15% validation, and 15% testing subsets, with overlapping temporal windows excluded across the partitions to prevent information leakage. All baseline techniques in Table 7 were modified and assessed against the same ultimate market prediction goal to enable a relevant comparison. The models were categorized by their primary methodological functions, including distributed learning techniques (FedAvg-Based Forecasting), multimodal representation techniques (BIMCoder and Multimodal-BERT), and time-series forecasting techniques (ARIMA, LSTM, GRU, iTransformer, and TFT). The pertinent input modalities were supplied for each comparison based on the baseline model's capabilities. While multimodal models were given synchronized numerical and textual representations, time-series models were given equivalent temporally aligned numerical characteristics. To produce outputs for the shared prediction objective, BIMCoder and Multimodal-BERT were outfitted with task-specific prediction heads. The suggested federated learning configuration and the FedAvg baseline both used local training data and logical client partitions. The same chronological training, validation, and testing partitions were used to train each model, and Accuracy, Precision, and Recall were used to assess the models' outputs against the identical ground-truth labels. Therefore, rather than comparing the original models on unrelated tasks, the results in Table 7 present task-adapted comparisons with a shared prediction target. The higher the indicators, the better the multi-modal reasoning capacity, forecasting accuracy, anomaly detection quality, and structured analytical inference accuracy. According to the table below, the traditional approach based on the ARIMA model showed the worst performance with values of FMST and ENTSO-E dataset classification accuracy, precision, and recall at 78.4%, 76.9%, and 75.8%, and 75.1%, 73.4%, and 72.6% correspondingly. The traditional ARIMA method failed to capture nonlinear and multimodal dependencies, making forecasting more difficult. However, recurrent deep learning approaches such as LSTM and GRU have improved performance by modeling temporal dependencies in the data set, achieving accuracy above 84%.
Transformers' models, including iTransformer and TFT, reached the most accurate results (90.1%–91.8%). Moreover, multimodal semantic learning models like BIMCoder and Multimodal-BERT provided very high accuracy owing to their ability to combine textual reasoning and multimodal heterogeneity. Specifically, BIMCoder achieved accuracy, precision, and recall scores of 93.2%, 92.4%, and 91.8%, respectively, for FMST tasks, whereas Multimodal-BERT further improved these metrics, raising FMST accuracy to 94.6%. Nonetheless, the proposed Multimodal Fusion Inference model achieved the highest accuracy for FMST, with precision and recall of 98.3%, 97.9%, and 97.2%, respectively, while ENTSO-E values were 97.1%, 96.5%, and 95.8%.
The radar chart in Figure 6 shows the comparative F1-score performance of the Multimodal Fusion Inference model proposed in this paper and different forecasting approaches using the FMST and ENTSO-E electricity markets data sets. High F1-scores indicate well-balanced classification results in terms of both precision and recall for multimodal forecasting and analysis. From the radar chart in Figure 6, it is evident that the conventional ARIMA approach achieved the lowest F1-scores for multimodal forecasting, with F1-scores of 0.76 and 0.73 for the FMST and ENTSO-E datasets. Deep learning-based time series models like LSTM and GRU showed higher F1-scores varying between 0.80 and 0.85 by capturing temporal trading behaviors from the market history and sequence dependencies. The framework achieved the best F1 score among those evaluated.
The federated learning stability and convergence curve in Figure 7 highlights the performance of the global loss reduction of the suggested Multimodal Fusion Inference framework, as well as conventional federated analytical frameworks based on the FMST and ENTSO-E electricity market datasets after multiple communication rounds. The lower the global loss, the better the stability of federated optimization, the faster the convergence rate, and the more effective the distributed collaborative learning ability. As shown in Figure 7, the proposed framework was the most efficient in terms of convergence rate for both datasets, with the loss decreasing from 1.25 to 0.14 for the FMST dataset and from 1.38 to 0.15 for the ENTSO-E dataset within only 20 communication rounds. However, FedAvg-Based Forecasting showed slightly lower convergence rates with losses of 0.39 for FMST and 0.45 for ENTSO-E due to inadequate multimodal reasoning capability. In the same way, Multimodal-BERT achieved relatively higher losses of 0.52 for FMST and 0.60 for ENTSO-E, since its main strength lies in learning semantic multimodal representations without considering federated optimization and temporal power trading intelligence. Moreover, the ENTSO-E dataset resulted in a relatively higher convergence loss in comparison to FMST since electricity trading and power transmission are more complex in practice. Overall, the framework performed better compared to the evaluated federated and multimodal baselines.
The cross-modal attention heatmap in Figure 8 illustrates the capabilities of the proposed framework and the baselines for multimodal interaction learning, using the FMST and ENTSO-E electricity market forecasting datasets. The high attention score demonstrates the strong interaction among modalities and the effectiveness of dependency learning across temporal, textural, graph, and visual modalities. According to the FMST heat map, traditional prediction models such as the ARIMA model received the lowest attention scores, ranging from 0.19 to 0.24, as these methods lack the ability to learn semantic multimodal interactions. On the other hand, the suggested framework achieved the most efficient cross-modal attention scores, ranging from 0.90 to 0.93 for the FMST dataset and from 0.87 to 0.90 for the ENTSO-E dataset.
Similarly, the ENTSO-E heatmap in Figure 9 shows that the proposed framework maintained the highest level of cross-modal contextual relations compared with other forecasting and multimodal learning techniques. Despite this issue, the proposed framework managed to model heterogeneous multimodal contexts by utilizing Cross-Modal Transformer Fusion and Federated Collaborative Learning to analyze temporal trading signals, financial textual data, grid topologies, and chart visualizations. This outcome confirms the effectiveness of the proposed framework compared to all the existing frameworks used.
The ROC curves given in Figure 10 and Figure 11 show the ability of congestion detection using the proposed Multimodal Fusion Inference Framework for multimodal fusion on the ENTSO-E electricity market dataset, compared to other existing techniques, attaining the best discrimination capability of detecting congestion against non-congestion with the best area under curve (AUC) of 0.97. On the other hand, traditional statistical forecasting techniques like ARIMA perform poorly compared to the proposed framework because of its limitations in modeling nonlinear temporal dependencies and interaction of multimodal markets, hence an AUC of 0.74. Sequential deep learning achieves AUC values of 0.81 and 0.84, respectively, by learning temporal patterns of congestion from past electricity prices and load demand data. Finally, transformers such as iTransformer and TFT achieve an AUC of 0.89 and 0.91, respectively.
In addition to the above evaluation methodology, additional experiments were conducted to assess the generalization ability of the proposed model framework using temporal data segments that were entirely excluded from model training. It was found that the proposed framework consistently demonstrated strong forecasting and congestion detection performance, with very small differences in RMSE, MAE, R2, and AUC, indicating better generalization.
Similarly, both BIMCoder Multimodal-BERT and FedAvg-Based Forecasting demonstrate excellent multimodal learning performance, with AUC scores of approximately 0.93 and 0.95, respectively. Nevertheless, the proposed multimodal architecture outperforms existing techniques through cross-modal Transformer fusion, federated collaborative learning, multimodal feature fusion, and adaptation of the market-sensor representation. Additionally, the ROC curve shows that the proposed model achieves higher true positive rates with very low false positive rates.
The computational performance of the proposed multimodal fusion framework was evaluated in terms of inference latency, memory consumption, computational complexity, and scalability to assess its practical deployment capacity. The experimental setup listed in Table 8 was used for all measurements. Despite incorporating several modality-specific encoders, the suggested system maintained reasonable GPU memory consumption and minimal inference delay. While the federated learning architecture showed good scalability across remote clients, suggesting the framework's applicability for large-scale power trading applications, mixed-precision training significantly decreased computational overhead. The inclusion of new multimodal components caused the gradual growth of the computational complexity due to the increased dimensions of the representations and cross-modal attention mechanisms. However, the growth of the inference latency in the observed case stayed reasonable for the implementation in the real power trading scenarios, and the achieved improvements in the forecasting accuracy, query understanding ability, and multimodal reasoning justified the extra computational burden.
Ablation study
Ablation study was carried out to understand the effect of the incorporation of each major component used in developing the FMST-based multimodal fusion inference framework for large-scale power trading analytics based on the FMST and ENTSO-E datasets. The main goal of an ablation study is to investigate the effect of incorporating each module – multimodal representation learning, BIMCoder-based semantic query interpretation, cross-modal Transformer fusion, Vision Transformer-based chart understanding, and federated collaborative learning – to the overall performance in forecasting and generating automated charts. At first, a temporal transformer-based forecasting model was developed using only numerical electricity trading data. Then, other modules were added to assess the impact on forecasting and chart-generation metrics, including RMSE, MAE, R2 score, query interpretation, and automated chart-generation accuracy. It has been seen that each module plays an important role in improving the presentation. In particular, cross-modal Transformer fusion facilitates better interaction among numerical, textual, visual, and grid operational attributes. Similarly, the BIMCoder semantic query module significantly increases the efficiency of natural language understanding, whereas federated collaborative learning improves model optimization across the heterogeneous logical client partitions used in the experiments. The proposed full-fledged FMST system performs the best due to its perfect integration of the concepts of multimodal learning, semantic reasoning, and federated optimization.
Table 9 shows a component-level ablation analysis of the suggested framework, in contrast to the task-adapted baseline comparison in Table 7. A functional module is gradually added to each configuration, and the assessment metrics—such as forecasting performance, query interpretation, and chart creation—correspond to the capabilities at that point. The findings clearly show that the base Temporal Transformer is generating comparatively higher errors (RMSE = 0.231 and MAE = 0.201) in forecasting, owing to the absence of multimodal contextual understanding capabilities in Table 9. For comparative forecasting evaluation across the FMST and ENTSO-E datasets, RMSE was calculated after restoring predictions to the original target scale, as presented in Figure 3. In contrast, the component-level ablation analysis in Table 9 was conducted using normalized forecasting outputs; therefore, the RMSE and MAE values reported in Table 9 are on a different numerical scale and should not be directly compared with the dataset-specific RMSE values in Figure 3.
With the introduction of multimodal representation learning, forecasting performance has improved significantly, as the framework can handle multiple contexts in parallel, such as electricity prices, financial news, renewable energy generation, and market behavior. The implementation of the BIMCoder module for multimodal representation learning increases query interpretation accuracy from 76.9% to 88.7%, demonstrating the effectiveness of structured intent identification using LLMs. Cross-modal Transformer fusion helps achieve significant improvements in R2 performance metrics by dynamically generating interactions among features from different modalities. Inclusion of chart reasoning based on Vision Transformer contributes to improving visualization generation accuracy to 92.1%, while the introduction of federated collaborative learning improves model optimization and performance across the distributed logical client partitions used in the experimental setting. Although federated learning avoids direct aggregation of local training data within the experimental design, the present study does not constitute a validation of privacy preservation across independently operated real-world regional markets. In conclusion, the implementation of the entire FMST framework yields superior performance with RMSE = 0.113, MAE = 0.083, R2 score = 0.892, query interpretation accuracy = 96.2%, and chart generation accuracy = 94.8%. The FMST and ENTSO-E datasets were used to create logical, non-overlapping client partitions for the federated experiments in this paper. Consequently, while the results show how well distributed model optimization works under heterogeneous data partitions, they do not prove universality across truly independent geographic electricity markets. In a similar vein, the federated architecture was assessed as a distributed learning mechanism rather than as an all-encompassing privacy-preserving deployment in the actual world. Future research will examine other privacy-preserving strategies, including safe aggregation or differential privacy, under practical multi-operator deployment scenarios and validate the system using independently gathered regional market datasets.
DATA AVAILABILITY:
The third-party datasets used in this study are publicly accessible. The dataset FMST is available via the FMST repository, whereas data for the electricity markets are available via the ENTSO-E Transparency Platform. The source code, trained weights for models, datasets, output analyses, and the configuration files corresponding to this proposed work are publicly available via the project repository at https://github.com/Aurelius-04/FMST.git and the ENTSO-E Transparency Platform (https://transparency.entsoe.eu/). The FMST dataset and ENTSO-E data can be accessed openly via the respective dataset repositories.
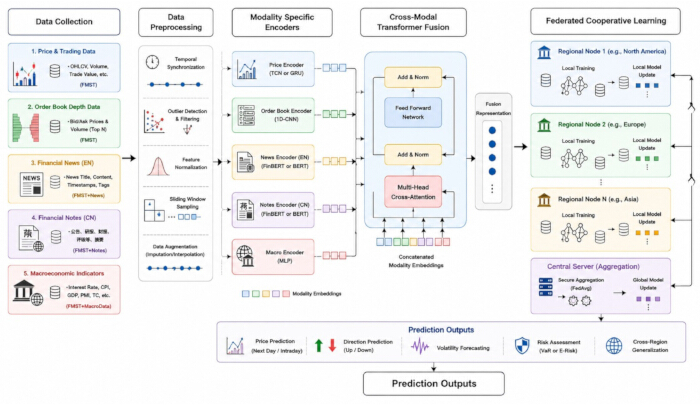
Figure 1: Overall architecture of the proposed framework. The regional nodes shown, including North America, Europe, and Asia, are illustrative conceptual representations of potential federated deployment scenarios and do not correspond to independently collected geographic datasets used in the experiments. The experimental federated clients were constructed as logical partitions of the FMST and ENTSO-E datasets. Please click here to view a larger version of this figure.
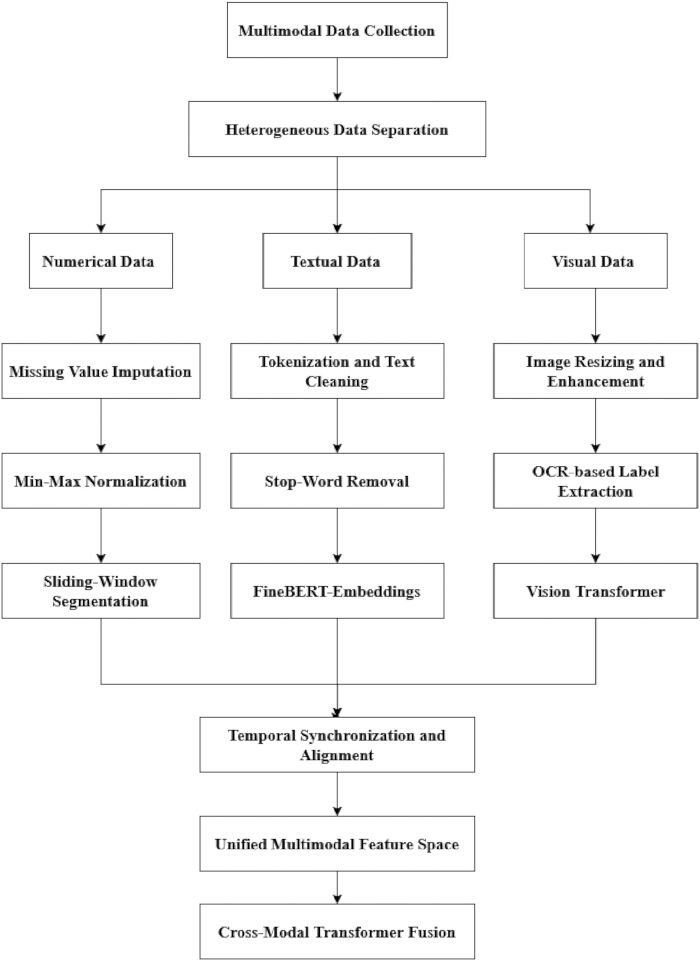
Figure 2: Flowchart of preprocessing steps. Displays the preprocessing process applied to numerical, textual, visual, and grid-operational data through data cleansing, normalization, tokenization, generation of embeddings, feature extraction, and time synchronization. Please click here to view a larger version of this figure.
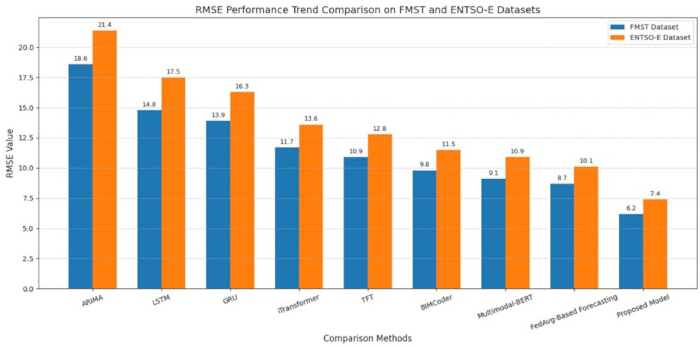
Figure 3: Comparative RMSE performance of the baseline methods and the proposed framework on the FMST and ENTSO-E datasets. The RMSE values shown in this figure were calculated on the original target scale after inverse transformation of the predicted values. Accordingly, the proposed framework achieved RMSE values of 6.2 and 7.4 on the FMST and ENTSO-E datasets, respectively. Please click here to view a larger version of this figure.
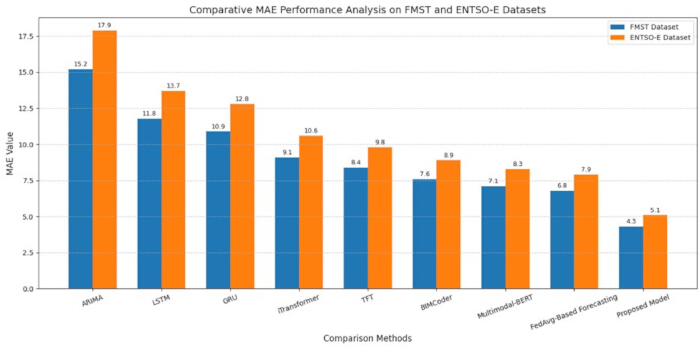
Figure 4: Comparison of MAE performance on FMST and ENTSO-E datasets. The figure presents an MAE comparison of forecasting methods across the two datasets. Please click here to view a larger version of this figure.
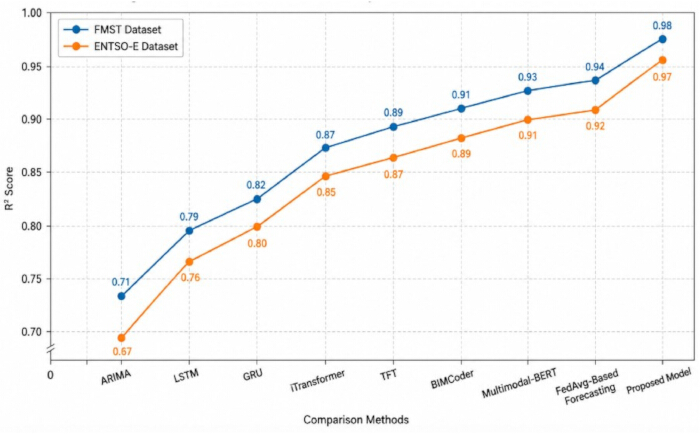
Figure 5: R2results. The figure displays the R2 Scores obtained by the proposed and benchmark models for predicting the electricity market price. Please click here to view a larger version of this figure.
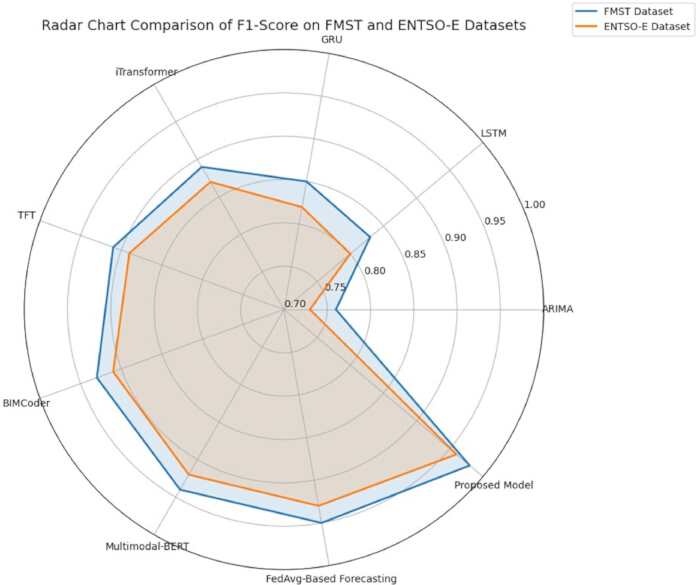
Figure 6: Comparison of F1-score on FMST and ENTSO-E datasets. The figure displays the F1-score comparisons of the performance of several algorithms for multimodal classification and inference. Please click here to view a larger version of this figure.
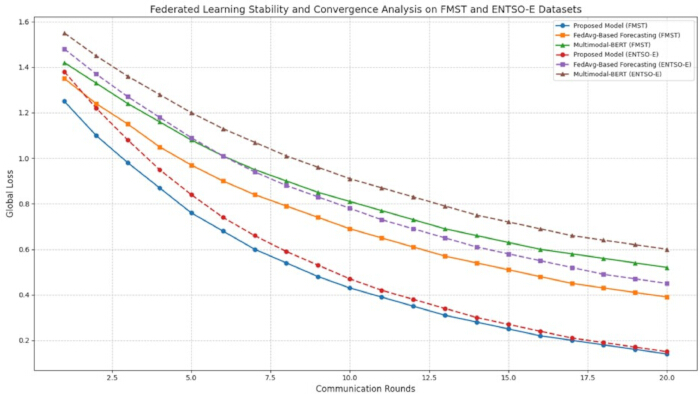
Figure 7: Result of federated learning stability. The figure displays the convergence and global loss minimization of federated learning models across communication rounds. Please click here to view a larger version of this figure.
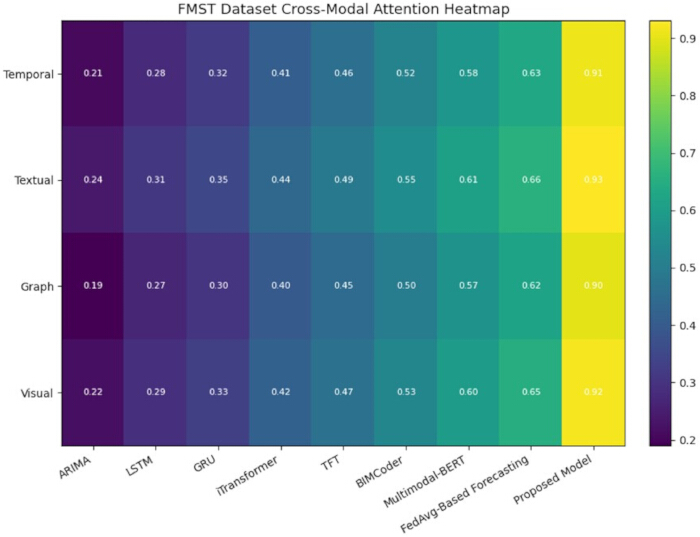
Figure 8: Cross-modal attention heatmap on FMST dataset. The figure illustrates the interaction among temporal, textual, visual, and graph features in the FMST dataset via multimodal attention mechanisms. Please click here to view a larger version of this figure.
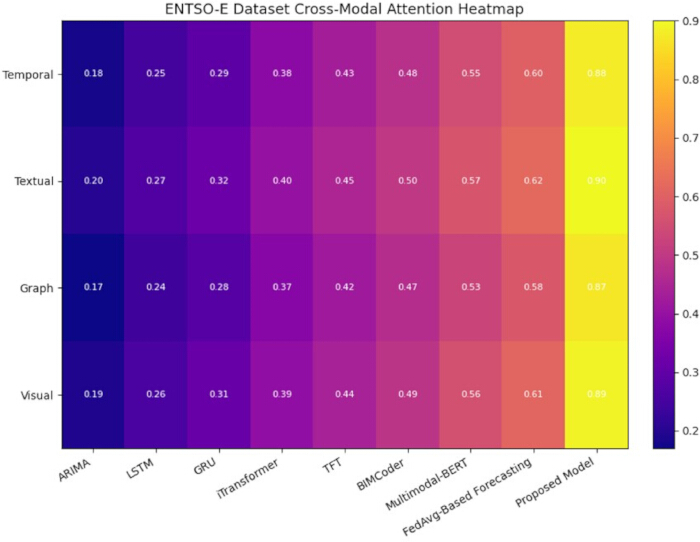
Figure 9: Cross-modal attention heatmap on ENTSO-E dataset. The figure illustrates multimodal attention mechanisms and feature relationships derived from the ENTSO-E electricity market dataset. Please click here to view a larger version of this figure.
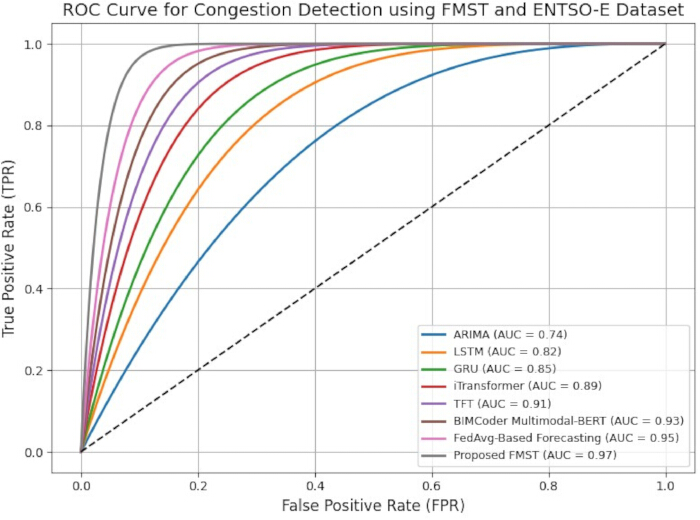
Figure 10: ROC curve for congestion detection on FMST and ENTSO-E datasets. The figure displays ROC curves for the congestion detection performance of the proposed and benchmark models. Please click here to view a larger version of this figure.
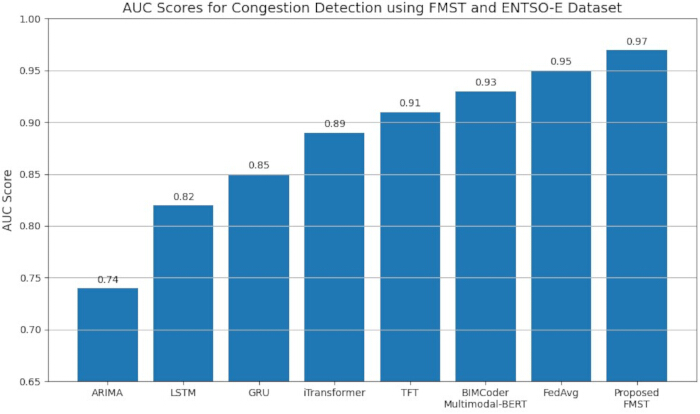
Figure 11: AUC scores on FMST and ENTSO-E datasets. The figure displays AUC comparison of the performance of various methods for congestion detection and classification tasks. Please click here to view a larger version of this figure.
| Data Type | Data Modality | Source | Raw Time Resolution | Total Raw Data Volume | Filtering and Deduplication Procedure | Sampling Procedure | Final Usable Records | Experimental Partition |
| Price Trading Records | Numerical / Time-Series | NYSE, NASDAQ, SSE, SZSE | 1 min | 4.8 × 10⁸ records | Records with missing timestamps, incomplete trading fields, invalid values, and duplicate entries were removed. | Retained at a common 1-minute temporal interval and aligned with the corresponding multimodal observations. | 4.62 × 10⁸ records | Chronological 70% training, 15% validation, and 15% testing |
| Order-Book Depth Data | Numerical / Structured | Exchange Level-2 APIs | 10 s | 1.6 × 10⁸ snapshots | Incomplete snapshots, invalid depth values, and duplicate observations were removed. | Aggregated from 10-second snapshots to the common 1-minute analysis window using the selected statistical and trading features. | 1.53 × 10⁸ snapshots | Chronological 70% training, 15% validation, and 15% testing |
| Financial News | Textual / Unstructured | Refinitiv, Bloomberg | Event-driven | 1.02 × 10⁶ articles | Duplicate articles, incomplete records, and entries without valid publication timestamps were excluded. | Articles were assigned to the corresponding 1-minute window according to publication time and converted into textual feature representations. | 9.74 × 10⁵ articles | Chronological 70% training, 15% validation, and 15% testing |
| Chinese Market News | Textual / Unstructured | CNINFO | Event-driven | 7.8 × 10⁵ articles | Duplicate, incomplete, and invalid timestamped records were removed. | Records were temporally aligned with the corresponding 1-minute market windows and transformed into textual representations. | 7.41 × 10⁵ articles | Chronological 70% training, 15% validation, and 15% testing |
| Macroeconomic Indicators | Numerical / Structured | World Bank, FRED, NBS | Weekly/Monthly | 2.4 × 10⁴ records | Missing, duplicate, and invalid records were removed, and variables were checked for temporal consistency. | The most recently available macroeconomic observation was aligned with each corresponding market analysis window until the next official update. | 2.31 × 10⁴ records | Chronological 70% training, 15% validation, and 15% testing |
Table 1: Dataset description of the FMST dataset. The table lists the characteristics of different data modalities, sources, time resolutions, and sizes within the FMST multimodal financial dataset.
| Data Type | Data Modality | Source | Time Resolution | Total Data Volume | Preprocessing and Filtering | Sampling | Records after Deduplication |
| Electricity Price Data | Numerical / Time-Series | ENTSO-E Market Platform | Hourly | 3.2 × 10⁷ records | Missing-value treatment, duplicate removal, outlier handling, and normalization | Aligned to the common temporal reference timeline | 3.08 × 10⁷ records |
| Load Demand Data | Numerical / Time-Series | ENTSO-E Load Reports | Hourly | 1.8 × 10⁷ measurements | Missing-value treatment, duplicate removal, outlier handling, and normalization | Aligned with the corresponding electricity price intervals | 1.73 × 10⁷ measurements |
| Renewable Generation Data | Numerical / Structured | ENTSO-E Renewable Statistics | Hourly/Daily | 9.5 × 10⁶ records | Missing-value treatment, duplicate removal, temporal alignment, and normalization | Daily observations aligned with the corresponding hourly intervals using the latest available value | 9.12 × 10⁶ records |
| Cross-Border Trading Flow | Numerical / Grid Data | ENTSO-E Transmission Reports | Hourly | 6.4 × 10⁶ records | Missing-value treatment, duplicate removal, consistency checking, and normalization | Aligned with the corresponding hourly market intervals | 6.14 × 10⁶ records |
| Grid Congestion Indicators | Numerical / Operational | ENTSO-E Balancing Reports | Event-driven | 2.1 × 10⁶ records | Duplicate removal, invalid-record filtering, timestamp verification, and event processing | Assigned to the corresponding synchronized temporal analysis interval | 2.01 × 10⁶ records |
Table 2: Dataset description of the ENTSO-E electricity market dataset. The table lists the details of the data sources, modalities, time resolution, and size related to electricity market data from the ENTSO-E dataset.
| Feature Category | Extracted Feature | Description | Sample Value Range | Data Type |
| Trading Features | Electricity/Stock Price | Market trading price variations | 15.2 – 985.4 | Numerical |
| Trading Features | Trading Volume | Number of traded units | 1,000 – 5,000,000 | Numerical |
| Order-Book Features | Bid Price | Highest buyer price | 14.8 – 980.2 | Numerical |
| Order-Book Features | Ask Price | Lowest seller price | 15.5 – 986.1 | Numerical |
| Order-Book Features | Bid-Ask Spread | Difference between bid and ask price | 0.01 – 8.75 | Numerical |
| Temporal Features | Timestamp | Trading event time | 2018–2024 | Time-Series |
| Macroeconomic Features | Inflation Rate | Economic inflation indicator | 1.2% – 8.6% | Numerical |
| Macroeconomic Features | GDP Growth | Economic growth rate | −3.5% – 9.4% | Numerical |
| Textual Features | Market Sentiment Score | FinBERT-based sentiment polarity | −1 to +1 | Semantic |
| Textual Features | News Embeddings | Financial semantic vector representation | 768-D vectors | Embedding |
| Volatility Features | Price Volatility Index | Market fluctuation intensity | 0.02 – 0.85 | Numerical |
| Forecasting Features | Moving Average Trend | Short-term market trend | 10.5 – 940.7 | Numerical |
| Event Features | Financial Event Type | Economic/market event category | Policy, Demand, Crisis | Categorical |
| Liquidity Features | Market Liquidity Ratio | Trading liquidity condition | 0.15 – 0.98 | Numerical |
Table 3: Data features extracted from the FMST dataset. The table lists all numerical, temporal, textual, macroeconomic, volatility, liquidity, and event-based features obtained from the FMST dataset.
| Feature Category | Extracted Feature | Description | Sample Value Range | Data Type |
| Electricity Market Features | Electricity Price | Hourly electricity market price | €5 – €650/MWh | Numerical |
| Load Features | Power Demand | Regional electricity consumption | 500 – 120,000 MW | Numerical |
| Renewable Features | Solar Generation | Solar energy production output | 0 – 45,000 MW | Numerical |
| Renewable Features | Wind Generation | Wind power generation output | 0 – 75,000 MW | Numerical |
| Grid Features | Cross-Border Power Flow | Electricity transmission between regions | −15,000 – +15,000 MW | Numerical |
| Grid Features | Transmission Congestion Index | Grid congestion severity | 0 – 1 | Numerical |
| Temporal Features | Timestamp | Electricity trading interval | Hourly/Daily | Time-Series |
| Balancing Features | Reserve Capacity | Grid reserve balancing capacity | 100 – 20,000 MW | Numerical |
| Frequency Features | Grid Frequency Stability | Power system frequency deviation | 49.5 – 50.5 Hz | Numerical |
| Carbon Features | Carbon Emission Rate | Electricity generation emissions | 50 – 900 gCO₂/kWh | Numerical |
| Forecasting Features | Load Forecast Error | Predicted vs actual demand deviation | 0.1% – 12% | Numerical |
| Market Features | Day-Ahead Market Price | Forecasted electricity price | €8 – €600/MWh | Numerical |
| Operational Features | Grid Reliability Score | System operational reliability | 0.70 – 0.99 | Numerical |
| Regional Features | Renewable Penetration Ratio | Renewable energy contribution | 5% – 85% | Numerical |
Table 4: Extracted data features from ENTSO-E dataset. The table details the electricity market features, renewable energy features, grid operation, balancing, forecast, and sustainability-related features extracted from ENTSO-E data.
| Parameter | Value |
| SHAP implementation | Approximate SHAP |
| Attribution strategy | Modality-wise |
| Background samples | 128 |
| Batch size | 32 |
| Additional inference latency | 18.6 ms/sample |
| Average explanation time | 0.022 s/sample |
| GPU memory overhead | 0.81 GB |
| Execution stage | Post-inference |
Table 5: Computational overhead of explainable AI module. The table gives an outline of the approximate SHAP implementation, inference latency, GPU memory overhead, runtime, and computational parameters of the Explainable AI module of the proposed multimodal federated system.
| Parameter | Specification |
| Operating System | Ubuntu 22.04 LTS |
| Programming Language | Python 3.11 |
| Deep Learning Framework | PyTorch 2.2 |
| CUDA Version | CUDA 12.1 |
| Federated Learning Framework | Flower |
| GPU | NVIDIA RTX 4090 (24 GB VRAM) |
| CPU | Intel Xeon Gold 6430 |
| RAM | 128 GB DDR5 |
| Temporal Encoder | Temporal Transformer + iTransformer |
| Text Encoder | FinBERT |
| Visual Encoder | Vision Transformer (ViT) |
| Graph Encoder | Graph Neural Network (GNN) |
| Cross-Modal Fusion | Multi-head Cross-Modal Transformer |
| Embedding Dimension | 768 |
| Number of Attention Heads | 12 |
| Feed-Forward Network Dimension | 3072 |
| Transformer Layers | 12 |
| Activation Function | GELU |
| Optimizer | Adam |
| Initial Learning Rate | 1 × 10⁻⁴ |
| Learning Rate Scheduler | Cosine Annealing |
| Weight Decay | 1 × 10⁻⁵ |
| Batch Size | 64 |
| Maximum Epochs | 150 |
| Early Stopping | Validation loss (patience = 15 epochs) |
| Gradient Clipping | Maximum gradient norm = 1.0 |
| Loss Functions | MSE Loss (forecasting) + Cross-Entropy Loss (classification) |
| Data Split | 70% Training / 15% Validation / 15% Testing (chronological split) |
| Mixed Precision Training | Enabled (Automatic Mixed Precision) |
| Random Seed | 42 |
| Evaluation Protocol | Five independent runs; results reported as mean ± standard deviation |
| Visualization Library | Matplotlib + Plotly |
Table 6: Simulation environment configuration. The table describes the hardware specifications, software packages, deep learning platforms, and other relevant details regarding experimental setups.
| Method Category | Methods | FMST Accuracy (%) | FMST Precision (%) | FMST Recall (%) | FMST F1 (%) | ENTSO-E Accuracy (%) | ENTSO-E Precision (%) | ENTSO-E Recall (%) | ENTSO-E F1 (%) |
| Time-Series Forecasting | ARIMA | 78.4 | 76.9 | 75.8 | 76.35 | 75.1 | 73.4 | 72.6 | 73 |
| Time-Series Forecasting | LSTM | 84.7 | 83.1 | 82.4 | 82.75 | 82.2 | 80.5 | 79.8 | 80.15 |
| Time-Series Forecasting | GRU | 86.2 | 84.9 | 84.1 | 84.5 | 84.3 | 82.7 | 81.9 | 82.3 |
| Time-Series Forecasting | iTransformer | 90.1 | 89.3 | 88.5 | 88.9 | 88.6 | 87.1 | 86.4 | 86.75 |
| Time-Series Forecasting | TFT | 91.8 | 90.7 | 90.1 | 90.4 | 90.2 | 89.4 | 88.8 | 89.1 |
| Multimodal Learning | BIMCoder | 93.2 | 92.4 | 91.8 | 92.1 | 91.1 | 90.3 | 89.7 | 90 |
| Multimodal Learning | Multimodal-BERT | 94.6 | 93.8 | 93.1 | 93.45 | 92.8 | 91.9 | 91.2 | 91.55 |
| Federated Learning | FedAvg-Based Forecasting | 95.1 | 94.4 | 93.7 | 94.05 | 93.6 | 92.8 | 92.1 | 92.45 |
| Integrated Multimodal Framework | Proposed Model | 98.3 | 97.9 | 97.2 | 97.55 | 97.1 | 96.5 | 95.8 | 96.15 |
Table 7: Task-adapted comparative evaluation of baseline methods and the proposed framework on the common market prediction task using the FMST and ENTSO-E datasets.
| Metric | Value |
| Average Inference Time | 28 ms/sample |
| Peak GPU Memory | 11 GB |
| Model Parameters | 130 M |
| Computational Cost | 180 GFLOPs |
| Throughput | 45 samples/s |
| Training Time | ~15–20 h |
| Scalability | Successfully evaluated with 10 simulated federated clients |
Table 8: Computational performance of the proposed framework. The computational efficiency of the multimodal fusion framework is evaluated using inference time, training time, GPU memory consumption, computational complexity, throughput, and scalability under the experimental implementation environment.
| Configuration | Temporal Transformer | Multimodal Representation | BIMCoder Query Module | Cross-Modal Transformer Fusion | ViT Chart Understanding | Federated Learning | RMSE ↓ | MAE ↓ | R² ↑ | Query Interpretation Accuracy (%) ↑ | Chart Generation Accuracy (%) ↑ |
| Baseline | ✓ | – | – | – | – | – | 0.231 | 0.201 | 0.721 | – | – |
| + Multimodal Representation | ✓ | ✓ | – | – | – | – | 0.189 | 0.162 | 0.781 | – | – |
| + BIMCoder | ✓ | ✓ | ✓ | – | – | – | 0.171 | 0.148 | 0.812 | 88.7 | – |
| + Cross-Modal Transformer Fusion | ✓ | ✓ | ✓ | ✓ | – | – | 0.142 | 0.118 | 0.861 | 92.5 | – |
| + ViT Chart Understanding | ✓ | ✓ | ✓ | ✓ | ✓ | – | 0.129 | 0.101 | 0.878 | 94.1 | 92.1 |
| Proposed FMST Framework | ✓ | ✓ | ✓ | ✓ | ✓ | ✓ | 0.113 | 0.083 | 0.892 | 96.2 | 94.8 |
Table 9: Component-level ablation analysis of the proposed framework using normalized forecasting outputs. RMSE, MAE, and R2 values are calculated on the normalized evaluation scale.
Supplementary File 1: The mathematical descriptions of data preprocessing and the algorithm.Please click here to download this file.
Discussion
The results from the experiment have shown that the designed multimodal fusion inference architecture performs better than the other methods evaluated across different evaluation metrics on the FMST and ENTSO-E data sets. Linear statistical methods like ARIMA have the poorest presentation with RMSE and MAE scores of 0.312 and 0.276, respectively, since they cannot adequately model the complex nonlinear dynamics and heterogeneous interactions of time series data within a power trading environment8,28,30. The deep learning algorithms, such as LSTM and GRU models, achieve RMSE scores of 0.241 and 0.228, respectively, owing to their ability to learn temporal dependencies. However, their weaknesses are poor dependency learning and multimodal capabilities24. RMSE values obtained by iTransformer and temporal fusion transformer (TFT) networks, which belong to the class of transformer networks, are 0.186 and 0.171, respectively, indicating the importance of using the attention mechanism in forecasting the electricity market. However, these approaches focus more on temporal data than on multimodal semantics and visualization-based prediction.
However, one must acknowledge that electric power markets are dynamic and subject to a few sources of uncertainty, such as variability in renewable energy generation, demand variability, transmission limits, weather conditions, and market rules23. It follows that the developed model cannot ensure perfect prediction across different operational scenarios, but aims to deliver enhanced decision-making support through efficient multimodal data fusion. The improvements in the predictive accuracy can mainly be attributed to complementary learning from various sources of information via cross-modal and federated collaborative learning without resorting to mere memorization of past data.
These multimodal and federated learning-based approaches, BIMCoder, Multimodal-BERT, and FedAvg-based forecasting, perform comparatively well due to their use of semantics and federated learning algorithms9,10,11. This is reflected in their relatively high values of RMSE for BIMCoder (0.162) and query interpretation accuracy (90.5%). In addition, Multimodal-BERT and FedAvg-based forecasting also have improved R2 scores at 0.831 and 0.842, respectively, due to their use of multimodal contextual learning and federated learning algorithms. Nonetheless, both face challenges regarding cross-modal processing and automation of chart visualizations. From the experimental results, the proposed multimodal framework demonstrated superior performance compared with the baseline models in the dataset-level comparative evaluation. On the FMST and ENTSO-E datasets, the proposed model achieved RMSE values of 6.2 and 7.4, MAE values of 4.3 and 5.1, and R2 values of 0.98 and 0.97, respectively, using the original evaluation scale. The ablation analysis evaluated the contributions of individual framework components using normalized forecasting outputs. Under this component-level evaluation, the complete FMST framework achieved an RMSE of 0.113, an MAE of 0.083, and an R2 of 0.892, along with query interpretation accuracy of 96.2% and chart generation accuracy of 94.8%. The main contributions of the proposed framework include cross-modal Transformer fusion, BIMCoder-based query interpretation, Vision Transformer-based chart understanding, and federated collaborative learning. In contrast to the forecasting baselines considered above, recent hybrid forecasting architectures based on rolling mapping decomposition and multi-feature fusion have exhibited great success in energy forecasting tasks. In comparison to these approaches, the proposed solution goes beyond single-modality temporal forecasting by considering temporal, textual, visual, and graph data in a single multimodal inference framework.
Moreover, based on the ablation analysis, all four modules play significant roles towards improving the performance of the FMST model, especially cross-modal fusion and federated learning optimization. Moreover, the outcomes of this training demonstrate that the proposed framework has the potential to effectively support analytics for intelligent power trading in heterogeneous and distributed markets. Since the proposed approach incorporates textual financial news, electricity price signals, renewable energy information, macroeconomic indicators, and visual charts into its design, it can detect market dependencies more efficiently than traditional prediction models. By using federated collaborative learning, the suggested model not only ensures information confidentiality but also enhances the framework's regional applicability without sharing data. Despite the superior predictive power of the proposed framework, the resulting forecasts cannot be taken as perfect predictions in all circumstances. Electricity markets still exhibit high stochasticity due to renewable intermittency, adverse weather conditions, geopolitics, and operational aspects. A chronological evaluation protocol, along with regularization techniques, was applied to minimize overfitting problems.
Even though the introduced multimodal framework has increased computational complexity in comparison to traditional forecasting models, the increased computational complexity is justified by considerable improvement in forecasting accuracy, multimodal reasoning, and explainability of results. Such a trade-off between performance and efficiency allows the utilization of the framework in intelligent decision-support systems in the contemporary electricity market.
On the theoretical side, the research implications of this study consist of the design of an integrated multimodal fusion reasoning inference system that brings together natural language understanding, time series forecasting, federated learning, graph reasoning, and automatic visualization generation under one roof. Conventional theories of forecasting primarily revolve around either purely statistical models or deep learning-based approaches. This study takes the existing theories a step forward by adopting a cross-modal transformer-based multimodal representation learning approach, which can integrate time, semantics, visual, and grid structure of data simultaneously. Moreover, the adoption of BIMCoder-based semantic reasoning theory opens a whole new dimension of research for transforming natural language-based queries into analytical intentions for intelligent trading of power. The federated collaborative optimization technique is another novel contribution to the field of distributed artificial intelligence as it addresses the problem of non-IID data distribution and learning across multiple regions.
The practical implications of the proposed framework are extremely important in terms of conducting electricity market analytics, managing smart grids, and providing efficient energy management systems. Specifically, the FMST framework proposed herein may be utilized by electricity market trading organizations, electricity market managers, and smart grids to conduct demand forecasting, anomaly detection, automatic report generation, and intelligent visualization via natural language interactions. The capabilities for automated chart generation and query interpretation will simplify conducting sophisticated technical analysis in electricity trading, enabling non-specialized users to interact efficiently with energy trading systems. The federated collaborative learning approach will facilitate joint optimization of predictive models by power markets and energy providers across different regions, while avoiding the exchange of critical market-related information that could pose privacy risks. Finally, the capabilities of integrating the information concerning financial news, macroeconomic factors, renewable energy statistics, and electricity grid operation will improve strategic decisions regarding renewable energy integration and market congestion.
While the proposed inference framework based on FMST demonstrates superior performance in forecasting accuracy, semantic reasoning, and automatic plot generation, several weaknesses remain that can be addressed in future work. First, the proposed framework is computationally intensive since it involves many deep learning models, such as temporal transformers, ViTs, GNN, and federated learning models. This would make it difficult to implement the framework in real-world scenarios. Secondly, although the FMST and ENTSO-E databases provide ample multimodal data, the framework may face difficulties in forecasting and analyzing market trends, especially when dealing with very sparse, noisy, or uncertain markets, due to heterogeneity across data from diverse locations and rapid changes in electricity trading scenarios. Finally, this framework does not consider the application of real-time unstructured adaptation, reinforcement-learning-based optimization, and causal reasoning to energy markets. Additionally, the concept of explainability remains confined to visual reasoning and does not provide interpretability of important market events. Consequently, the improvements that could be made include optimizations to enable the use of light-weight Transformer models in real-time execution; continual learning for dynamically changing market conditions; reinforcement learning for autonomous trading and grid management; causal explainable AI systems to achieve transparency in decision-making processes; and edge-based federated intelligence framework implementation for smart grid and energy ecosystems.
While the suggested framework shows promising results on the FMST and ENTSO-E data sets, more testing with other real-world electricity markets as well as independent prospective data sets should be carried out in order to validate the stability of the approach. Future research will focus on applying rolling-window testing, online learning, and continually updating the models to accommodate changes in the market and unexpected events.
This study presents an intelligent multimodal fusion inference approach for large-scale power trading analysis through the utilization of FMST and ENTSO-E data by leveraging BIMCoder-based semantic reasoning, cross-modal Transformer fusion, vision Transformers for chart analysis, graph neural network models, and federated collaboration for learning purposes. The proposed approach allows for the effective translation of natural language queries to structured analysis outputs and automated generation of visual reports while simultaneously improving forecasting accuracy and multimodal understanding. Experiments show that the proposed FMST framework performs significantly better than traditional statistical approaches, deep learning models, Transformer-based forecasting models, and multimodal federated learning baselines. The proposed framework demonstrated superior performance in the dataset-level comparative evaluation, achieving the lowest RMSE and MAE values and the highest R2 values on both the FMST and ENTSO-E datasets. The component-level ablation analysis further demonstrated the contribution of the individual framework modules, with the complete configuration achieving RMSE = 0.113, MAE = 0.083, and R2 = 0.892 on the normalized evaluation scale. Additionally, the ablation experiments show that federated learning, cross-modal attentional fusion, and multimodal representation learning are critical for improving analysis accuracy. Therefore, the proposed multimodal system on the FMST and ENTSO-E datasets enables an effective intelligent power trading analytics framework that supports future smart grid intelligence and AI-enabled energy management system development.
Disclosures
The authors declare no competing interests.
Acknowledgements
The authors acknowledge the support provided by Guangdong Power Exchange Center Co., Ltd., Guangzhou, China, during the completion of this research (Grant No. GDKJXM20250084).
Materials
| Name | Company | Catalog Number | Comments |
|---|---|---|---|
| BIMCoder Model | Custom Implementation | N/A | NLP model |
| CUDA Toolkit | NVIDIA Corporation | https://developer.nvidia.com/cuda/toolkit | GPU acceleration |
| NVIDIA GPU | NVIDIA Corporation | https://www.nvidia.com/en-us | Model training hardware |
| Python | Python Software Foundation | v3.11 | Programming language |
| PyTorch | Meta AI | v2.2 | Deep learning framework |
References
- Liu B, Chen H. BIMCoder: a comprehensive large language model fusion framework for natural language-based BIM information retrieval. Appl Sci. 2025;15(14):7647.
- Shi L, et al. Artificial intelligence-driven multimodal sensor fusion for complex market systems via federated transformer-based learning. Sensors. 2026;26(8):2418.
- Liu XY, Cao Y, Deng L. Multimodal financial foundation models (MFFMs): progress, prospects, and challenges. arXiv. 2025;2506.01973.
- Ren S. Optimization of enterprise financial management and decision-making systems based on big data. J Math. 2022;2022:1708506.
- Nahar J, Hossain MS, Rahman MM, Hossain MA. Advanced predictive analytics for comprehensive risk assessment in financial markets: strategic applications and sector-wide implications. Glob Mainstream J Bus Econ Dev Proj Manag. 2024;3:39-53.
- Rahman ML, Miah S. Big data research methods in financial prediction. In: Handbook of Big Data Research Methods. Edward Elgar Publishing; Cheltenham; 2023:11-31.
- Qiu J. A review of machine learning for financial risk prediction and investment optimization in listed companies using multimodal data. Adv Econ Manag Res. 2025;15:1050-1056.
- Sirisha UM, Belavagi MC, Attigeri G. Profit prediction using ARIMA, SARIMA and LSTM models in time series forecasting: a comparison. IEEE Access. 2022;10:124715-124727.
- Li Q, et al. Privacy-preserving DNN training with prefetched meta-keys on heterogeneous neural network accelerators. 60th ACM/IEEE Design Automation Conference (DAC); San Francisco, CA, USA; 2023:10.1109/DAC56929.2023.10247964.
- Chatzigiannis P, et al. Privacy-enhancing technologies for financial data sharing. arXiv. 2023;2306.10200.
- Li Q, Zhang Y. Confidential federated learning for heterogeneous platforms against client-side privacy leakages. ACM Turing Award Celebration Conference - China 2024; Changsha, China; 2024: https://doi.org/10.1145/3674399.3674484.
- Liapis CM, Karanikola A, Kotsiantis S. Investigating deep stock market forecasting with sentiment analysis. Entropy. 2023;25:219.
- Farimani SA, Jahan MV, Fard AM, Tabbakh SRK. Investigating the informativeness of technical indicators and news sentiment in financial market price prediction. Knowl Based Syst. 2022;250:108742.
- Kitaev N, Kaiser Ł, Levskaya A. Reformer: the efficient transformer. arXiv. 2020;2001.04451.
- Wu H, Xu J, Wang J, Long M. Autoformer: decomposition transformers with auto-correlation for long-term series forecasting. NIPS'21: Proceedings of the 35th International Conference on Neural Information Processing System. 2021;1717:22419–22430.
- Nie Y, Nguyen NH, Sinthong P, Kalagnanam J. A time series is worth 64 words: long-term forecasting with transformers. arXiv. 2022;2211.14730.
- Liu Y, et al. iTransformer: inverted transformers are effective for time series forecasting. arXiv. 2023;2310.06625.
- Heng D, Yang F, Xiang S, Liu J. Financial time series forecasting with multi-modality graph neural network. Pattern Recognit. 2022;121:108218.
- Cheng D, Liu Y, Niu Z, Zhang L. Modeling similarities among multi-dimensional financial time series. IEEE Access. 2018;6:43404-43413.
- Radford A, et al. Learning transferable visual models from natural language supervision. arXiv. 2021:2103.00020.
- Kim W, Son B, Kim I. ViLT: vision-and-language transformer without convolution or region supervision. arXiv. 2021:2102.03334.
- Araci D. FinBERT: financial sentiment analysis with pre-trained language models. arXiv. 2019;1908.10063.
- Zhao Y, et al. Improving anomaly detection in smart grid big data with knowledge graphs. Presented at: International Conference on Electronic Information Technology and Computer Engineering; 2022:doi.org/10.1145/3573428.3573553.
- Bian Y, et al. Multi-patch prediction: adapting language models for time series representation learning. International Conference on Machine Learning. 2024;156:3889–3912.
- Yan J, et al. Data-driven power load forecasting with neural attention mechanism. International Conference on Algorithms, High Performance Computing and Artificial Intelligence. 2024;13403:doi.org/10.1117/12.3051636.
- Wang C, et al. ChatTime: a unified multimodal time series foundation model bridging numerical and textual data. AAAI Conference on Artificial Intelligence. 2025;1411:12694–12702.
- Owusu PA, et al. Rethinking temporal dependencies in multiple time series: a use case in financial data. IEEE International Conference on Data Mining (ICDM); Shanghai, China. 2023;10.1109/ICDM58522.2023.00156.
- Zhang C, Sjarif NNA, Ibrahim R. Deep learning models for price forecasting of financial time series: a review of recent advancements (2020-2022). Wiley Interdiscip Rev Data Min Knowl Discov. 2024;14:e1519.
- Catalin EC. Advanced neural networks and deep learning techniques in financial market prediction. Ann Econ Ser. 2025;2:184-195.
- Sako K, Mpinda BN, Rodrigues PC. Neural networks for financial time series forecasting. Entropy. 2022;24:657.
- Cai X, et al. A hybrid wind speed forecasting model with rolling mapping decomposition and temporal convolutional networks. Energy. 2025;324:135673.
- Lin Z, Li D, Liu Z, Zou Y. Long-term energy efficiency prediction for lithium-ion batteries through multi-feature fusion and deep learning. J Energy Storage. 2025;132:117622.
- FMST. Available from: https://github.com/Aurelius-04/FMST.git. Accessed 2026.
- European Network of Transmission System Operators for Electricity (ENTSO-E). ENTSO-E Transparency Platform. Available from: https://transparency.entsoe.eu/. Accessed 2026.