N6-methyladenosine (m6A)-related genes are dysregulated in breast cancer, with limited correlation to methylation or copy number alterations. Six genes, including YTHDF3, were prognostic. YTHDF3 is an independent prognostic factor, implicated in RNA metabolism, DNA repair, telomere stability, and immune infiltration. Its upregulation was confirmed clinically, warranting further investigation.
Research Article
Comprehensive Analysis of m6A Regulators Identifies YTHDF3 as a Promising Prognostic Biomarker for Breast Cancer
* These authors contributed equally
In This Article
Summary
Abstract
The expression landscape and prognostic value of N6-methyladenosine (m6A)-related genes remain largely uncharacterized in breast cancer. Here, we performed an integrative analysis of their expression profiles and clinical relevance. Utilizing multi-omics datasets and experimental validation, we conducted a systematic investigation of m6A-related genes in breast cancer. These genes exhibited pronounced differential expression in breast cancer, yet their correlation with molecular features such as promoter methylation and copy number alterations was limited. Univariate survival analysis indicated that aberrant expression of RBM15B, METTL16, HNRNPC, YTHDF1, YTHDF3, and IGF2BP1 was significantly linked to patient prognosis. Multivariate Cox regression further identified elevated YTHDF3 expression as an independent prognostic factor. Functional network analysis indicated YTHDF3 is potentially involved not only in RNA processing and metabolism but also in DNA repair, pri-miRNA processing, telomere stability, and immune infiltration. Moreover, upregulation of YTHDF3 mRNA was confirmed in clinical breast cancer specimens. Collectively, m6A-related genes are dysregulated in breast cancer and correlate with patient outcomes, highlighting their biomarker potential, with YTHDF3 warranting in-depth investigation.
Introduction
Breast cancer is a highly heterogeneous malignancy and has become the most commonly diagnosed cancer worldwide, representing a leading cause of cancer-related mortality among women, with an estimated 2.3 million new cases and over 680,000 deaths in 20201,2. Despite therapeutic advances, a definitive cure for all patients remains elusive, underscoring the need to identify molecular biomarkers for early diagnosis and prognosis.
Aberrant epigenetic modifications are a hallmark of cancer3. Among diverse RNA modifications, N6-methyladenosine (m6A) is an epitranscriptomic mark increasingly recognized for its role in breast cancer4. m6A is a reversible modification predominantly deposited in the 3’-UTRs of mammalian mRNAs and is orchestrated by “writers” (methyltransferases), “erasers” (demethylases), and “readers” (binding proteins)5. Emerging evidence implicates m6A-related genes in tumor development and progression6. However, the landscape of m6A regulatory factors in breast cancer remains poorly defined, and comprehensive genetic and epigenetic analyses are lacking.
In this study, we identified differentially expressed m6A-related genes in breast cancer using public omics databases and experimental validation. We further assessed their clinical prognostic value and explored underlying molecular mechanisms through survival analysis and regulatory network prediction.
Protocol
Gene expression and survival data
The Cancer Genome Atlas (TCGA) cohort data comprising 1,034 breast cancer tumor samples and 104 normal adjacent tissues (NATs) were obtained from The Human Protein Atlas, along with clinical information for 947 patients7. These data were used to analyze the mRNA expression profiles of m6A-related genes and their association with prognosis. Additionally, we used the Kaplan-Meier Plotter (KMplotter) online tool, which aggregates multiple breast cancer datasets, to validate the association between YTHDF3 expression and survival8. To further validate expression patterns, we also included data from 92 healthy breast tissues from the Genotype-Tissue Expression (GTEx) project via Breast Cancer Gene-Expression Miner v4.79,10. The protein and mRNA levels of YTHDF3 in different subtypes of breast cancer and normal tissues were analyzed by UALCAN, based on the Clinical Proteomic Tumor Analysis Consortium (CPTAC) and TCGA dataset11.
Genetic and epigenetic evaluation
Genetic alterations were examined using cBioPortal, focusing on the invasive breast cancer dataset (TCGA, Provisional, 1,108 cases)12. Promoter methylation data were retrieved from MethHC, which included 839 breast cancer samples and partially paired adjacent normal controls13.
Gene regulation network and immune infiltration analysis
Protein-protein interactions were explored with STRING (confidence score set to 0.4)14. Gene annotation and pathway enrichment were conducted using Metascape (p < 0.01, minimum count of 3, enrichment factor > 1.5)15. The association of YTHDF3 expression in breast cancer with immune infiltration, including B cells, CD8+ T cells, CD4+ T cells, macrophages, neutrophils, and dendritic cells (DCs), was analyzed by using the Tumor Immune Estimation Resource (TIMER). Gene expression level normalized with tumor purity was displayed on the leftmost panel16.
Quantitative reverse transcription polymerase chain reaction (qRT-PCR)
All participants provided written informed consent, and the study was approved by the ethics committee of the Affiliated Hospital of Southwest Medical University (approval no. KY2022124) and was conducted in accordance with the principles of the Declaration of Helsinki. Frozen breast tumor specimens and matched adjacent non-tumor specimens were used for total RNA extraction. The concentration and purity of the extracted RNA were assessed using a spectrophotometer, and only samples with A260/A280 ratios of 1.8–2.0 were included. RNA integrity was confirmed by 1.5% agarose gel electrophoresis. First-strand cDNA was then generated from 1 µg of total RNA in a 20 µL reaction following the manufacturer’s instructions. Quantitative real-time PCR was performed, with each 20 µL reaction containing 10 µL of 2× SYBR Green master mix, 0.4 µL of forward and reverse primers (each 10 µM), 2 µL of diluted cDNA (1:10), and 7.2 µL of nuclease-free water. qRT-PCR was performed as previously described17. Primers were: β-actin-F, GAAGATCAAGATCATTGCTCCT; β-actin-R, TACTCCTGCTTGCTGATCCA; YTHDF3-F, AAAAGACGGGCCTCTTCCTC; YTHDF3-R, TTGGCCGAGTGATTGTTCCA. Thermocycling conditions were 95 °C for 3 min, followed by 40 cycles of 95 °C for 10 s, 55 °C for 20 s, and 72 °C for 20 s (fluorescence acquisition at 72 °C). Melt curve analysis (95 °C to 60 °C, increment 0.5 °C/s) was performed to confirm primer specificity. Relative expression was calculated using the 2−ΔΔCt method.
Statistical method
Unpaired t-tests were used for two-group comparisons. Kaplan-Meier survival analysis with the log-rank test and multivariate Cox regression was used to assess prognostic factors. For qRT-PCR validation, paired samples were compared using a two-tailed paired Student’s t-test on ΔCt values. For Figure 1, pairwise comparisons were performed using the Dunnett-Tukey-Kramer test. P < 0.05 was considered statistically significant.
Results
Differential mRNA expression of m6A-related genes in breast cancer
Analysis of TCGA and GTEx data (1,034 tumors, 104 NATs, 92 healthy tissues) revealed that most m6A-related genes were differentially expressed (Figure 1). Relative to healthy breast tissues, 10 genes were significantly upregulated: KIAA1429, RBM15, RBM15B, HNRNPC, YTHDF1, YTHDF2, YTHDF3, IGF2BP1, IGF2BP3, and ALKBH5 (all P < 0.0001, except RBM15 P < 0.001). Eight genes were downregulated: WTAP, METTL3, METTL14, HNRNPA2B1, YTHDC1, YTHDC2, IGF2BP2, and FTO (P < 0.05 to P < 0.0001). METTL16 and eIF3A showed no significant difference. When comparing tumors to NATs, HNRNPA2B1 was upregulated, whereas YTHDF3, eIF3A, and ALKBH5 were downregulated; RBM15, RBM15B, and YTHDF2 showed no difference (Figure 1). The use of NATs as controls has been questioned, possibly explaining the discrepancies with healthy tissue comparisons18,19. Interestingly, a trend toward higher YTHDF3 protein abundance across all breast cancer subtypes was observed in the CPTAC dataset compared with normal tissues (P < 0.0001). In addition, significantly higher mRNA expression of YTHDF3 was observed only in luminal subtypes of breast cancer compared with normal tissues (P = 0.004, < 0.01) (Supplemental Figure S1). Overall, significant dysregulation of m6A-related genes is evident in breast cancer.
Promoter methylation and gene amplification of m6A-related genes in breast cancer
DNA methylation plays an important role in epigenetic regulation of gene transcription, and the promoter hypermethylation inhibits mRNA expression20. MethHC analysis demonstrated significant promoter methylation differences only for IGF2BP1, IGF2BP2, and IGF2BP3 in tumors versus controls (P < 0.005). The downregulation of IGF2BP2 mRNA may be partly attributed to its hypermethylation. cBioPortal analysis showed that WTAP and ALKBH5 exhibited mRNA downregulation, while KIAA1429 (VIRMA), YTHDF1, YTHDF3, and IGF2BP1 displayed gene amplification associated with their upregulation (Supplemental Figure S2, Supplemental Figure S3, and Supplemental Figure S4). These findings suggest that the mRNA levels of m6A-related genes are not predominantly driven by promoter methylation or gene amplification.
Survival analysis of m6A-related genes in breast cancer
Survival analysis of 947 patients revealed that low RBM15B expression and high expression of METTL16, HNRNPC, YTHDF1, YTHDF3, and IGF2BP1 were significantly correlated with reduced overall survival (Figure 2 and Figure 3). Multivariate Cox regression, adjusting for age, stage, and race, confirmed that YTHDF3 upregulation was an independent predictor of poor overall survival (HR: 1.024, 95% CI: 1.003–1.046, P = 0.024) (Table 1). For external validation, analysis using the KMplotter online tool showed that high YTHDF3 expression predicts poor disease prognosis (Supplemental Figure S5). Other genes were not independently significant (Supplemental Table S1).
Potential molecular network and immune infiltration of m6A-related gene YTHDF3
STRING analysis of YTHDF3 (with limited interactors to 50) identified a network with 224 edges and significant enrichment (P < 1e-16). YTHDF3 is closely associated with METTL3, ALKBH5, WTAP, METTL14, and others (Figure 4A). Metascape enrichment analysis identified 13 significant functional clusters (P < 0.01, minimum count of 3, enrichment factor > 1.5; Figure 4B). The top-ranked cluster was mRNA metabolic regulation (GO1903311, 22 genes). Additional cancer-relevant clusters included DNA dealkylation repair (GO0006307), pri-miRNA processing (GO0031053), and telomerase stabilization (GO1904356), among others. The complete list of cluster names, associated genes, and enrichment statistics is provided in Supplemental Table S2. Furthermore, the results revealed significant positive correlations between YTHDF3 expression and immune cells (all P < 0.01) (Supplemental Figure S6). Thus, YTHDF3 upregulation may be associated with mRNA metabolism, DNA repair, telomere maintenance, and immune infiltration.
Upregulated mRNA expression of YTHDF3 in breast cancer
Breast cancer tissues and matched adjacent normal breast tissues were collected from 20 patients who underwent surgery at the Department of Breast Surgery, the Affiliated Hospital of Southwest Medical University, between July 2023 and October 2023. qRT-PCR analysis of these paired samples showed significantly higher YTHDF3 mRNA expression in tumor tissues than in adjacent normal tissues (P = 0.001) (Supplemental Figure S7 and Supplemental Table S3).
Data Availability
All datasets analyzed in this study are publicly available from the following open-access repositories. Gene expression and clinical data: Breast cancer RNA-seq expression data and corresponding clinical information were obtained from The Cancer Genome Atlas (TCGA-BRCA) via The Human Protein Atlas (https://www.proteinatlas.org/). Additional normal breast tissue expression data were retrieved from the Genotype-Tissue Expression (GTEx) project (dbGaP accession phs000424.v8.p2) through Breast Cancer Gene-Expression Miner v4.7 (http://bcgenex.ico.unicancer.fr/). Survival validation was performed using the Kaplan-Meier Plotter (https://kmplot.com). Protein and mRNA expression data were obtained via UALCAN (http://ualcan.path.uab.edu/). Genetic alterations: Somatic mutation and copy-number alteration data for the invasive breast cancer dataset (TCGA, Provisional, 1108 samples) were accessed via cBioPortal (https://www.cbioportal.org/). DNA promoter methylation: Methylation data were obtained from MethHC (http://methhc.mbc.nctu.edu.tw/), which contains 839 breast cancer samples and partly paired adjacent normal controls. Protein-protein interaction and pathway enrichment: Functional network analysis was performed using STRING v12.0 (https://string-db.org/, confidence score 0.4) and Metascape (http://metascape.org/). Immune infiltration analysis was performed using TIMER (https://cistrome.shinyapps.io/timer/).Any additional data underlying the figures are available from the corresponding author upon reasonable request.
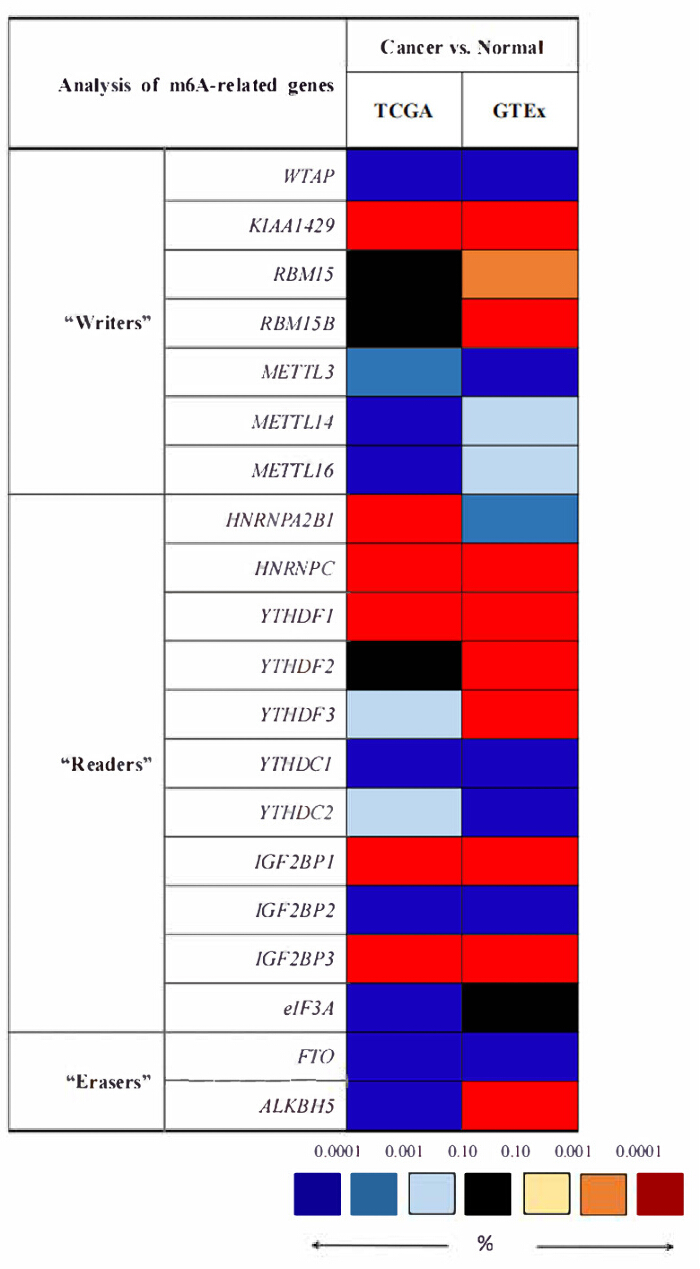
Figure 1. Differential mRNA expression of N6-methyladenosine (m6A)-related genes in breast cancer. Red indicates upregulation; blue indicates downregulation, black indicates no expression difference, and white indicates no gene expression data. Color coding reflects statistical significance. The Dunnett-Tukey-Kramer test was used for pairwise comparisons. Note: “Normal” comprises the comparison between tumors and NATs in TCGA, as well as the comparison between tumors and healthy tissues in GTEx. Abbreviations: NATs = normal adjacent tissues; TCGA = The Cancer Genome Atlas; GTEx = Genotype-Tissue Expression. Please click here to view a larger version of this figure.
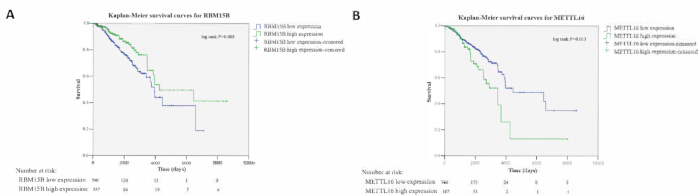
Figure 2. Association between aberrant mRNA expression of the m6A “writers” RBM15B and METTL16 and overall survival in breast cancer patients. (A) Low expression of RBM15B was associated with a shorter overall survival (log-rank test, P = 0.008, <0.01); (B) High expression of METTL16 was associated with poor prognosis (log-rank test, P = 0.013, <0.05). Patients were dichotomized into high- and low-expression groups using the optimal cut-off value. n = 947 (TCGA-BRCA cohort). The blue and green curves represent the low- and high-expression groups, respectively. The unit of mRNA expression was Fragments Per Kilobase of transcript per Million mapped reads. Abbreviation: TCGA-BRCA = The Cancer Genome Atlas Breast Invasive Carcinoma; m6A = N6-methyladenosine. Please click here to view a larger version of this figure.
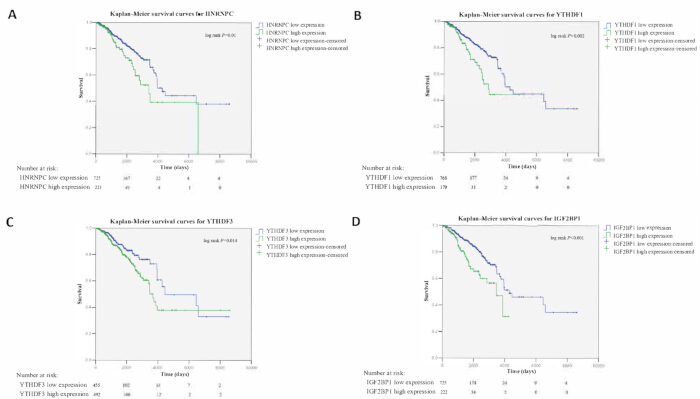
Figure 3. Correlation between aberrant mRNA expression of the m6A “readers” HNRNPC, YTHDF1, YTHDF3, and IGF2BP1 with overall survival in breast cancer patients. (A) High HNRNPC mRNA expression was associated with a reduced overall survival (log-rank test, P = 0.01, <0.05). (B-D) High expression of YTHDF1, YTHDF3, and IGF2BP1 was significantly associated with poorer prognosis (log-rank test, P = 0.002, P = 0.014, and P < 0.001, respectively). Patients were dichotomized into high- and low-expression groups using the optimal cut-off value. n = 947 (TCGA-BRCA cohort). The blue and green curves represent the low- and high-expression groups, respectively. The unit of gene mRNA expression was Fragments Per Kilobase of transcript per Million mapped reads. Abbreviations: TCGA-BRCA = The Cancer Genome Atlas Breast Invasive Carcinoma; m6A = N6-methyladenosine. Please click here to view a larger version of this figure.
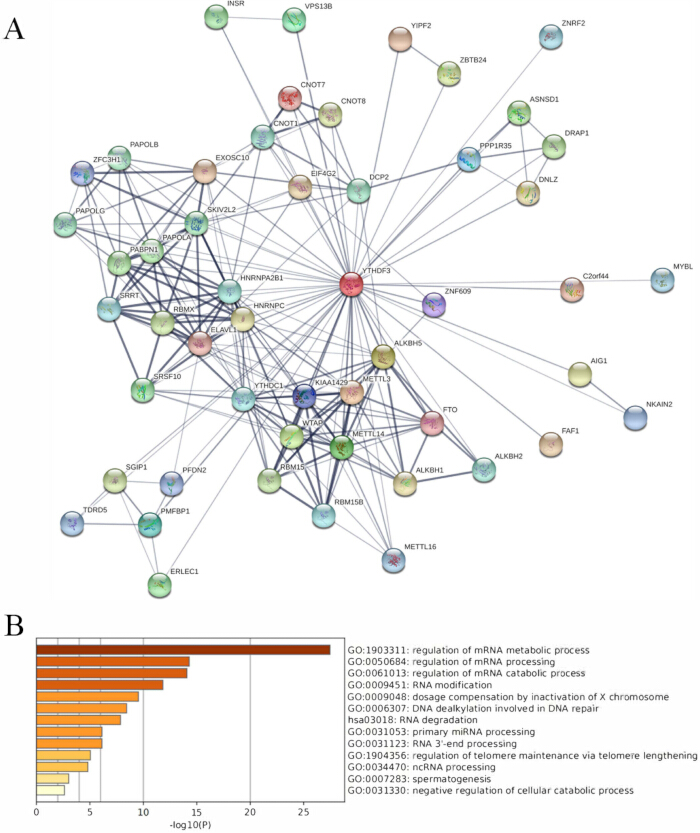
Figure 4. The potential molecular regulatory network of YTHDF3. (A) Protein interaction network constructed by querying the STRING database with YTHDF3 as the bait (confidence score ≥ 0.4, maximum interactors = 50). Edge widths denote the strength of supporting evidence. (B) Metascape analysis identified 13 significant functional clusters (P < 0.01, minimum count = 3, enrichment factor > 1.5). Ontology sources included Kyoto Encyclopedia of Genes and Genomes pathways and Gene Ontology Biological Processes. Please click here to view a larger version of this figure.
| Parameters | HR | 95% CI | p-value |
| YTHDF3 | 1.024 | 1.003-1.046 | 0.024 |
| Age | 1.036 | 1.023-1.050 | <0.001 |
| Race | 1.275 | 0.892-1.821 | 0.182 |
| Stage | 2.263 | 1.796-2.851 | <0.001 |
Table 1: Multivariate Cox survival regression analysis results of m6A-related gene YTHDF3. Abbreviations: HR = hazard ratio; 95% CI = confidence interval.
Supplemental Figure S1. The protein and mRNA levels of YTHDF3 in different subtypes of breast cancer and normal tissues from the CPTAC and TCGA datasets. The protein expression of YTHDF3 in (A) primary tumors and normal tissues and (B) breast invasive carcinoma subtypes. Z-values indicate the number of standard deviations from the median value across samples for the corresponding cancer type. CPTAC log2 spectral count ratio values were normalized first within each sample profile and then across samples. (C) The mRNA expression (RNA-seq, Fragments Per Kilobase of transcript per Million mapped reads) of YTHDF3 in different subtypes of breast invasive carcinoma. Abbreviations: CPTAC = the Clinical Proteomic Tumor Analysis Consortium; TCGA = The Cancer Genome Atlas. Please click here to download this file.
Supplemental Figure S2. Promoter methylation status of m6A-related genes retrieved from the MethHC database. (A) Promoter methylation of m6A “writers” in breast cancer and normal controls. (B) Promoter methylation of m6A “erasers” in breast cancer and normal controls. (C) Promoter methylation of m6A “readers” in breast cancer and normal controls. Red, breast cancer; green, normal controls. *P < 0.05, **P < 0.005. Abbreviation: m6A = N6-methyladenosine. Please click here to download this file.
Supplemental Figure S3. Gene mutation and copy number alterations analyzed by cBioPortal for m6A “writers” and “erasers” (TCGA, Provisional, n = 1,108). (A) Alterations in m6A “writers.” (B) Alterations in m6A “erasers.” Bar plots indicate the frequency of each alteration type: missense mutations, amplifications, deep deletions, and multiple alterations. Only genes with an alteration frequency ≥ 1% are shown. The overall alteration frequency per gene is displayed on the right. Abbreviations: TCGA = The Cancer Genome Atlas; m6A = N6-methyladenosine.Please click here to download this file.
Supplemental Figure S4. Gene mutation and copy number alterations analyzed by cBioPortal for m6A “readers” (TCGA, Provisional, n = 1,108). Bar plots indicate the frequency of each alteration type: missense mutations, amplifications, deep deletions, and multiple alterations. Only genes with an alteration frequency ≥ 1% are shown. The overall alteration frequency per gene is displayed on the right. Abbreviations: TCGA = The Cancer Genome Atlas; m6A = N6-methyladenosine.Please click here to download this file.
Supplemental Figure S5. Correlation of YTHDF3 with survival of breast cancer patients in KMplotter. (A) High YTHDF3 mRNA expression was associated with a reduced overall survival (P = 0.011, <0.05). (B-D) High expression of YTHDF3 was significantly associated with poorer recurrence-free survival, distant metastasis-free survival, and postprogression survival (P = 1.9e-09, P = 0.06, and P = 0.029, respectively). All P values were calculated by the log-rank test. The number of patients at risk is shown below each plot. The optimal cut-off was determined by the tool’s auto-select best cutoff feature. Abbreviation: KMplotter = Kaplan-Meier Plotter. Please click here to download this file.
Supplemental Figure S6. Correlation of YTHDF3 expression with immune infiltration in breast cancer. YTHDF3 expression positively correlated with infiltration levels of B cells, CD4+ T cells, CD8+ T cells, macrophages, neutrophils, and DCs in the TIMER dataset. Tumor purity was used as a covariate in the partial Spearman correlation analysis. Abbreviations: DCs = dendritic cells; TIMER = Tumor Immune Estimation Resource. Please click here to download this file.
Supplemental Figure S7. Quantitative reverse transcription polymerase chain reaction validation of YTHDF3 mRNA expression in 20 paired breast cancer tissues and adjacent normal tissues. YTHDF3 mRNA levels were normalized to β-actin. Data are presented as 2⁻ΔΔCt values. Statistical comparison was performed using a two-tailed paired Student’s t-test on ΔCt values (P = 0.001). Abbreviations: NC = adjacent normal breast tissues; BrCa = breast cancer tissues.Please click here to download this file.
Supplemental Table S1. Summarized results of multivariate survival analysis in m6A-related genes. Abbreviations: HR = hazard ratio; 95% CI = confidence interval.Please click here to download this file.
Supplemental Table S2. The annotation and enrichment results of 13 YTHDF3-related genes based on Metascape.Please click here to download this file.
Supplemental Table S3. Clinical information of 20 paired breast cancer samples.Please click here to download this file.
Discussion
Despite therapeutic improvements, early diagnosis and personalized therapy for breast cancer remain a challenge, necessitating the discovery of novel molecular targets21. This study integrated multi-omics data to characterize m6A-related genes in breast cancer. Our results demonstrate widespread dysregulation of these genes, largely independent of promoter methylation or gene amplification, and link aberrant expression of several genes, particularly YTHDF3, to poor prognosis. We further confirmed YTHDF3 upregulation in clinical samples and predicted its involvement in cancer-related pathways.
m6A methylation is installed by a “writer” complex including WTAP, KIAA1429, RBM15, METTL3, and METTL1422. Although WTAP is oncogenic in diverse malignancies23,24,25, its downregulation in breast cancer implies context-dependent functions. KIAA1429 upregulation is consistent with its reported role in regulating CDK1 in breast cancer25. RBM15, known to affect hematopoiesis and sarcomas26,27, was upregulated, while RBM15B upregulation was associated with better survival, aligning with its positive correlation with BAP128. METTL3 downregulation, despite reports of its inhibition of let-7g, has been observed by others29,30. METTL14 downregulation is consistent with its tumor suppressor role via m6A modification31. METTL16 expression remains controversial and requires further study29,32.
Regarding “erasers”, FTO was downregulated in our cohort, similar to some TCGA-based studies29, though contrasting reports suggest it promotes progression via BNIP333. ALKBH5 showed variable expression depending on the control group and has been implicated in maintaining breast cancer stemness under hypoxia34,35.
The YTH domain-containing “readers” recognize m6A, along with HNRNPC and HNRNPA2B136. HNRNPA2B1 was upregulated, in line with its role in STAT3/ERK1/2 signaling37,38. HNRNPC upregulation is consistent with its function in regulating dsRNA-induced interferon responses39.
YTHDF1 and YTHDF2 exhibit dual roles in various cancers40,41. Accumulating evidence implicates YTHDF3 in oncogenic processes: it promotes hepatocellular carcinoma via EGFR/STAT342, glioblastoma via EGFR/ATK/ERK/p2143, and cervical cancer metastasis by metabolic reprogramming44. Our study revealed upregulation of YTHDF1, YTHDF2, and YTHDF3 in breast cancer versus healthy tissues, with YTHDF3 upregulation further validated experimentally. This supports further investigation of YTHDF3 in breast cancer. YTHDC1 and YTHDC2 were downregulated, although other studies report their prometastatic roles in endometrial and colon cancer45,46.
IGF2BP proteins also serve as m6A readers47. IGF2BP1 upregulation aligns with its known role in supporting clonogenic growth48. IGF2BP2 was downregulated, potentially due to promoter methylation, contrasting with reports of its promigratory role49. IGF2BP3 upregulation is consistent with its promotion of proliferation via TRIM2550 and cooperative metastasis with IGF2BP2 in triple-negative breast cancer51. eIF3A, though downregulated here, has been proposed as a therapeutic target52,53. Copy number gains have been reported to correlate with YTHDF1 and IGF2BP1 expression in other cancers54. These findings reinforce that m6A dysregulation is pervasive in breast cancer.
Critically, we identified YTHDF3 as an independent prognostic factor, corroborating recent studies55,56,57,58,59. Other m6A genes like FTO and IGF2BP3 have also been linked to poor prognosis and chemoresistance in breast cancer33,60,61.
Our pathway enrichment highlighted expected roles for YTHDF3 in RNA metabolism62. More notably, it suggested involvement in DNA dealkylation repair via ALKBH family members63,64. Furthermore, links to pri-miRNA processing through HNRNPA2B1, SRRT, and METTL365,66,67,68, and to telomerase stabilization via EXOSC10 and DCP269, suggest possible multifaceted mechanisms. Intriguingly, YTHDF3 overexpression has been associated with breast cancer brain metastasis by enhancing translation of ST6GALNAC5 and GJA170. Recent studies have further expanded its oncogenic repertoire: YTHDF3 was shown to enhance glycolysis and proliferation through the mTOR-HIF1α-LDHA axis71; to promote osteolytic bone metastasis via m6A-dependent translation of ZEB1 and SMAD572; in triple-negative breast cancer, YTHDF3 stabilizes CENPI mRNA to drive tumorigenesis73; and it facilitates epithelial-mesenchymal transition and metastasis by recruiting eIF4B to stimulate Notch2 translation74. Consistently, recent studies further highlight the broader m6A regulatory network in breast cancer, including piR-1170/WTAP-mediated methylation reprogramming in brain metastasis75 and POP1-dependent, YTHDF2-recognized degradation of CDKN1A mRNA in TNBC76. These studies suggest that YTHDF3 may be involved in diverse malignant processes. Thus, YTHDF3 may represent a promising prognostic biomarker, although further mechanistic studies on its role in breast cancer growth, apoptosis, and metastasis are essential.
Interestingly, TIMER analysis indicated a general positive correlation between YTHDF3 expression and the infiltration levels of several immune cell subsets in breast cancer. The biological basis for this observation is currently unknown and may reflect an overall alteration of the tumor microenvironment in YTHDF3-high tumors. Dedicated immunogenomic and functional studies are required to dissect the specific role of YTHDF3 in shaping the immune landscape of breast cancer.
This study has several limitations. First, the analyses rely primarily on public datasets; integrating TCGA and GTEx data may introduce batch effects due to differences in sample processing, sequencing platforms, and normalization pipelines, and the retrospective nature of these databases carries inherent selection and annotation biases. Second, the clinical validation cohort was small with limited follow-up, and newly discovered m6A-related genes were not included. Third, independent cohort validation of YTHDF3’s prognostic value is lacking, and the inconsistencies between mRNA and protein expression remain unresolved. Moreover, direct in vivo and in vitro evidence for the biological function of YTHDF3 in breast cancer is absent, drug-sensitivity or treatment-response analyses were not performed, and the specific mechanisms by which YTHDF3 mediates m6A modification on its downstream targets have not been explored. These caveats warrant cautious interpretation of our findings. Future prospective studies with standardized protocols, larger sample sizes, and functional experiments are necessary to validate YTHDF3 as a biomarker and elucidate its mechanistic role in breast cancer.
In conclusion, this integrative analysis comprehensively evaluated m6A-related genes in breast cancer. While genetic and epigenetic alterations had a limited impact on gene expression, the genes were broadly dysregulated and associated with prognosis. Our findings indicate that YTHDF3 may serve as an independent prognostic biomarker, warranting further biological investigation into breast cancer.
Disclosures
The authors have no conflicts of interest to declare.
Acknowledgements
This work was funded by the Natural Science Foundation of Sichuan Province (grant number: 2022NSFSC1425), Sichuan Medical Association Tumor Special Research Project (grant number: 2024HR20), Luzhou - Southwest Medical University Research Project (grant number: 2024LZXNYDJ051), Beijing Xisike Clinical Oncology Research Foundation (grant number: Y-SS2025MS-0009), and Beijing Kechuang Medical Development Foundation (grant number: KC2023-JX-0288-BM74).
Materials
| Name | Company | Catalog Number | Comments |
|---|---|---|---|
| Breast Cancer Gene-Expression Miner v4.7 | Omics Data Science Unit of Integrated Center for Oncology | http://bcgenex.ico.unicancer.fr/ | Used to retrieve GTEx normal breast tissue expression data; listed in Methods/Data Availability |
| cBioPortal | Not applicable | https://www.cbioportal.org/ | Genetic alteration and copy-number alteration analysis; listed in Methods/ Data Availability |
| Clinical Proteomic Tumor Analysis Consortium (CPTAC) | Clinical Proteomic Tumor Analysis Consortium | Not applicable | Proteomic dataset used via UALCAN; listed in Methods/Data Availability |
| Genotype-Tissue Expression (GTEx) project | GTEx Consortium | dbGaP accession phs000424.v8.p2 | Normal breast tissue expression data source; listed in Methods/Data Availability |
| Hieff qPCR SYBR Green Master Mix (No Rox) | YEASEN | qPCR master mix; listed in author revision | |
| Hifair III 1st Strand cDNA Synthesis SuperMix for qPCR | YEASEN | First-strand cDNA synthesis; listed in author revision | |
| Kaplan-Meier Plotter (KMplotter) | Not applicable | https://kmplot.com | Online survival validation tool; listed in Methods/Data Availability |
| Metascape | Supported by NIH grants U19 AI106754 U19 AI135972 R01 DA03373 | http://metascape.org/ | Gene annotation and pathway enrichment analysis; listed in Methods/Data Availability |
| MethHC | Not applicable | http://methhc.mbc.nctu.edu.tw/ | DNA promoter methylation data/ resource; listed in Methods/Data Availability |
| NanoDrop 2000 spectrophotometer | Thermo Fisher Scientific | RNA concentration and purity measurement; listed in author revision | |
| QuantStudio 7 Flex Real-Time PCR System | Applied Biosystems | Quantitative real-time PCR; listed in author revision | |
| SPSS 13.0 | Not provided in manuscript | Version 13.0 | Statistical analyses; listed in author revision |
| STRING v12.0 | STRING Consortium | https://string-db.org/ | Protein-protein interaction network analysis; confidence score 0.4; listed in Figure 4/Data Availability |
| The Cancer Genome Atlas (TCGA-BRCA) | The Cancer Genome Atlas | TCGA-BRCA | Gene expression, clinical data, genetic alteration/copy-number dataset source; listed in Methods/ Data Availability |
| The Human Protein Atlas | The Human Protein Atlas | https://www.proteinatlas.org/ | Source used to obtain TCGA breast cancer RNA-seq expression and clinical data; listed in Methods/Data Availability |
| TIMER | X Shirley Liu Lab | https://cistrome.shinyapps.io/timer/ | Immune infiltration analysis; listed in Methods/Data Availability |
| TRIzol reagent | Invitrogen | RNA extraction; listed in author revision | |
| UALCAN | The University of Alabama at Birmingham | http://ualcan.path.uab.edu/ | Protein and mRNA expression analysis based on CPTAC and TCGA data; listed in Methods/Data Availability |
References
- Yeo SK, Guan JL. Breast cancer: multiple subtypes within a tumor? Trends Cancer. 2017;3(11):753-60.
- Sung H et al. Global cancer statistics 2020: GLOBOCAN estimates of incidence and mortality worldwide for 36 cancers in 185 countries. CA Cancer J Clin. 2021;71(3):209-49.
- Bennett RL, Licht JD. Targeting epigenetics in cancer. Annu Rev Pharmacol Toxicol. 2018;58:187-207.
- Wu L et al. Changes of N6-methyladenosine modulators promote breast cancer progression. BMC Cancer. 2019;19(1):326.
- Roignant JY, Soller M. m6A in mRNA: an ancient mechanism for fine-tuning gene expression. Trends Genet. 2017;33(6):380-90.
- Pan Y et al. Multiple functions of m6A RNA methylation in cancer. J Hematol Oncol. 2018;11(1):48.
- Uhlen M et al. Towards a knowledge-based Human Protein Atlas. Nat Biotechnol. 2010;28(12):1248-50.
- Győrffy B. Survival analysis across the entire transcriptome identifies biomarkers with the highest prognostic power in breast cancer. Comput Struct Biotechnol J. 2021;19:4101-9.
- Jézéquel P et al. bc-GenExMiner 4.5: new mining module computes breast cancer differential gene expression analyses. Database (Oxford). 2021;2021:baab007.
- GTEx Consortium. The GTEx Consortium atlas of genetic regulatory effects across human tissues. Science. 2020;369(6509):1318-30.
- Chandrashekar DS et al. UALCAN: an update to the integrated cancer data analysis platform. Neoplasia. 2022;25:18-27.
- Cerami E et al. The cBio cancer genomics portal: an open platform for exploring multidimensional cancer genomics data. Cancer Discov. 2012;2(5):401-4.
- Huang WY et al. MethHC: a database of DNA methylation and gene expression in human cancer. Nucleic Acids Res. 2015;43(Database issue):D856-61.
- Szklarczyk D et al. STRING v10: protein-protein interaction networks, integrated over the tree of life. Nucleic Acids Res. 2015;43(Database issue):D447-52.
- Zhou Y et al. Metascape provides a biologist-oriented resource for the analysis of systems-level datasets. Nat Commun. 2019;10(1):1523.
- Li T et al. TIMER: a web server for comprehensive analysis of tumor-infiltrating immune cells. Cancer Res. 2017;77(21):e108-10.
- Wang Y et al. Zinc finger and SCAN domain-containing 18 suppresses the proliferation, self-renewal, and drug resistance of glioblastoma cells. Heliyon. 2023;9(6):e17000.
- Cancer Genome Atlas Research Network. The Cancer Genome Atlas Pan-Cancer analysis project. Nat Genet. 2013;45(10):1113-20.
- Aran D et al. Comprehensive analysis of normal adjacent to tumor transcriptomes. Nat Commun. 2017;8(1):1077.
- Xiang TX et al. Aberrant promoter CpG methylation and its translational applications in breast cancer. Chin J Cancer. 2013;32(1):12-20.
- Pasculli B, Barbano R, Parrella P. Epigenetics of breast cancer: biology and clinical implication in the era of precision medicine. Semin Cancer Biol. 2018;51:22-35.
- Meyer KD, Jaffrey SR. Rethinking m6A readers, writers, and erasers. Annu Rev Cell Dev Biol. 2017;33:319-42.
- Jo HJ et al. WTAP regulates migration and invasion of cholangiocarcinoma cells. J Gastroenterol. 2013;48(11):1271-82.
- Chen Y et al. WTAP facilitates progression of hepatocellular carcinoma via m6A-HuR-dependent epigenetic silencing of ETS1. Mol Cancer. 2019;18(1):127.
- Qian JY et al. KIAA1429 acts as an oncogenic factor in breast cancer by regulating CDK1 in an N6-methyladenosine-independent manner. Oncogene. 2019;38(33):6123-41.
- Garcia-Dios DA et al. MED12, TERT promoter and RBM15 mutations in primary and recurrent phyllodes tumours. Br J Cancer. 2018;118(2):277-84.
- Hu M, Yang Y, Ji Z, Luo J. RBM15 functions in blood diseases. Curr Cancer Drug Targets. 2016;16(7):579-85.
- Shahriyari L, Abdel-Rahman M, Cebulla C. BAP1 expression is prognostic in breast and uveal melanoma but not colon cancer and is highly positively correlated with RBM15B and USP19. PLoS One. 2019;14(2):e0211507.
- Zhang B et al. Expression and prognostic characteristics of m6A RNA methylation regulators in breast cancer. Front Genet. 2020;11:604597.
- Cai X et al. HBXIP-elevated methyltransferase METTL3 promotes the progression of breast cancer via inhibiting tumor suppressor let-7g. Cancer Lett. 2018;415:11-9.
- Gu C et al. Mettl14 inhibits bladder TIC self-renewal and bladder tumorigenesis through N6-methyladenosine of Notch1. Mol Cancer. 2019;18(1):168.
- Yeon SY et al. Frameshift mutations in repeat sequences of ANK3, HACD4, TCP10L, TP53BP1, MFN1, LCMT2, RNMT, TRMT6, METTL8 and METTL16 genes in colon cancers. Pathol Oncol Res. 2018;24(3):617-22.
- Niu Y et al. RNA N6-methyladenosine demethylase FTO promotes breast tumor progression through inhibiting BNIP3. Mol Cancer. 2019;18(1):46.
- Zhang C et al. Hypoxia-inducible factors regulate pluripotency factor expression by ZNF217- and ALKBH5-mediated modulation of RNA methylation in breast cancer cells. Oncotarget. 2016;7(40):64527-42.
- Zhang C et al. Hypoxia induces the breast cancer stem cell phenotype by HIF-dependent and ALKBH5-mediated m6A-demethylation of NANOG mRNA. Proc Natl Acad Sci U S A. 2016;113(14):E2047-56.
- Liao S, Sun H, Xu C. YTH domain: a family of N6-methyladenosine (m6A) readers. Genomics Proteomics Bioinformatics. 2018;16(2):99-107.
- Alarcón CR et al. HNRNPA2B1 is a mediator of m6A-dependent nuclear RNA processing events. Cell. 2015;162(6):1299-308.
- Hu Y et al. Splicing factor hnRNPA2B1 contributes to tumorigenic potential of breast cancer cells through STAT3 and ERK1/2 signaling pathway. Tumour Biol. 2017;39(3):1010428317694318.
- Wu Y et al. Function of HNRNPC in breast cancer cells by controlling the dsRNA-induced interferon response. EMBO J. 2018;37(23):e99017.
- Nishizawa Y et al. Oncogene c-Myc promotes epitranscriptome m6A reader YTHDF1 expression in colorectal cancer. Oncotarget. 2018;9(7):7476-86.
- Zhong L et al. YTHDF2 suppresses cell proliferation and growth via destabilizing the EGFR mRNA in hepatocellular carcinoma. Cancer Lett. 2019;442:252-61.
- Hu B et al. m6A reader YTHDF3 triggers the progression of hepatocellular carcinoma through the YTHDF3/m6A-EGFR/STAT3 axis and EMT. Mol Carcinog. 2023;62(10):1599-614.
- Lee HH et al. YTHDF3 modulates EGFR/AKT/ERK/p21 signaling axis to promote cancer progression and osimertinib resistance of glioblastoma cells. Anticancer Res. 2023;43(12):5485-98.
- Zhong S et al. The inhibition of YTHDF3/m6A/LRP6 reprograms fatty acid metabolism and suppresses lymph node metastasis in cervical cancer. Int J Biol Sci. 2024;20(3):916-36.
- Zhang B et al. YT521 promotes metastases of endometrial cancer by differential splicing of vascular endothelial growth factor A. Tumour Biol. 2016;37(12):15543-9.
- Tanabe A et al. RNA helicase YTHDC2 promotes cancer metastasis via the enhancement of the efficiency by which HIF-1α mRNA is translated. Cancer Lett. 2016;376(1):34-42.
- Huang H et al. Recognition of RNA N6-methyladenosine by IGF2BP proteins enhances mRNA stability and translation. Nat Cell Biol. 2018;20(3):285-95.
- Fakhraldeen SA et al. Two isoforms of the RNA binding protein, coding region determinant-binding protein (CRD-BP/IGF2BP1), are expressed in breast epithelium and support clonogenic growth of breast tumor cells. J Biol Chem. 2015;290(21):13386-400.
- Li Y, Francia G, Zhang JY. p62/IMP2 stimulates cell migration and reduces cell adhesion in breast cancer. Oncotarget. 2015;6(32):32656-68.
- Wang Z et al. Blockade of miR-3614 maturation by IGF2BP3 increases TRIM25 expression and promotes breast cancer cell proliferation. EBioMedicine. 2019;41:357-69.
- Kim HY, Ha Thi HT, Hong S. IMP2 and IMP3 cooperate to promote the metastasis of triple-negative breast cancer through destabilization of progesterone receptor. Cancer Lett. 2018;415:30-9.
- Meyer KD et al. 5′ UTR m6A promotes cap-independent translation. Cell. 2015;163(4):999-1010.
- Yin JY et al. eIF3a: a new anticancer drug target in the eIF family. Cancer Lett. 2018;412:81-7.
- Bell JL et al. IGF2BP1 harbors prognostic significance by gene gain and diverse expression in neuroblastoma. J Clin Oncol. 2015;33(11):1285-93.
- Liu L et al. N6-methyladenosine-related genomic targets are altered in breast cancer tissue and associated with poor survival. J Cancer. 2019;10(22):5447-59.
- Anita R, Paramasivam A, Priyadharsini JV, Chitra S. The m6A readers YTHDF1 and YTHDF3 aberrations associated with metastasis and predict poor prognosis in breast cancer patients. Am J Cancer Res. 2020;10(8):2546-54.
- Zhao G et al. Gene signatures and cancer-immune phenotypes based on m6A regulators in breast cancer. Front Oncol. 2021;11:756412.
- Demircan T, Yavuz M, Akgul S. m6A pathway regulators are frequently mutated in breast invasive carcinoma and may play an important role in disease pathogenesis. OMICS. 2021;25(10):660-78.
- Lv W et al. Analysis and validation of m6A regulatory network: a novel circBACH2/hsa-miR-944/HNRNPC axis in breast cancer progression. J Transl Med. 2021;19(1):527.
- Ohashi R et al. IMP3 contributes to poor prognosis of patients with metaplastic breast carcinoma: a clinicopathological study. Ann Diagn Pathol. 2017;31:30-5.
- Ohashi R et al. Prognostic value of IMP3 expression as a determinant of chemosensitivity in triple-negative breast cancer. Pathol Res Pract. 2017;213(9):1160-5.
- Chen XY, Zhang J, Zhu JS. The role of m6A RNA methylation in human cancer. Mol Cancer. 2019;18(1):103.
- Drabløs F et al. Alkylation damage in DNA and RNA: repair mechanisms and medical significance. DNA Repair (Amst). 2004;3(11):1389-407.
- Fedeles BI et al. The AlkB family of Fe(II)/α-ketoglutarate-dependent dioxygenases: repairing nucleic acid alkylation damage and beyond. J Biol Chem. 2015;290(34):20734-42.
- Villarroya-Beltri C et al. Sumoylated hnRNPA2B1 controls the sorting of miRNAs into exosomes through binding to specific motifs. Nat Commun. 2013;4:2980.
- Hu X et al. Depletion of Ars2 inhibits cell proliferation and leukemogenesis in acute myeloid leukemia by modulating the miR-6734-3p/p27 axis. Leukemia. 2019;33(5):1090-101.
- Chen Y et al. Ars2 promotes cell proliferation and tumorigenicity in glioblastoma through regulating miR-6798-3p. Sci Rep. 2018;8(1):15602.
- Alarcón CR et al. N6-methyladenosine marks primary microRNAs for processing. Nature. 2015;519(7544):482-5.
- Shukla S et al. Inhibition of telomerase RNA decay rescues telomerase deficiency caused by dyskerin or PARN defects. Nat Struct Mol Biol. 2016;23(4):286-92.
- Chang G et al. YTHDF3 induces the translation of m6A-enriched gene transcripts to promote breast cancer brain metastasis. Cancer Cell. 2020;38(6):857-71.e7.
- Liu Z et al. YTHDF3 mediates the occurrence and development of breast cancer by regulating glycolysis through the mTOR-HIF1α-LDHA axis. J Cell Mol Med. 2026;30(9):e71105.
- Xu L et al. YTHDF3 promotes breast cancer osteolytic bone metastasis by enhancing the translation of ZEB1 and SMAD5. Oncogenesis. 2025;14(1):41.
- Zhang Y, Chen S, Wu Q. The m6A reader YTHDF3 promotes TNBC progression by regulating CENPI stabilization. Front Oncol. 2025;15:1546723.
- Chen H et al. YTHDF3 drives tumor growth and metastasis by recruiting eIF4B to promote Notch2 translation in breast cancer. Cancer Lett. 2025;614:217534.
- Luo Y et al. piR-1170 drives brain metastasis and immune evasion via WTAP-mediated m6A methylation reprogramming in triple-negative breast cancer. Mol Cancer. 2026;25(1):52.
- Zhang C et al. POP1 facilitates proliferation in triple-negative breast cancer via m6A-dependent degradation of CDKN1A mRNA. Research (Wash D C). 2024;7:0472.