This study integrates perioperative anesthesia-related drug target genes with multi-omics ovarian cancer data to build and validate a prognostic model and characterize associated immune, spatial, and regulatory features.
Research Article
Prognostic Modeling of Ovarian Cancer Based on Perioperative Anesthesia-Related Drug Target Genes: A Bioinformatics Approach
* These authors contributed equally
In This Article
Summary
Abstract
The heterogeneity of ovarian cancer (OV) poses significant challenges to disease subtype classification, risk stratification, and precision clinical management. Therefore, this study developed a prognostic model based on perioperative anesthesia-related drug target genes (PARDTGs) to find the clinical significance of PARDTGs in OV patients. This study comprehensively analyzed PARDTGs in OV by integrating multi-omics data, including bulk transcriptomic data, single-cell RNA-sequencing (scRNA-seq) data, and spatial transcriptomic data. Based on the expression characteristics of PARDTGs, we developed a prognostic feature using a stepAIC Cox proportional hazards model. This model was built on the TCGA-OV dataset and validated using the GSE26193, GSE30161 and GSE63885 datasets. Furthermore, we constructed nomograms combining PARDTG features and clinical factors. We analyzed the correlation between risk scores and functional enrichment, signaling pathways, and the tumor immune microenvironment. We identified 17 PARDTGs that are strongly associated with OV prognosis. The prognostic signature, validated across the TCGA-OV, GSE26193, GSE30161 and GSE63885 cohorts, demonstrated robust predictive accuracy for OS. Compared with the gene signature alone, the nomogram integrating the prognostic model and clinical parameters exhibited improved prognostic performance. Additionally, tumor microenvironment analysis revealed significant enrichment of immune-related pathways and lower TIDE scores in low-risk patients, which reveals that these patients may be more likely to benefit from immunotherapy. The study demonstrates both the prognostic relevance and the clinical utility of PARDTGs in ovarian cancer. Integrating genetic characteristics into clinical testing holds promise for improving clinical treatment and prognosis.
Introduction
OV is a prevalent and aggressive malignancy characterized by covert initial symptoms, strong invasiveness, and non-specific early clinical signs. Studies have shown that most patients are already in the late clinical stages at the time of diagnosis, with an overall five-year survival rate below 45%1. Despite advances in surgery, chemotherapy, and targeted therapies, challenges like tumor recurrence, chemoresistance, and immune evasion persist, limiting therapeutic efficacy2. Thus, identifying novel molecular biomarkers and developing robust risk assessment tools are urgently required to address tumor heterogeneity and support personalized clinical strategies.
Surgical resection and perioperative management remain the cornerstone of OV treatment. However, growing evidence suggests that perioperative physiological stress, inflammatory responses, and immune modulation may influence biological behavior and, in turn, affect long-term prognosis3. As a key component of perioperative intervention, the effects of anesthetic agents extend beyond central nervous system suppression. Current studies indicate that anesthesia techniques and anesthetic drugs can modulate neuroendocrine responses, inflammatory cascades, and immune effector cell activity, thereby reshaping the postoperative tumor microenvironment and influencing tumor cell migratory potential, immune surveillance, and metastasis-related processes4. Notably, specific anesthetics directly alter tumor cell fate: propofol enhances the survival of circulating tumor cells via Nrf2-mediated suppression of ferroptosis, thereby promoting metastasis5. Ketamine induces ferroptosis in hepatocellular carcinoma cells by controlling the lncPVT1/miR-214-3p/GPX4 axis, suggesting that anesthetic agents can directly influence tumor cell fate determination6. In addition, benzodiazepines, as positive allosteric modulators of GABA receptors, may attenuate the antitumor efficacy of chemo-immunotherapeutic combinations7. However, current research primarily focuses on single anesthetic agents, lacking a systematic examination of their potential effects at the gene target network level.
Perioperative anesthesia-related drug target genes (PARDTGs), as direct molecular substrates of anesthetic action, participate in several key signaling pathways, including neurotransmitter receptor regulation, maintenance of calcium homeostasis, actin cytoskeletal dynamics, and feedback in the endocrine stress axis8,9. Under perioperative surgical stress, these pathways may be activated or suppressed, influencing immune cell polarization and tumor-associated microenvironmental remodeling8,10. However, in OV, the expression landscape, functional characteristics, and clinical relevance of PARDTGs remain poorly characterized. Concurrently, the emergence of scRNA-seq and spatial transcriptomics has enabled gene expression profiling at cellular resolution with spatial localization, providing new perspectives on the spatial distribution, microenvironmental preferences, and cell-specific effects of anesthetic target genes in tumor tissues11.
In this study, we integrated PARDTGs with OV multi-omics datasets, systematically identified differentially expressed genes, and constructed a generalizable prognostic risk model. We further dissected the biological basis of risk stratification from the perspectives of immune infiltration, stemness features, mutational landscapes, and functional pathways. Combining multimodal sequencing data, we delineated cell-type origins and spatial ecological niches, constructed miRNA/transcription factor regulatory networks, and performed pan-cancer validation to demonstrate cross-tumoral significance. This work provides mechanistic evidence for understanding the potential role of anesthetic target networks in OV and offers translational implications for clinical risk stratification, prognostic prediction, and perioperative management strategies.
Protocol
Data collection
We screened 120 perioperative anesthesia-related drug target genes from previous literature12 and listed them in Supplementary Table S1. Subsequently, gene expression profiles, clinical information, and survival data were obtained from the UCSC Xena TCGA TARGET GTEx Toil recompute resource (http://xena.ucsc.edu/). The expression dataset consisted of 420 primary ovarian serous cystadenocarcinoma samples from The Cancer Genome Atlas (TCGA-OV) and 88 normal ovary samples from the Genotype-Tissue Expression (GTEx) project. Gene expression values were obtained as RSEM gene-level FPKM values generated by the Toil pipeline13. A detailed sample-flow description illustrating the inclusion of TCGA samples for each downstream analysis is provided in Supplementary Table S2. In addition, for external validation, we downloaded the GSE2619314 (n = 107 samples), GSE3016115 (n = 58 samples), and GSE6388516(n = 70 samples) datasets from the GEO database (http://www.ncbi.nlm.nih.gov/geo/) to analyze the gene expression profiles and survival of the matched patients. To ensure data consistency, ENSEMBL gene identifiers were converted to official gene symbols. Genes with expression in less than half of the samples were filtered out. In addition, we obtained the human ovarian cancer single-cell transcriptome dataset GSE15460017 and the ovarian cancer spatial transcriptome dataset GSE211956-GSM6506110-SP118 from the GEO database.
Processing ovarian cancer spatial transcriptome sequencing data
Spatial transcriptomic data were processed using Seurat19 (version 5.4.0). Spots were filtered using the same quality control criteria as the single-cell RNA sequencing analysis (nFeature_RNA: 200–5,000; mitochondrial gene percentage < 10%). After normalization and identification of highly variable genes, PCA-based dimensionality reduction was performed, and clustering was conducted using the Seurat graph-based clustering algorithm. Subgroups and gene expression patterns were visualized using the SpatialFeaturePlot function. Additionally, gene expression levels at the spatial transcriptome level were visualized and analyzed using “AUCell”19 (version 1.32.0).
scRNA-seq data analysis
Single-cell RNA sequencing data from GSE154600 were analyzed using the Seurat package (version 5.4.0)19. Low-quality cells were removed based on quality control criteria. Cells with fewer than 200 or more than 5,000 detected genes, or mitochondrial gene proportions exceeding 10%, were excluded. After normalization using the NormalizeData function, the top 2,000 highly variable genes were identified using the VST method. PCA was performed based on variable genes, and the first 15 principal components were used for clustering and dimensionality reduction. Cell clusters were identified using FindNeighbors and FindClusters with a resolution of 0.5, followed by UMAP and t-SNE visualization. The FindAllMarkers function was used to identify marker genes for different cell clusters. In addition, we annotated cell clusters using the CellMarker 2.020 database and performed quantitative analysis of gene activity using the ssGSEA function by the GSVA package (version 2.4.9).
Differentially expressed gene (DEG) and functional analyses
Differential expression analysis was performed using the “limma” package21 (version 3.56.2) based on the expression profiles of PARDTGs between ovarian cancer and normal ovarian tissues. Before analysis, FPKM expression values were log2-transformed using the formula log2(FPKM+1). The standard linear model implemented in the limma package was applied to identify differentially expressed PARDTGs. Genes with a false discovery rate (FDR) < 0.05 and |log2 fold change (FC)| > 1 were considered significantly differentially expressed. GO and KEGG enrichment were implemented on differentially expressed PARDTGs using the ClusterProfiler22 (version 4.8.3). Waterfall plots were generated using the “maftools”23 (version 2.16.0) to detect somatic mutations in PARDTGs in ovarian cancer. Next, the PPI network of PARDTGs was established using the STRING repository (version 12.0) with default parameters.
Development of a PARDTG-based risk scoring system
To identify the optimal PARDTGs, a stepwise Cox proportional hazards regression analysis was performed to screen for prognostically significant genes among differentially expressed PARDTGs and to determine their contributions to overall survival in ovarian cancer (OV). The proportional hazards assumption of the final multivariate Cox regression model was assessed using Schoenfeld residual tests implemented in the cox.zph function of the R survival package (version 3.5.5). A prognostic risk score was calculated based on the expression levels of signature genes and their corresponding Cox regression coefficients. Given the heterogeneity across transcriptomic platforms, prognostic models were evaluated independently in the TCGA-OV, GSE26193, GSE30161, and GSE63885 cohorts. For each cohort, expression profiles of signature genes were used to compute cohort-specific risk scores, and patients were stratified into high- and low-risk categories using the median risk score as the cutoff. Overall survival (OS) was compared between the two groups using Kaplan–Meier analysis, with statistical significance assessed by the log-rank test. The independent prognostic value of the risk score was then assessed through both univariate and multivariate Cox proportional hazards regression analyses.
Development of a prognostic clinical model for ovarian cancer
To determine whether the risk score provided prognostic information beyond conventional clinical variables, univariate and multivariate Cox proportional hazards regression analyses were performed, incorporating the risk score together with clinicopathological characteristics. Subsequently, prognostic nomograms were constructed using the molecular risk score and clinically relevant variables, such as tumor stage and grade, as input parameters. Variables were selected based on their clinical relevance and the objective of developing an integrated prognostic model, rather than solely on statistical significance. Nomograms were generated using the “rms” package24 (version 6.7.1) to estimate 1-, 3-, and 5-year overall survival probabilities based on total scores derived from individual variables.
Characterization of immune properties
Immune cell infiltration was estimated using the CIBERSORT algorithm with the LM22 signature matrix. The analysis was performed using 1,000 permutations, and samples with a deconvolution P-value < 0.05 were considered statistically reliable. Waterfall diagrams were generated with maftools (version 2.16.0) to illustrate the prevalence of highly mutated genes in ovarian cancer. Gene set enrichment analysis (GSEA) was conducted via ClusterProfiler (version 4.8.3) with a significance threshold of p < 0.05.
CeRNA-network construction
In this study, NetworkAnalyst 3.0 (https://www.networkanalyst.ca/)25 was used to analyze the interaction between prognostic genes and transcription factors. The miRNA-TF co-regulatory network was constructed using NetworkAnalyst 3.0.
Ovarian cancer tissue samples
Ovarian carcinoma tissues and matched adjacent normal samples (N = 6) were collected from patients undergoing elective surgical resection. The study protocol was approved by the Ethics Committee of the Obstetrics & Gynecology Hospital of Fudan University (2024-54-X1), and written informed consent was obtained from all participants. This study was conducted in accordance with the Declaration of Helsinki.
Western blot analysis
Total protein was extracted from human tissue specimens using RIPA lysis buffer containing phenylmethylsulfonyl fluoride (PMSF), protease inhibitor cocktail, and phosphatase inhibitors. Protein concentrations were measured with a bicinchoninic acid (BCA) protein assay. Equal amounts of protein were separated by SDS-polyacrylamide gel electrophoresis (SDS-PAGE) before being transferred to polyvinylidene fluoride (PVDF) membranes. Following transfer, the membranes were blocked for 90 min at room temperature with 5% nonfat milk prepared in TBS-T. The membranes were then incubated overnight at 4 °C with primary antibodies against Cytokeratin 81 (rabbit polyclonal, 1:2,000) or GAPDH (mouse monoclonal, 1:10,000). After washing, the appropriate secondary antibodies were applied for 90 min at room temperature. Protein bands were visualized using an enhanced chemiluminescence (ECL) detection reagent and captured with a commercial imaging system. Densitometric analysis was carried out in ImageJ, and KRT81 expression was normalized against the GAPDH loading control. Differences in protein expression between paired samples were evaluated using a paired t-test, with P < 0.05 considered statistically significant.
Pan-cancer analysis
In this study, TCGAplot26 (version 5.0.0) was used to identify the relationships between KRT81 expression levels. The Pearson correlation analysis was utilized to calculate statistical correlations. The mutational profile of KRT81 across various cancers was examined using the cBioPortal platform (http://www.cbioportal.org/) (version 7.0.6).
Statistical analyses
All data analyses were performed using R software (version 4.3.1). Comparisons between two groups were conducted with the Wilcoxon rank-sum test, whereas differences across three or more groups were evaluated using the Kruskal–Wallis test. Overall survival was analyzed using the Kaplan–Meier method, and statistical significance between survival curves was determined with the log-rank test. Unless otherwise indicated, a two-sided P value < 0.05 was considered statistically significant. Significance levels are denoted as follows: P < 0.05 *, P < 0.01 **, P < 0.001 ***, and P < 0.0001 ****.
Results
Immune characteristics of perioperative anesthesia-related drug target genes in spatial and single-cell transcriptomic analyses
SCTransform was used to correct sequencing depth and implemented procedures, ultimately identifying 11 different cell types. To assess the importance of perioperative anesthesia-related drug target genes (PARDTGs) in each cell subpopulation, we used the AUCell R package to determine PARDTG-related activities in each cell subpopulation (Figure 1A,B). Subsequently, we calculated the correlation between cell abundance and PARDTG-associated activities across all loci using Spearman's rank correlation. Notably, PARDTG-related activities were negatively correlated with tumor cells (Figure 1C). We obtained single-cell RNA sequencing data from 5 OV patients, containing a total of 41,367 cells. Based on marker gene expression, the cells were categorized into 11 major clusters (Figure 1D). The interaction networks and strengths for the cell type are shown in Figure 1E. We evaluated PARDTG activity in all single cells by scoring the expression of 120 PARDTGs using ssGSEA in Seurat (Figure 1F). Strikingly, tumor cells exhibited markedly lower activity than all other cell types (Figure 1G).
Identification and molecular characterization of perioperative anesthesia-related drug target genes in ovarian cancer
From the TCGA database, we identified 68 differentially expressed PARDTGs, which are shown in Figure 2A (see also Supplementary Table S3). Figure 2B describes the expression of these 68 perioperative anesthesia-associated DEGs in the TCGA-OV cohort. Subsequently, we constructed a PPI network to elucidate the complex relationships between proteins associated with DEGs. We identified five potential hub genes—SLC6A4, CHRNA4, DRD2, SLC6A3, and GRIN2A—that may have important effects in the pathogenesis of ovarian cancer (Figure 2C). Furthermore, we investigated the molecular alteration profile of 120 PARDTGs in ovarian cancer, with nonsense mutations being the most common variant type (Figure 2D). The most frequently mutated genes were SCN10A, DNMT1, GRIN2A, LTF, and SCN11A. We explored the prevalence of copy number variation (CNV) mutations, and the results revealed that the top 20 PARDTGs with mutations exhibited significant CNV alterations (Figure 2E). GO and KEGG enrichment indicated that PARDTGs are associated with neuroactive ligand signaling, calcium signaling pathways, hormone signaling, amphetamine addiction, cocaine addiction, and neuroactive ligand-receptor interactions (Figure 2F,G).
Construction and validation of a prognostic model based on perioperative anesthesia-related drug target genes
To minimize model complexity, StepAIC was used to reduce the gene set, and 17 PARDTGs were ultimately retained to build the prognostic model (Supplementary Table S4). The global Schoenfeld residual test showed no significant deviation from the proportional hazards assumption (p = 0.265), supporting the reliability of the 17-gene prognostic model. The risk score was computed using the following equation: risk score = ADRA1D*(0.4452) + ADRB1*(-0.5347) + CHRNA4*(0.3495) + DBH*(-0.5765) + EPHA4*(0.2827) + EPHA7*(-0.5707) + EPHA8*(0.8765) + GABRB2*(0.5979) + GRIN2A*(-0.1750) + GRIN2D*(0.2746) + KCNA1*(2.2753) + KRT81*(0.1101) + OPRD1*(-3.2372) + SLC6A2*(1.4901) + SLC18A1*(4.2170) + SLC18A2*(-1.4600) + CHRNA1*(-0.1723). Patients were subsequently divided into low- and high-risk categories according to their risk scores, with the low-risk group showing a significantly improved OS compared with the high-risk group in the TCGA-OV (Figure 3A, p < 0.0001), GSE26193 cohort (Figure 3B, p = 0.00021), GSE30161 cohort (Figure 3C, p = 0.0017), and GSE63885 cohort (Figure 3D, p = 0.0041). Moreover, Figure 3E–H illustrate the distributions of survival status and risk scores across the TCGA-OV, GSE26193, GSE30161, and GSE63885 cohorts, providing independent evidence of the stability and predictive reliability of the prognostic model in OV.
Establishment and evaluation of a nomogram-based survival model
Both univariate and multivariate Cox regression analyses demonstrated that the risk score served as an independent predictor of prognosis in patients with ovarian cancer (Figure 4A,B). The distribution of model gene expression, corresponding risk scores, and clinicopathological characteristics in the TCGA-OV cohort is illustrated in Figure 4C. To improve clinical applicability, a prognostic nomogram incorporating the risk score together with age, tumor stage, and grade was established to estimate overall survival (OS) (Figure 4D). Compared with the gene signature alone, the integrated nomogram achieved superior predictive performance. Survival analysis further showed a significantly longer OS in the low-risk group than in the high-risk group (Figure 4E; P < 0.0001). The combined model yielded time-dependent AUC values of 0.769, 0.690, and 0.728 for OS prediction (Figure 4F). Decision curve analysis supported the potential clinical utility of the nomogram by demonstrating greater net benefit across a range of threshold probabilities (Figure 4G). Furthermore, calibration plots indicated close agreement between the predicted and observed survival probabilities, suggesting good model calibration (Figure 4H). Collectively, these results indicate that the proposed nomogram possesses strong predictive capability for assessing the prognosis of patients with OV.
Association of the PARDTG-based prognostic model with immune infiltration and the tumor immune microenvironment
To characterize immune infiltration, immune cell abundance was quantified across the samples. Seventeen genes were identified as being significantly associated with tumor-infiltrating immune cells, among which ADRA1D, KCNA1, and SLC18A2 showed positive correlations with M2 macrophages (Figure 5A). We next investigated the cellular localization patterns of these genes. Dot plot analysis revealed that KRT81 was predominantly expressed in CD8Tex and Tprolif cells, whereas EPHA4 expression was mainly enriched in endothelial cells and fibroblasts, suggesting their potential involvement in distinct cellular compartments within the tumor microenvironment. (Figure 5B). Additionally, we evaluated patients' TIDE scores and observed that the high-risk subcluster had higher TIDE scores and a positive correlation (Figure 5C). Furthermore, stemness enrichment scores were significantly higher in the high-risk group than in the low-risk group (Figure 5D). Somatic mutation analysis revealed a high overall mutation frequency in both risk groups (Figure 5E,F). Among them, the mutation frequencies of CSMD3 and MUC16 were higher in high-risk samples.
GSEA revealed that immune-related pathways, including antigen processing and presentation and allograft rejection, were significantly enriched in the low-risk group, whereas pathways associated with tumor invasion and motility, such as regulation of the actin cytoskeleton, proteoglycans in cancer, and motor proteins, were predominantly enriched in the high-risk group (Figure 5G,H). These findings suggest that patients in the high-risk group may exhibit limited responsiveness to immunotherapy.
Identification and network analysis of prognostic PARDTGs in ovarian cancer
To elucidate the mechanism, we identified 490 miRNAs and 17 potential regulatory networks of biomarkers (Figure 6A). Among them, hsa-miR-27a-3p, hsa-miR-34a-5p, hsa-miR-106b-5p, and hsa-miR-20b-5p have the potential to regulate most genes. Ultimately, our research results identified 37 transcription factors that regulated the candidate diagnostic genes (Figure 6B). Additionally, FOXC1 was also found to have multiple regulatory functions.
Pan-cancer analysis of KRT81 expression
RNA-seq data from TCGA were obtained to assess KRT81 expression. The results suggested it was highly expressed in most cancers but expressed at low levels in GBM, LGG, SKCM, TGCT, and THCA (Figure 7A). To verify the result that KRT81 is highly expressed in ovarian cancer, as determined by bioinformatics analysis, we conducted a western blot experiment. The results indicated that KRT81 expression was significantly elevated in tumor tissues compared with normal tissues and was largely consistent with the TCGA transcriptomic data (Figure 7B, Supplementary Figure S1, and Supplementary Table S5). To illustrate the relationships between KRT81 and cancer, we examined gene expression and immune cell infiltrations (Figure 7C). The analysis revealed that KRT81 expression was positively correlated with the infiltration of T cells, Tregs, and M2 macrophages across most cancers. In addition, KRT81 expression was positively associated with the stromal and immune scores in most cancers (Figure 7D). Furthermore, we analyzed the correlation between KRT81 expression and Aneuploidy Score, and the radar chart showed that KRT81 was correlated with Aneuploidy Score in UCEC, SARC, LUAD, LIHC, and KIRP (Figure 7E). We then analyzed the correlation between KRT81 and Tumor Ploidy, and the radar chart showed that KRT81 was correlated with Tumor Ploidy in THCA, TGCT, SARC, MESO, LIHC, and CESC (Figure 7F). Then, the radar chart showed that KRT81 was correlated with SNV Neoantigens in UCEC, THYM, LUAD, LIHC, GBM, and BRCA (Figure 7G). Moreover, the cBioPortal online analysis revealed that the highest frequency of KRT81 gene mutation was in UCEC, of which most type were “mutation” and “Amplification” (Figure 7H,I). By univariate Cox proportional hazard regression analysis, we identified that KRT81 was a predictor for OS in KIRC, LUAD, and STAD (Figure 7J).
Data availability:
Publicly available datasets analyzed in this study are available from TCGA, UCSC Xena, and GEO. The original western blot images and the corresponding quantitative data generated during this study are provided in the Supplementary Materials (Supplementary Figure S1 and Supplementary Table S5).
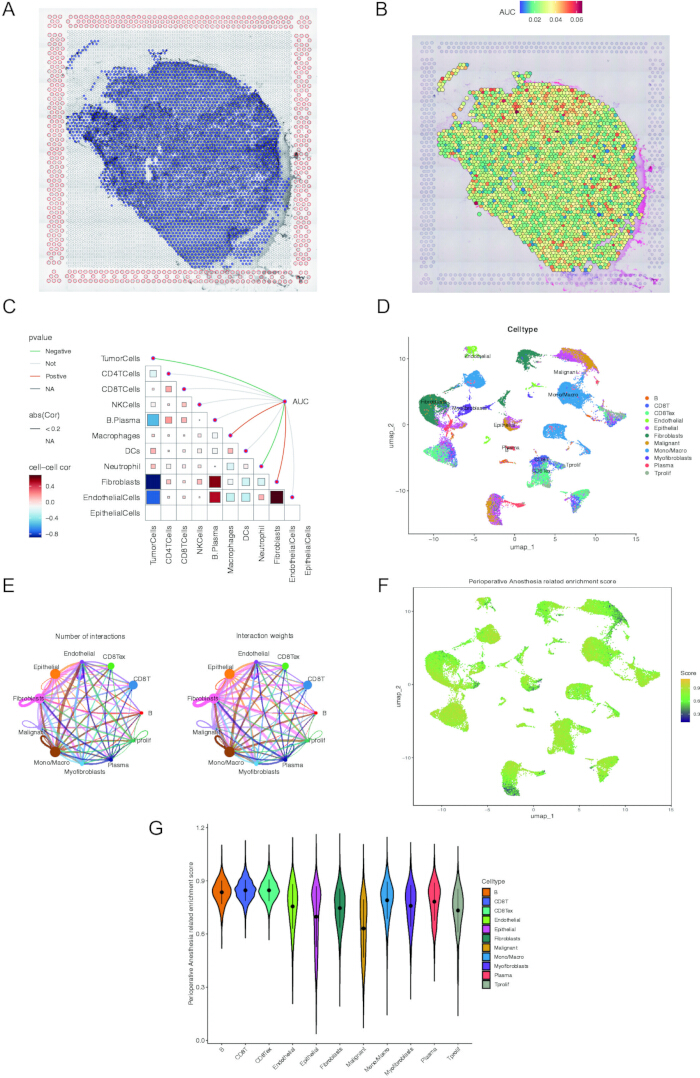
Figure 1. PARDTG-associated features in the spatial and scRNA-seq. (A,B) Spatial mapping of PARDTG expression intensity (C), Spearman correlation of PARDTG-associated activity. (D) Analysis of cell types. (E) Analysis of the interaction number and strength among cell types. (F) The PARDTG enrichment value in cells. (G) The distribution of PARDTG. Abbreviations: PARDTG = perioperative anesthesia-related drug target genes; scRNA-seq = single-cell RNA sequencing. Please click here to view a larger version of this figure.
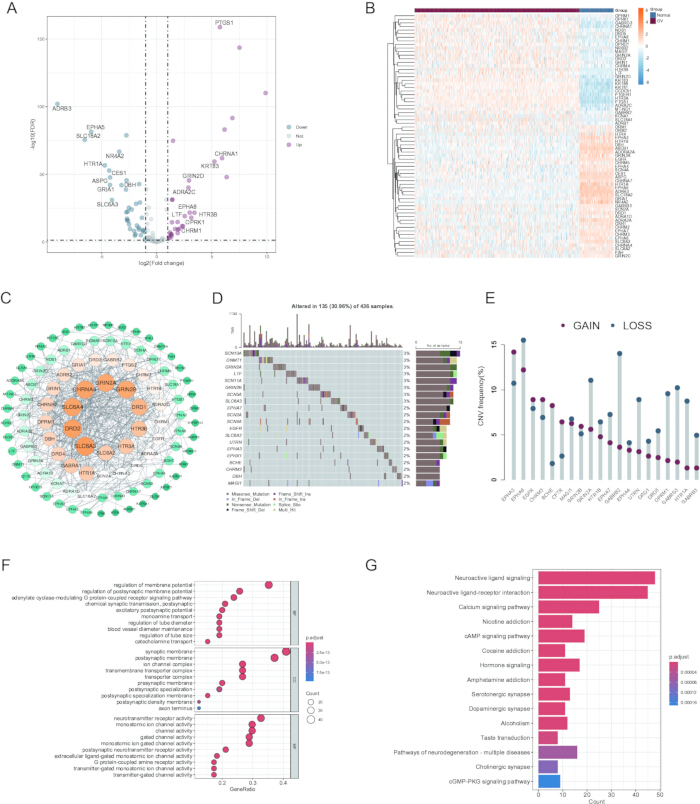
Figure 2. Genetic alteration landscape of PARDTGs in OV Patients. (A) Volcano visualization of the DEGs in OV (blue: down-regulated DEGs; red: up-regulated DEGs; grey: stable genes), FDR< 0.05 and |log2FC| > 1. (B) Heatmap illustrating differentially expressed features between the OV and normal groups. Blue is the normal group, red is the OV group, the blue square represents low expression, and the yellow square represents high expression. (C) PPI network of perioperative anesthesia-related DEGs, as obtained from the String website. (D) The top 20 PARDTGs in the TCGA cohort. (E) Frequencies of CNV gain, loss, and non-CNV among the top 20 PARDTGs. (F) GO dotplot of enriched GO terms. (G) barplot of enriched KEGG pathways. OV = ovarian cancer; GO = Gene Ontology; KEGG = Kyoto Encyclopedia of Genes and Genomes; PPI = protein–protein interaction. Please click here to view a larger version of this figure.
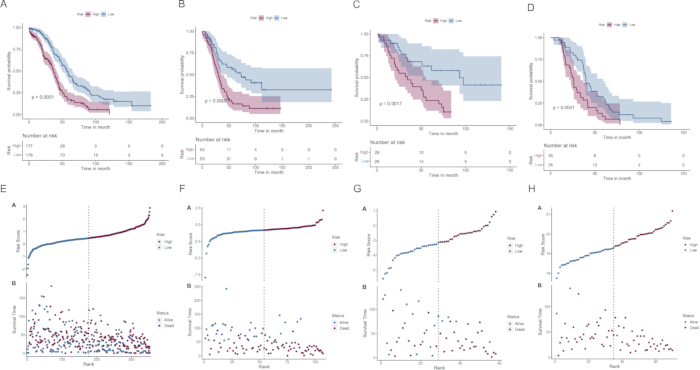
Figure 3. Construction and validation of a PARDTG-based prognostic signature for ovarian cancer. (A-D). OS in the low- and high-risk patients in (A) TCGA-OV, (B) GSE26193, (C) GSE30161, (D) GSE63885. (E-H) Distribution of the PARDTG-associated risk score using the survival status and time in (E). TCGA-OV, (F) GSE26193, (G) GSE30161, (H) GSE63885. Please click here to view a larger version of this figure.
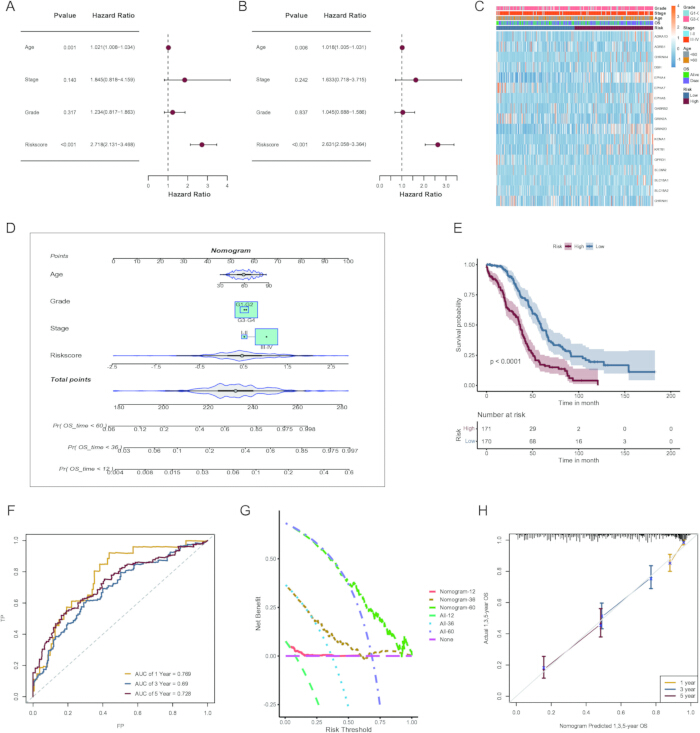
Figure 4. Construction and validation of a prognostic nomogram based on the PARDTG-derived risk signature. (A,B) The clinicopathologic features and risk scores in the TCGA-OV cohort. (C) The distribution of clinical characteristics and the expression of model genes by risk score. (D) A nomogram for predicting prognosis in OV patients. (E) Kaplan-Meier analyses for two OV groups. (F) ROC curve analysis in TCGA-OV. (G) DCA shows the net benefits of the nomogram and other clinical characteristics. (H) Calibration plots show OS in TCGA-OV. Abbreviations: ROC = receiver operating characteristic; DCA = decision curve analysis. Please click here to view a larger version of this figure.
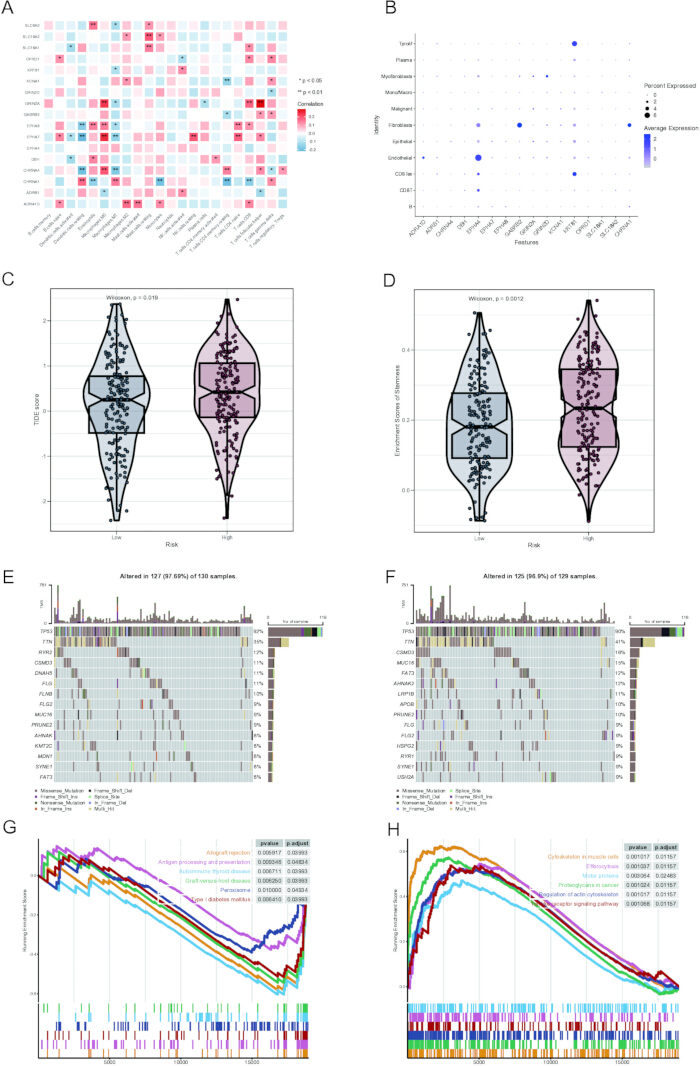
Figure 5. Tumor microenvironment analysis in low- and high-risk patients. (A) Correlation between tumor-infiltrating immune cells and genes in the PA-related prognostic model. (B) Bubble plot showing the average expression and proportion of prognostic biomarkers across different cell subtypes. (C) Violin plot of TIDE scores. (D) Violin plot of tumor stemness enrichment scores. (E,F) Waterfall plot depicting somatic mutation characteristics in (E) low-risk and (F) high-risk score categories. (G,H) GSEA results of KEGG pathways in (G) low-risk subgroup and (H) high-risk subgroup. Abbreviations: TIDE = Tumor Immune Dysfunction and Exclusion; GSEA = Gene Set Enrichment Analysis. Please click here to view a larger version of this figure.
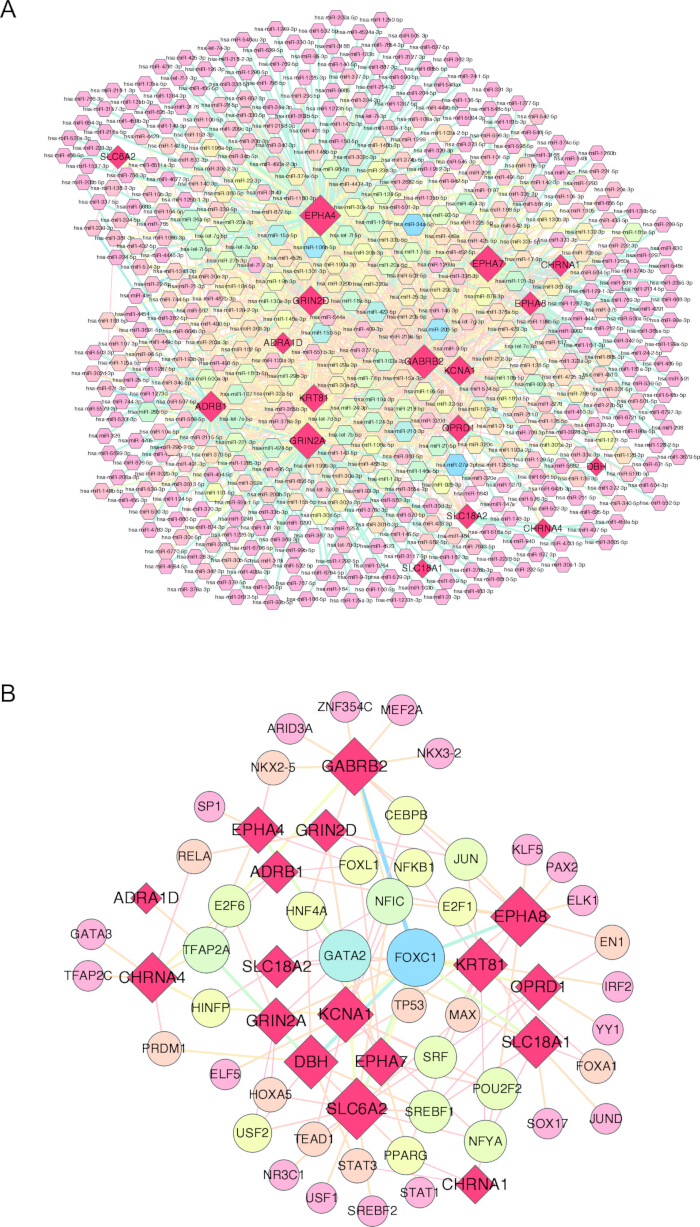
Figure 6. Interaction network analysis of prognostic markers. (A) MiRNA-prognostic markers coregulatory network. (B) Transcription factor-prognostic markers coregulatory network. Please click here to view a larger version of this figure.
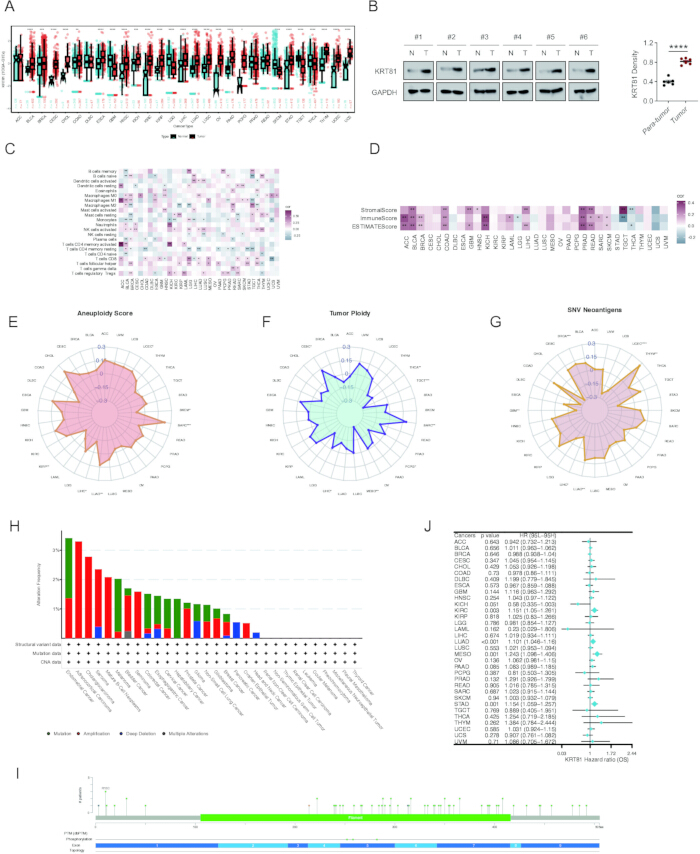
Figure 7. Expression level, immune features, and genetic alterations of KRT81 in human tumors. (A) KRT81 expression in TCGA tumors and adjacent tissues. (B) Western blot analysis of KRT81 protein expression in paired adjacent normal and tumor tissues from six patients with ovarian cancer (n = 6). Relative band intensities were normalized to GAPDH, and data were analyzed using a paired t-test. Data are presented as mean ± SD. (C) Correlation between KRT81 and the immune cell ratio is displayed by a heatmap. (D) Correlation between KRT81 and immune, stromal, and ESTIMATE scores, displayed in a heatmap. (E-G) Correlation between expression of KRT81 and (E) Aneuploidy Score, (F) Tumor Ploidy, (G) SNV Neoantigens in TCGA databases. (H) KRT81 mutations across different cancer types from the cBioPortal database. (I) Distribution of KRT81 mutation sites in pan-cancer. (J) A Pan-cancer Cox regression analysis of KRT81 across TCGA cancers. *p < 0.05; ***p < 0.001; ****p < 0.0001. Abbreviations: SNV = Single Nucleotide Variant; N = normal; T = tumor. Please click here to view a larger version of this figure.
Supplemental Table S1: Perioperative anesthesia-related drug target genes. Please click here to download this file.
Supplemental Table S2: Sample-flow description.Please click here to download this file.
Supplemental Table S3: Differentially expressed perioperative anesthesia-related drug target genes. Please click here to download this file.
Supplemental Table S4: Prognostic perioperative anesthesia-related drug target genes.Please click here to download this file.
Supplemental Table S5: Western blot source data.Please click here to download this file.
Supplemental Figure S1: Original data of western blotting.Please click here to download this file.
Discussion
As an unavoidable component of cancer treatment workflows, perioperative anesthesia has attracted increasing attention for its potential immunomodulatory effects, microenvironmental remodeling capacity, and potential promotion of tumor dissemination. With cancer increasingly recognized as a systemic and ecological disease rather than a strictly gene-driven focal lesion27, perioperative physiological dysregulation, inflammatory responses, and metabolic stress may reshape microenvironmental niches and influence tumor evolutionary trajectories. Through multi-layer transcriptome integration, this study systematically depicted the expression patterns, biological associations, and prognostic value of PARDTGs in OV, providing potential clues for perioperative precision anesthesia.
Spatial and single-cell transcriptomic profiling highlighted marked spatial variation of PARDTG activity, showing decreased activity in tumor epithelial cells and increased activity in immune, endothelial, and fibroblast cells. This “non-tumor-cell enrichment” pattern suggests that the anesthetic target network may exert its effects primarily by modulating stromal and immune cell states rather than through direct tumor-cell intrinsic mechanisms. This observation aligns with the concept that tumor progression is jointly shaped by tumor cells and their host microenvironment28. Notably, surgery-induced acute inflammation, transient immunosuppression, and tissue remodeling may generate a short-lived wound-healing microenvironment that tumors can exploit to enhance the risk of dissemination and recurrence29.
Further analysis of the TCGA cohort identified 68 differentially expressed PARDTGs significantly enriched in neuroactive ligand-receptor interactions, calcium signaling, and addiction-related pathways. The constructed PPI network highlighted several hub genes related to neurotransmission transporters and receptors, such as DRD2, SLC6A3, and SLC6A430, suggesting additional regulatory input from perioperative neurotransmitter signaling in OV progression. Recent work demonstrated that the DRD2 antagonist ONC206 suppresses proliferation and invasion in OV cells and transgenic mouse models, inducing cell-cycle arrest and apoptosis, highlighting the therapeutic potential of this axis. CHRNA4 and GRIN2A encode cholinergic receptor and NMDA receptor–related proteins, respectively; activation of these receptors facilitates intracellular Ca2⁺ influx31,32, while calcium perturbation can remodel the cytoskeleton and activate tumor-promoting transcriptional programs33. In addition, addiction-associated receptors (e.g., µ-opioid receptors) have been linked to mTORC1 activation and immune evasion34. Collectively, these findings suggest potential crosstalk between anesthetic target pathways and the perioperative stress–neuro–immune network, thereby influencing tumor plasticity and recurrence risk within a short perioperative window.
The 17-gene risk model demonstrated stable prognostic performance across multiple independent cohorts. High-risk patients were enriched in pathways such as “Regulation of actin cytoskeleton” and “Proteoglycans in cancer,” implicating enhanced cytoskeletal remodeling and metastatic potential. Immune profiling revealed higher proportions of M2 macrophages, upregulation of immune checkpoint–related genes, and elevated TIDE scores in the high-risk group. M2 macrophages promote immune evasion, and postoperative inflammatory activation may drive the recruitment of myeloid-derived suppressor cells (MDSCs)35. Notably, EPHA4 was predominantly expressed in endothelial and fibroblast subsets, suggesting its potential involvement in vascular regulation, stromal remodeling, and tumor microenvironmental interactions. EPHA4 is a member of the Eph receptor tyrosine kinase family and functions as an important mediator of cell–cell communication through Eph/ephrin signaling. Activation of EPHA4 can regulate downstream pathways involved in cytoskeletal rearrangement, cell adhesion, migration, and extracellular matrix organization36. In the tumor microenvironment, dysregulated EPHA4 signaling has been implicated in promoting tumor cell invasion, angiogenic responses, stromal activation, and interactions between malignant cells and surrounding stromal components37. These findings suggest that EPHA4 may contribute to the aggressive biological characteristics of high-risk patients by modulating vascular–stromal communication and tumor ecological remodeling. Concurrently, high-risk patients exhibited higher mutation frequencies in genes such as MUC16 and CSMD3, which are implicated in stromal interactions and immune evasion38,39. Taken together, high-risk patients appear to exhibit malignant ecological features characterized by dysregulated cytoskeletal dynamics, immunosuppressive microenvironments, and matrix remodeling, suggesting that PARDTGs may be associated with changes in tumor ecology and disease progression.
Anesthetic agents can also reprogram multi-gene expression via modulation of non-coding RNA networks, affecting tumor cell adhesion, migration, apoptosis resistance, and maintenance of stemness, thereby potentially altering postoperative recurrence risk40,41. In our miRNA–transcription factor core regulatory network, miR-27a-3p, miR-34a-5p, and miR-106b-5p were identified as potential regulatory hubs, and extensive evidence supports their involvement in OV progression and anesthetic-related pharmacologic responses42,43,44. FOXC1, as a core transcription factor, plays a critical role in promoting migration, invasion, and EMT phenotypes in OV and is regulated upstream by multiple non-coding RNAs45.
Pan-cancer analysis was performed to further explore the biological characteristics of KRT81 across different malignancies rather than to validate the ovarian cancer prognostic model. In our analysis, KRT81 was significantly upregulated in most cancer types and correlated with aneuploidy, immune infiltration, and stromal scores, suggesting involvement in ecological niche remodeling and immune evasion. As a member of the type II keratin family, KRT81 is involved in maintaining epithelial cytoskeletal integrity, cellular mechanical stability, and stress adaptation. Dysregulated KRT81 expression may affect tumor cell plasticity by influencing cytoskeletal organization, epithelial differentiation, and interactions between tumor cells and the surrounding microenvironment. Moreover, aberrant keratin remodeling has been implicated in cancer progression through modulation of cell proliferation, migration, invasion, and immune–stromal communication. Previous studies reported that KRT81 serves as a biomarker for immune subtyping and prognostic stratification in OV46 and contributes to immunosuppressive microenvironment formation and immunotherapy response prediction in triple-negative breast cancer47. Thus, KRT81 may represent a key node in perioperative tumor plasticity networks with mechanistic and translational relevance.
Collectively, this study provides the first spatial- and single-cell–level characterization of PARDTG expression ecology in OV and illustrates their associations with immune microenvironments, stemness features, and genomic instability, suggesting that perioperative anesthesia-related drug target genes may be associated with tumor evolutionary trajectories. Nonetheless, several limitations should be acknowledged. First, this study was primarily based on publicly available transcriptomic datasets, and differences in sample sources, sequencing platforms, and cohort characteristics may introduce potential batch effects and influence the robustness of the findings. Second, although external cohorts were used for validation, the prognostic model was developed from retrospective datasets, and potential overfitting due to feature selection approaches cannot be completely ruled out. Third, although single-cell and spatial transcriptomic analyses provided insights into the biological roles of PARDTGs, these findings were mainly based on computational inference and required further experimental validation. In addition, some exploratory analyses, including pan-cancer and immune correlation analyses, involved multiple comparisons, and potential false-positive associations should be interpreted cautiously. Finally, the limited spatial transcriptomic resolution and lack of functional validation of the predicted regulatory networks represent additional limitations. Future studies incorporating experimental models and clinical samples are warranted to further validate the identified mechanisms.
This study revealed that PARDTGs exert important transcriptional ecological functions in OV and may participate in postoperative microenvironment-driven invasion and immune evasion, providing new molecular evidence for perioperative precision anesthesia, risk stratification, and recurrence prevention.
Disclosures
The authors declare that they have no competing interests
Acknowledgements
We sincerely thank the researchers who shared their valuable datasets in the TCGA and GEO databases, including TCGA-OV, GSE26193, GSE30161, GSE63885, GSE154600, and GSE211956.
Materials
| Name | Company | Catalog Number | Comments |
|---|---|---|---|
| Anti-Cytokeratin 81 antibody (rabbit polyclonal) | Proteintech, USA | 11342-1-AP | |
| Anti-GAPDH antibody (mouse monoclonal) | Proteintech, USA | 60004-1-Ig | |
| BCA protein assay kit | Thermo Fisher, USA | 23225 | |
| CIBERSORT | Stanford University | https://cibersort.stanford.edu | Immune infiltration | LM22 signature matrix | Immune cell infiltration analysis |
| Clinical characteristics of OV patients | UCSC Xena | http://xena.ucsc.edu/ | Clinical data | 341 patients | Clinical correlation analysis |
| clusterProfiler package | Bioconductor | https://bioconductor.org/packages/clusterProfiler | Functional enrichment analysis | Version 4.8.3 | GO, KEGG and GSEA analyses |
| ggplot2 package | CRAN | https://cran.r-project.org/package=ggplot2 | Data visualization | Version 4.0.2 | Data visualization |
| GSE26193 | GEO database | https://www.ncbi.nlm.nih.gov/geo/query/acc.cgi?acc=GSE26193 | Validation dataset | 107 samples | External validation |
| GSE30161 | GEO database | https://www.ncbi.nlm.nih.gov/geo/query/acc.cgi?acc=GSE30161 | Validation dataset | 58 samples | External validation |
| GSE63885 | GEO database | https://www.ncbi.nlm.nih.gov/geo/query/acc.cgi?acc=GSE63885 | Validation dataset | 70 samples | External validation |
| GSVA package | Bioconductor | https://bioconductor.org/packages/GSVA | Gene set enrichment analysis | Version 2.4.9 | ssGSEA analysis |
| limma package | Bioconductor | https://bioconductor.org/packages/limma/ | Differential expression analysis | Version 3.56.2 | DEG analysis |
| Overall survival information of OV patients | UCSC Xena | http://xena.ucsc.edu/ | Survival data | 353 patients | Prognostic model construction |
| PVDF membrane | Millipore, USA | IPVH00010 | |
| R | R Foundation for Statistical Computing | https://www.r-project.org/ | Bioinformatics software | Version 4.3.1 | Statistical analyses |
| RIPA buffer | Beyotime, China | P0013B | |
| Seurat package | CRAN | https://satijalab.org/seurat/ | Single-cell analysis | Version 5.4.0 | Single-cell RNA-seq analysis |
| STRING database | STRING Consortium | https://string-db.org | Protein interaction database | Version 12.0 | PPI network construction |
| survival package | CRAN | https://cran.r-project.org/package=survival | Survival analysis | Version 3.5.5 | Survival analysis |
| TCGA TARGET GTEx (Toil) ovarian gene expression data | UCSC Xena | http://xena.ucsc.edu/ | Training dataset | 420 TCGA tumor samples | Training cohort |
| TCGA TARGET GTEx (Toil) ovary normal tissue data | UCSC Xena | http://xena.ucsc.edu/ | Reference normal dataset | 88 GTEx normal samples | Differential expression analysis |
References
- Caruso G, Weroha SJ, Cliby W. Ovarian cancer: a review. JAMA. 2025;334(14):1278-91.
- Konstantinopoulos PA, Matulonis UA. Clinical and translational advances in ovarian cancer therapy. Nat Cancer. 2023;4(9):1239-57.
- Horowitz M, Neeman E, Sharon E, Ben-Eliyahu S. Exploiting the critical perioperative period to improve long-term cancer outcomes. Nat Rev Clin Oncol. 2015;12(4):213-26.
- Piegeler T, Beck-Schimmer B. Anesthesia and colorectal cancer: the perioperative period as a window of opportunity. Eur J Surg Oncol. 2016;42(9):1286-95.
- Zhang B, et al. Anesthetic propofol inhibits ferroptosis and aggravates distant cancer metastasis via Nrf2 upregulation. Free Radic Biol Med. 2023;195:298-308.
- He GN, et al. Ketamine induces ferroptosis of liver cancer cells by targeting lncRNA PVT1/miR-214-3p/GPX4. Drug Des Devel Ther. 2021;15:3965-78.
- Montégut L, et al. Benzodiazepines compromise the outcome of cancer immunotherapy. Oncoimmunology. 2024;13(1):2413719.
- Wall T, Sherwin A, Ma D, Buggy DJ. Influence of perioperative anaesthetic and analgesic interventions on oncological outcomes: a narrative review. Br J Anaesth. 2019;123(2):135-50.
- Ponferrada A, et al. Anaesthesia and cancer: can anaesthetic drugs modify gene expression? Ecancermedicalscience. 2020;14:1080.
- Piegeler T, et al. Endothelial barrier protection by local anesthetics: ropivacaine and lidocaine block tumor necrosis factor-α-induced endothelial cell Src activation. Anesthesiology. 2014;120(6):1414-28.
- Xu J, et al. Single-cell RNA sequencing reveals the tissue architecture in human high-grade serous ovarian cancer. Clin Cancer Res. 2022;28(16):3590-602.
- Yu D, et al. Development and validation of a breast cancer survival prediction model based on perioperative anesthesia-related drug target genes and analysis of immune microenvironment and drug sensitivity. Comput Biol Chem. 2026;120(Pt 2):108681.
- Wang S, et al. UCSCXenaShiny: an R/CRAN package for interactive analysis of UCSC Xena data. Bioinformatics. 2022;38(2):527-9.
- Gentric G, et al. PML-regulated mitochondrial metabolism enhances chemosensitivity in human ovarian cancers. Cell Metab. 2019;29(1):156-73.e10.
- Ferriss JS, et al. Multi-gene expression predictors of single-drug responses to adjuvant chemotherapy in ovarian carcinoma: predicting platinum resistance. PLoS One. 2012;7(2):e30550.
- Lisowska KM, et al. Gene expression analysis in ovarian cancer: faults and hints from DNA microarray study. Front Oncol. 2014;4:6.
- Liang L, et al. Integration of scRNA-seq and bulk RNA-seq to analyse the heterogeneity of ovarian cancer immune cells and establish a molecular risk model. Front Oncol. 2021;11:711020.
- Denisenko E, et al. Spatial transcriptomics reveals discrete tumour microenvironments and autocrine loops within ovarian cancer subclones. Nat Commun. 2024;15(1):2860.
- Quan W, et al. Single-cell analysis reveals the roles and regulatory mechanisms of type I interferons in Parkinson’s disease. Cell Commun Signal. 2024;22(1):212.
- Hu C, et al. CellMarker 2.0: an updated database of manually curated cell markers in human/mouse and web tools based on scRNA-seq data. Nucleic Acids Res. 2023;51(D1):D870-6.
- Ritchie ME, et al. limma powers differential expression analyses for RNA-sequencing and microarray studies. Nucleic Acids Res. 2015;43(7):e47.
- Yu G, Wang LG, Han Y, He QY. clusterProfiler: an R package for comparing biological themes among gene clusters. OMICS. 2012;16(5):284-7.
- Mayakonda A, et al. Maftools: efficient and comprehensive analysis of somatic variants in cancer. Genome Res. 2018;28(11):1747-56.
- Zu S, et al. Development and validation of a recurrence risk prediction model for elderly schizophrenia patients. BMC Psychiatry. 2025;25(1):73.
- Zhou G, et al. NetworkAnalyst 3.0: a visual analytics platform for comprehensive gene expression profiling and meta-analysis. Nucleic Acids Res. 2019;47(W1):W234-41.
- Liao C, Wang X. TCGAplot: an R package for integrative pan-cancer analysis and visualization of TCGA multi-omics data. BMC Bioinformatics. 2023;24(1):483.
- Swanton C, et al. Embracing cancer complexity: hallmarks of systemic disease. Cell. 2024;187(7):1589-616.
- Vendramin R, Litchfield K, Swanton C. Cancer evolution: Darwin and beyond. EMBO J. 2021;40(18):e108389.
- Demicheli R, et al. The effects of surgery on tumor growth: a century of investigations. Ann Oncol. 2008;19(11):1821-8.
- Marinho V, et al. Genetic influence alters the brain synchronism in perception and timing. J Biomed Sci. 2018;25(1):61.
- Pan X, et al. Hepatocyte CHRNA4 mediates the MASH-promotive effects of immune cell-produced acetylcholine and smoking exposure in mice and humans. Cell Metab. 2023;35(12):2231-49.e7.
- Camp AJ, et al. Loss of Grin2a causes a transient delay in the electrophysiological maturation of hippocampal parvalbumin interneurons. Commun Biol. 2023;6(1):952.
- Sun Y, et al. Identification of potential diagnoses based on immune infiltration and autophagy characteristics in major depressive disorder. Front Genet. 2022;13:702366.
- Lennon FE, Moss J, Singleton PA. The µ-opioid receptor in cancer progression: is there a direct effect? Anesthesiology. 2012;116(4):940-5.
- Mohammadpour H, et al. β2-adrenergic receptor-mediated signaling regulates the immunosuppressive potential of myeloid-derived suppressor cells. J Clin Invest. 2019;129(12):5537-52.
- Bhatia S, et al. Effects of altered ephrin-A5 and EphA4/EphA7 expression on tumor growth in a medulloblastoma mouse model. J Hematol Oncol. 2015;8:105.
- Dong Y, et al. MicroRNA-335 suppresses the proliferation, migration, and invasion of breast cancer cells by targeting EphA4. Mol Cell Biochem. 2018;439(1-2):95-104.
- Li X, Pasche B, Zhang W, Chen K. Association of MUC16 mutation with tumor mutation load and outcomes in patients with gastric cancer. JAMA Oncol. 2018;4(12):1691-8.
- Zhao Y, et al. Patient-derived ovarian cancer organoid carries immune microenvironment and blood vessel keeping high response to cisplatin. MedComm (2020). 2024;5(9):e697.
- Jiang S, et al. Effects of propofol on cancer development and chemotherapy: potential mechanisms. Eur J Pharmacol. 2018;831:46-51.
- Wang ZT, et al. Propofol suppresses proliferation and invasion of pancreatic cancer cells by upregulating microRNA-133a expression. Genet Mol Res. 2015;14(3):7529-37.
- Li E, Han K, Zhou X. MicroRNA-27a-3p downregulation inhibits malignant biological behaviors of ovarian cancer by targeting BTG1. Open Med (Wars). 2019;14:577-85.
- Zhang Y, et al. Sevoflurane inhibits the apoptosis of hypoxia/reoxygenation-induced cardiomyocytes via regulating miR-27a-3p-mediated autophagy. J Pharm Pharmacol. 2021;73(11):1470-9.
- Zhao H, et al. Sevoflurane inhibits migration and invasion of glioma cells via regulating the miR-34a-5p/MMP-2 axis. Life Sci. 2020;256:117897.
- Wu Z, et al. Circ-PTK2 (hsa_circ_0008305) regulates the pathogenic processes of ovarian cancer via the miR-639 and FOXC1 regulatory cascade. Cancer Cell Int. 2021;21(1):277.
- Hu Y, et al. DNA methylation and transcription factor-driven immune subtypes in ovarian cancer. Discov Oncol. 2025;16(1):1646.
- Yan Z, et al. The prognostic marker KRT81 is involved in suppressing CD8+ T cells and predicts immunotherapy response for triple-negative breast cancer. Cancer Biol Ther. 2024;25(1):2355705.