Reniform nematode infection significantly reduces cotton yield and fiber quality. Lignin strengthens plant cell walls and contributes to structural defenses against pests, but its role in reniform nematode resistance in cotton has not been examined. This study describes a histochemical workflow for visualizing lignin deposition in roots of reniform nematode-resistant and susceptible cotton (Gossypium arboreum) genotypes using phloroglucinol staining.
Research Article
Histochemical Analysis for Lignin Differences Between Reniform Nematode-Resistant and Susceptible Cotton Genotypes
In This Article
Summary
Abstract
Reniform nematodes (Rotylenchulus reniformis) are a major constraint on cotton production, particularly in the southern United States. The reniform nematode is the second most important pest among more than 400 nematode species. These nematodes pose a threat to global food security. Increasing environmental and human health concerns and the cost of nematicides have intensified interest in resistant cotton germplasm. The plant cell wall, especially lignin, is a critical biopolymer involved in resistance to biotic stress. Because nematodes infect root tissues, cell wall components such as lignin may contribute to defense; however, lignin-mediated barriers in cotton roots are not well characterized. This study employed a standardized phloroglucinol-HCl histochemical staining protocol to visualize lignin deposition differences in reniform nematode-resistant (A2-514, A2-995) and susceptible cotton (Gossypium arboreum) genotypes at the true leaf stage under non-infected conditions. This stain binds specifically to hydroxy cinnamylaldehyde such as coniferyl aldehyde and sinapyl aldehyde of lignin in the presence of acid and generates a pinkish purple color to visualize lignin. Distinct lignin staining patterns were observed between resistant and susceptible genotypes, supporting a potential role for lignin-associated structural defenses.
Introduction
Cotton is cultivated worldwide for its fiber and is highly vulnerable to soil-borne pests, particularly nematodes, which can cause substantial yield losses. Among these, the reniform nematode (Rotylenchulus reniformis) is a major pathogen affecting cotton and other crops globally, with pronounced impacts in the southern United States, where infestations can reduce yields by more than 50%1. This microscopic, soil-dwelling organism parasitizes cotton roots2, impairing plant vigor, biomass, and fiber yield through disruption of water and nutrient uptake and the establishment of feeding sites (Figure 1). Reniform nematode infection alters cotton plant growth by delaying flowering time, reducing boll size and number, and compromising lint quality3. Severe losses have been reported in Mississippi, Alabama, and Louisiana4. Nematicides are commonly employed to manage nematode infestations, but their high cost and negative impact on the environment and human health have necessitated the need for alternatives5,6. The development of resistant germplasm represents a promising approach to mitigate reniform nematode damage4. Because nematodes feed within root tissues, cell-wall-based defenses, particularly lignification, are hypothesized to restrict invasion, inhibit pathogen-derived cell-wall-degrading enzymes, and limit the establishment and expansion of nematode feeding sites7,8,9. Enhanced lignification has been correlated with reduced pathogen susceptibility across plant species10,11,12,13,14. Prior research in cotton has linked lignin and laccase gene expression to resistance against Verticillium dahliae15 and studies in Fusarium resistant and susceptible cultivars revealed higher lignin levels in resistant cultivars16. Similar observations in Arabidopsis and rice, where suppression of lignin biosynthetic genes increased susceptibility, underscore lignification’s importance in plant defense.
Lignin is a complex phenolic biopolymer found in the secondary cell walls of vascular plants, where it imparts structural rigidity, mechanical strength, and hydrophobicity17. Synthesized through the shikimate and phenylpropanoid pathways, lignin is the second most abundant terrestrial biopolymer after cellulose, accounting for approximately 30% of the earth’s organic carbon18,19. By reinforcing the cellulose-hemicellulose network, lignin strengthens load-bearing tissues and supports overall plant development. Lignin is especially prominent in highly specialized tissues such as xylem, sclerenchyma, phloem fibers, and periderm, creating a water‑repellent barrier essential for efficient transport of water and minerals. In addition to structural functions, lignin acts as a biochemical and physical defense barrier, restricting pathogen ingress and minimizing damage from biotic and abiotic stresses20,21,22. Lignification is a dynamic process central to resistance against a wide spectrum of pathogens, including necrotrophs, biotrophs, and hemibiotrophs. Its biosynthesis from the primary monolignols sinapyl, coniferyl, and p-coumaryl alcohol varies by species, tissue type, and developmental stage, influencing the degree of resistance. Pathogen invasion or abiotic stress often triggers localized lignin deposition, further fortifying plant defenses23,24.
Elucidating lignin’s role in reniform nematode resistance is crucial for advancing cotton management strategies. Visual and biochemical characterization of lignin distribution offers insight into the spatial and temporal dynamics of cell‑wall modifications that underpin early defense responses. This study employs histochemical phloroglucinol staining to analyze lignin deposition patterns that naturally exist in reniform‑nematode‑resistant and susceptible cotton genotypes, providing a practical preliminary framework for evaluating cell-wall-associated resistance traits and informing breeding programs aimed at improving crop resilience.
Protocol
The experiments were conducted in a greenhouse using the plant materials described below. All chemicals, equipment, and reagents utilized in this study are detailed in the Table of Materials.
Plant material
Seeds were obtained for both susceptible (A2‑20, PI 129742; A2‑40, PI 183202) and resistant germplasm (A2‑514, PI 616008; A2‑995, PI 629323). Additionally, Deltapine 16, a susceptible cultivar, was included in this study. Seeds were placed in sterile water and soaked for 24 h at room temperature. Following soaking, seeds were thoroughly rinsed with fresh sterile water to remove residual contaminants. The rinsed seeds were then transferred onto sterile Petri plates lined with pre‑wetted, autoclaved paper towels and incubated for 2 days at room temperature to facilitate germination (Figure 2).
Greenhouse planting
Plastic pots were filled with pre-moistened moisture-control potting mix. The soil was pre-wetted for two days prior to transplanting. Germinated seedlings were then carefully transplanted into the pre‑wetted soil and maintained under controlled greenhouse conditions at 28 °C/25 °C day/night cycles until the true-leaf stage (Figure 2). Three biological replicates were planted for each genotype.
Sample collection
Plants at the true‑leaf stage were gently removed from the soil by loosening the surrounding soil medium to minimize root damage. Roots were rinsed 2–3 times with water to remove adhering soil particles. Root and shoot tissues from each genotype were collected for sectioning (Figure 3).
Preparation of phloroglucinol staining solution
A 3% phloroglucinol solution was prepared by dissolving 0.45 g of phloroglucinol in a mixture of two parts 100% ethanol (10 mL) and one part concentrated HCl (5 mL) in a fume hood. The staining solution was prepared following a previously described method16.
Preparation of section and staining procedure for histochemical analysis of lignin
Root and shoot tissues were sectioned using a sterile razor blade to obtain thin transverse sections (Figure 3). Fresh sections were transferred to microscope slides and covered with 20 µL of the 3% phloroglucinol staining solution for 1 min. Sections were then rinsed with sterile water, mounted under coverslips, and imaged (Figure 4, Figure 5, Figure 6). The same procedure was used for stem tissues (Supplementary Figure 1).
Microscopy imaging
Imaging was performed using a digital microscope. Prepared glass slides containing stained tissue samples were placed on the microscope platform for imaging. Following initialization of the microscope imaging software, the desired magnifications of 100x, 200x, and 300x were selected in bright-field mode. Coarse and fine focus adjustments were made to clearly visualize lignin staining patterns within the tissue sections. Images were recorded and saved with their respective sample identification numbers. Comparative analysis was then performed by examining images from both resistant and susceptible genotypes to assess differences in lignin staining. Images of resistant and susceptible genotypes were compared using ImageJ to determine differences in the percent stained area using uniform thresholds. Results were exported as CSV files after all three replicates were processed. Graphs were then prepared to compare resistant and susceptible genotypes.
Results
Histochemical analysis of resistant and susceptible cotton genotypes
Histochemical examination of transverse root and stem sections at true leaf stage revealed visual differences in resistant and susceptible genotypes as demonstrated in Figure 4, Figure 5, and Supplementary Figure 1 (stem transverse sections). Higher magnifications (100x–300x) provided detailed views of these differences (Figure 4A–C and Figure 5A–C for resistant genotypes and Figure 4D–F and Figure 5D–F for susceptible genotypes). Lignin staining patterns differed by tissue types: resistant genotypes exhibited lower or similar lignin staining patterns in stems, while susceptible genotypes displayed relatively higher stem lignification visually (Supplementary Figure 1A–D).
Quantitative image analysis of lignin staining
Deltapine 16, a susceptible cultivar included in this study, displayed lower lignin staining (Figure 6A–C) with percent stained area values of 12, 17.8, and 16.3 (Figure 6D). The susceptible genotype A2-40 had percent stained area values of 25.2, 19.9, and 28.75, while the resistant genotype, A2-995, showed percent stained area values of 54.95, 58.71, and 69.85 (Figure 7). However, A2-20 had percent stained area values of 16.6, 21.3, and 20.4 whereas A2-514 showed percent stained area values as 49.8, 34.1, and 43.38 (Figure 8). The comparison yielded a p-value of 0.06. Because these values were generated using different thresholds, uniform-threshold ImageJ analysis was performed using identical hue, saturation, and brightness thresholds to ensure reproducibility across replicates. The resistant genotype (A2-514) showed relatively greater staining than the susceptible genotype (A2-20). Percent stained area was calculated as the ratio of lignin-positive pixels to total tissue pixels within the section. The uniform-threshold quantitative comparison of the susceptible genotype A2-20 and resistant genotype A2-514 is shown in Figure 9. Overall, uniform threshold analysis demonstrates that genotype-specific lignification differences exist among these genotypes.
DATA AVAILABILITY:
Raw data is added as a Supplementary File.
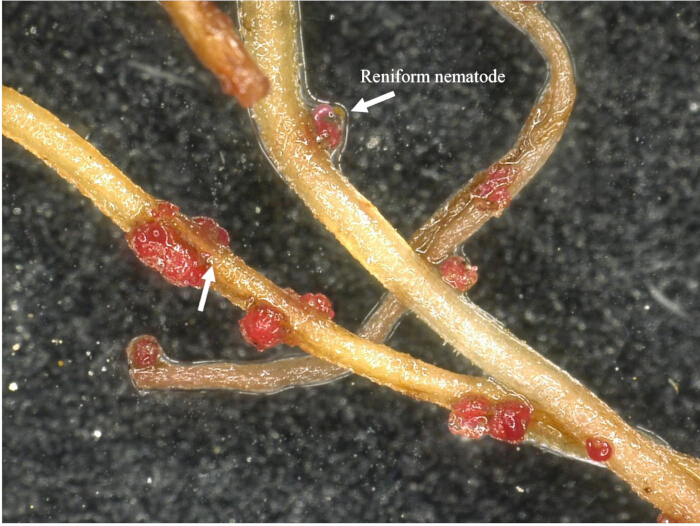
Figure 1: Microscopic view of reniform nematodes feeding on cotton roots. Reniform nematodes feeding on cotton roots are shown at 50x magnification following staining with red food coloring. Please click here to view a larger version of this figure.
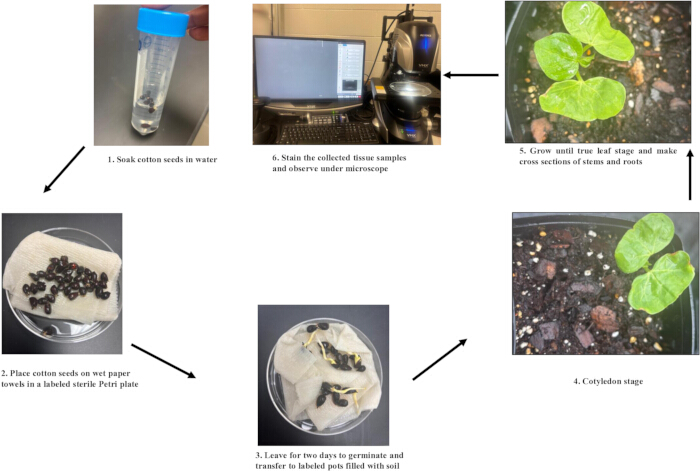
Figure 2: Preparation of plant material for lignin histochemical analysis. The workflow consists of the following steps: (1) soak cotton seeds in water; (2) place the seeds on wet paper towels in a labeled sterile Petri plate; (3) allow the seeds to germinate for 2 days and transfer the seedlings to labeled pots containing soil; (4) grow the seedlings to the cotyledon stage; (5) continue growing the plants to the true-leaf stage and prepare cross sections of the stems and roots; and (6) stain the collected tissue sections and observe them under a microscope. Please click here to view a larger version of this figure.
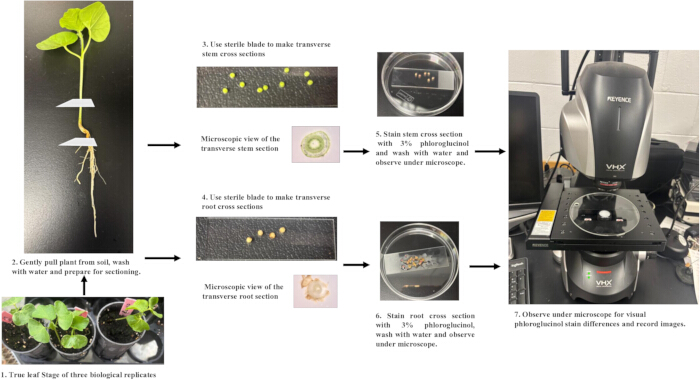
Figure 3: Collection and staining of cotton root and stem sections using phloroglucinol-HCl. The workflow consists of the following steps: (1) grow three biological replicates to the true-leaf stage; (2) gently remove the plants from the soil, wash with water, and prepare them for sectioning; (3) use a sterile blade to prepare transverse stem sections; (4) use a sterile blade to prepare transverse root sections; (5) stain the stem sections with 3% phloroglucinol-HCl, rinse with water, and observe under a microscope; (6) stain the root sections with 3% phloroglucinol-HCl, rinse with water, and observe under a microscope; and (7) observe the stained sections under a microscope to visualize phloroglucinol staining differences and record images. Please click here to view a larger version of this figure.
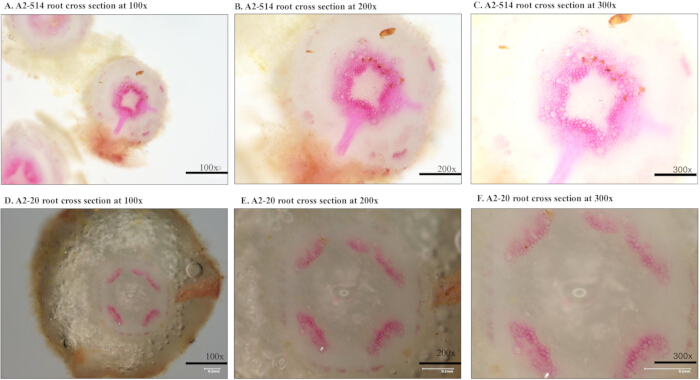
Figure 4: Lignin staining in transverse root sections of A2-514 and A2-20 cotton genotypes. Lignin-stained transverse root sections of the resistant genotype A2-514 at (A) 100x, (B) 200x, and (C) 300x magnification. Lignin-stained transverse root sections of the susceptible genotype A2–20 at (D) 100x, (E) 200x, and (F) 300x magnification. Please click here to view a larger version of this figure.
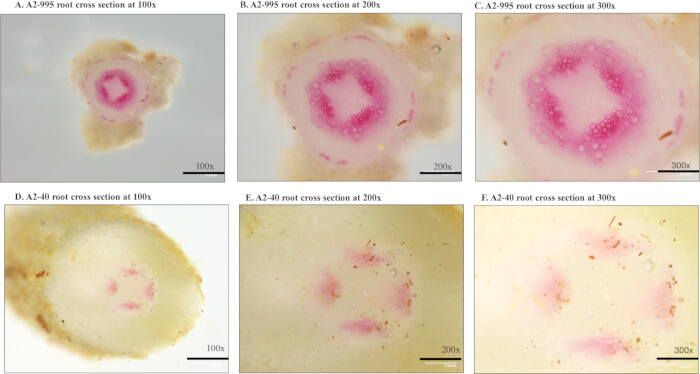
Figure 5: Lignin staining in transverse root sections of A2-995 and A2-40 cotton genotypes. Lignin-stained transverse root sections of the resistant genotype A2-995 at (A) 100x, (B) 200x, and (C) 300x magnification. Lignin-stained transverse root sections of the susceptible genotype A2-40 at (D) 100x, (E) 200x, and (F) 300x magnification. Please click here to view a larger version of this figure.
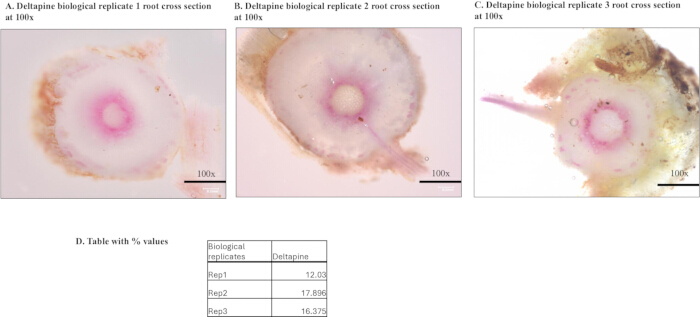
Figure 6: Lignin staining and quantitative analysis of transverse root sections of Deltapine 16. Lignin-stained transverse root sections of three biological replicates of the susceptible cultivar Deltapine 16 at 100x magnification: (A) biological replicate 1, (B) biological replicate 2, and (C) biological replicate 3. (D) Percent stained area for the three biological replicates determined by quantitative ImageJ analysis. Please click here to view a larger version of this figure.
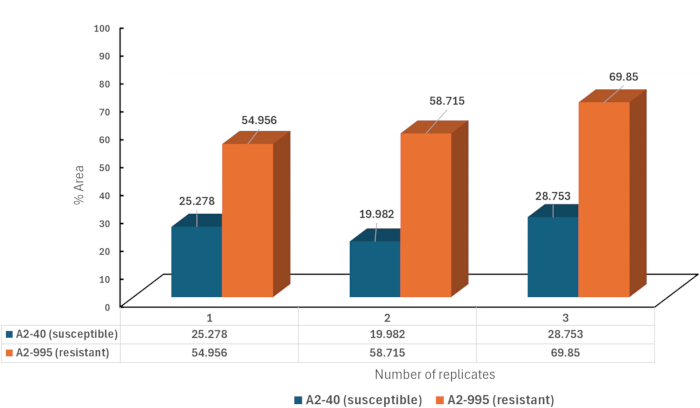
Figure 7: Quantitative analysis of lignin staining in A2-40 and A2-995 cotton genotypes. Percent stained area determined by ImageJ analysis for three biological replicates of the susceptible genotype A2-40 and the resistant genotype A2-995. Please click here to view a larger version of this figure.
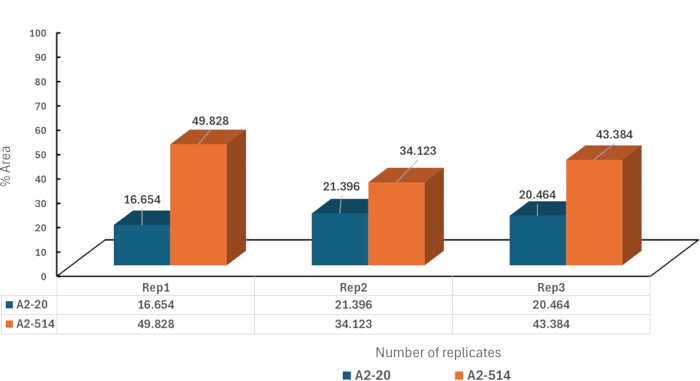
Figure 8: Quantitative analysis of lignin staining in A2-20 and A2-514 cotton genotypes. Percent stained area determined by ImageJ analysis for three biological replicates of the susceptible genotype A2-20 and the resistant genotype A2-514. Please click here to view a larger version of this figure.
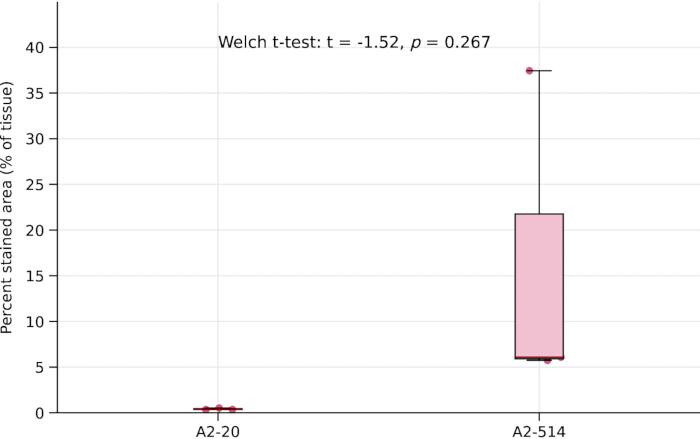
Figure 9: Uniform-threshold quantification of lignin staining in A2-20 and A2-514 cotton genotypes. Percent stained area in the susceptible genotype A2-20 and resistant genotype A2-514 following uniform-threshold image analysis. Statistical comparison was performed using Welch's t-test (t = −1.52, p = 0.267). Please click here to view a larger version of this figure.
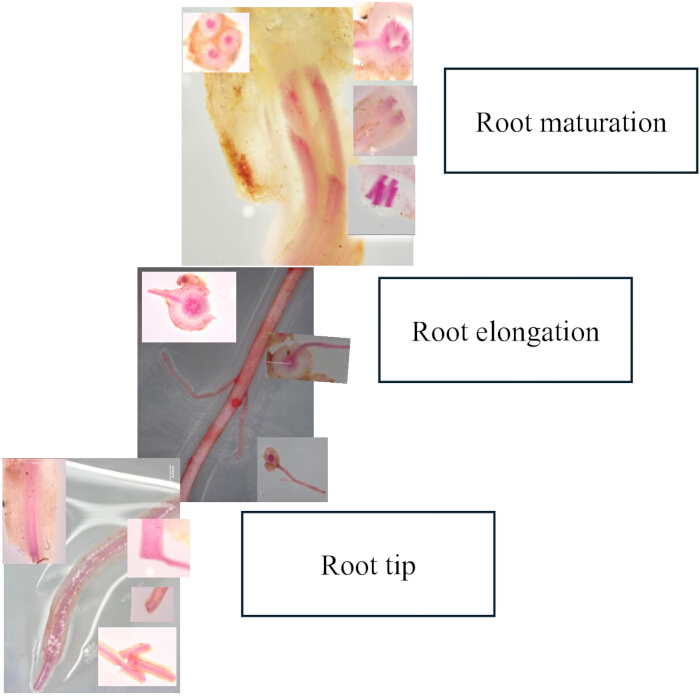
Figure 10: Visualization of lignin staining across different root regions. Representative images showing lignin staining in the root maturation, root elongation, and root tip regions. Please click here to view a larger version of this figure.
Supplementary Figure 1: Lignin staining in transverse stem sections of resistant and susceptible cotton genotypes. Lignin-stained transverse stem sections at 100x magnification of (A) susceptible A2-20, (B) resistant A2-514, (C) susceptible A2-40, and (D) resistant A2-995. Please click here to download this file.
Discussion
Lignin associated with plant cell walls serves as an important physical barrier against pests, including nematodes. In the present study, resistant and susceptible cotton genotypes showed distinct visual differences in lignin staining, following a pattern similar to that previously reported in Fusarium-resistant and susceptible cultivars. The staining allowed clear visualization of lignin distribution across root regions—maturation, elongation, and the root tip—where lignin intensity increased progressively from the upper root toward the tip (Figure 10). While these patterns provide useful anatomical insight, lignin dynamics in response to nematode infection were not evaluated in the current study and require confirmation in future research. Previous studies suggest that pathogen presence can induce lignin biosynthesis, reinforcing the need to examine lignin changes under nematode pressure. Incorporating biochemical analyses of lignin quantity and composition would further strengthen interpretation of the staining patterns observed in these genotypes. Overall, these findings highlight the role of lignin-mediated structural defenses in cotton reniform nematode resistance and demonstrate the utility of phloroglucinol staining for characterizing these traits. Continued integration of anatomical, biochemical, and molecular approaches will deepen the understanding of lignin biosynthesis and its contribution to developing durable resistance to reniform nematodes.
Disclosures
The authors have nothing to disclose.
DISCLAIMERS
USDA is an equal opportunity provider, employer, and lender. Mention of trade names or commercial products in this publication is solely for the purpose of providing specific information and does not imply recommendation or endorsement by the U.S. Department of Agriculture. The findings and conclusions in this article are those of the author(s) and should not be construed to represent any official USDA or U.S. Government determination or policy here.
Acknowledgements
The authors thank Dr. Katherine Parys for providing access to the microscopy laboratory facilities used in this study. The authors also thank Dr. Junping Chen and Dr. Abdulraheem for their suggestions and assistance in improving the manuscript. This research was supported by USDA-ARS project 6066-21000-053-00D.
Materials
| Name | Company | Catalog Number | Comments |
|---|---|---|---|
| Moisture control potting mix | Miracle-Gro | 073561005197 032247557832 | Amazon web site |
| Microscope | Keyence VHX | VHX3000 | Any comparable bright field microscope can be used |
| Sterile Razor blades | Workpro | W018057 | Amazon web site |
| Cutting board | Freshware | 15.75"L x 9.8"W x 0.3"Th | Amazon web site |
| Slides and coverslips | Amscope | BS-50P-100S-22X4 | Any brand can be used. This one is available at amazon. |
| Sterile water/ Distilled water/ autoclaved water | Gibco | 15230147 | Any brand/ sterile atoclaved water can be used |
| Phloroglucinol stain | Fischer Scientific | AC241761000 | Available at Fischer Scientific |
| Concentrated HCl | Fischer Scientific | CAS: 7647-01-0 | Available at Fischer Scientific |
| Absolute ethanol | Fischer Scientific | 64-17-5 | Available at Fischer Scientific |
| Pots | BTPLASTIK | B0DSBQMXHN | Any plastic pots can be used, availale at amazon |
| Petri plates | Kingdder | B0BS95MCGS | Available at amazon and any other brand can be used |
| Paper towels | Tork | MB540A | Available at amazon and any other brand can be used |
| Image J | Software | Available online | Free software available to use |
References
- Robinson AF. Reniform in US cotton: when, where, why, and some remedies. Annu Rev Phytopathol. 2007;45(1):263-88.
- Li R, Erpelding JE, Stetina SR. Genome-wide association study of Gossypium arboreum resistance to reniform nematode. BMC Genet. 2018;19(1):52.
- Koebernick JC et al. Response to nematicide by cotton genotypes varying in reniform nematode resistance. Crop Sci. 2021;61(2):929-35.
- Singh B et al. Reniform nematode impact on cotton growth and management strategies: A review. Agron J. 2023;115(5):2140-58.
- Riga E. The effects of Brassica green manures on plant parasitic and free-living nematodes used in combination with reduced rates of synthetic nematicides. J Nematol. 2011;43(2):119.
- Khanal C, McGawley EC, Overstreet C, Stetina SR. The elusive search for reniform nematode resistance in cotton. Phytopathology. 2018;108(5):532-41.
- Moura JCMS et al. Abiotic and biotic stresses and changes in the lignin content and composition in plants. J Integr Plant Biol. 2010;52(4):360-76.
- Schutzendubel A, Polle A. Plant responses to abiotic stresses: heavy metal-induced oxidative stress and protection by mycorrhization. J Exp Bot. 2002;53(372):1351-65.
- Liu Q et al. Transcriptional and physiological analyses identify a regulatory role for hydrogen peroxide in the lignin biosynthesis of copper-stressed rice roots. Plant Soil. 2015;387(1-2):323-36.
- Fujimoto T, Mizukubo T, Abe H, Seo S. Sclareol induces plant resistance to root-knot nematode partially through ethylene-dependent enhancement of lignin accumulation. Mol Plant Microbe Interact. 2015;28(4):398-407.
- Wang Y et al. CmMYB19 over-expression improves aphid tolerance in chrysanthemum by promoting lignin synthesis. Int J Mol Sci. 2017;18(3):619.
- Mandal S, Kar I, Mukherjee AK, Acharya P. Elicitor-induced defense responses in Solanum lycopersicum against Ralstonia solanacearum. ScientificWorldJournal. 2013;2013(1):561056.
- Santiago R, Barros-Rios J, Malvar RA. Impact of cell wall composition on maize resistance to pests and diseases. Int J Mol Sci. 2013;14(4):6960-80.
- Gallego-Giraldo L et al. Elicitors and defense gene induction in plants with altered lignin compositions. New Phytol. 2018;219(4):1235-51.
- Smit F, Dubery IA. Cell wall reinforcement in cotton hypocotyls in response to a Verticillium dahliae elicitor. Phytochemistry. 1997;44(5):811-15.
- Mendu L et al. Lignin and cellulose content differences in roots of different cotton cultivars associated with different levels of Fusarium wilt race 4 (FOV4) resistance-response. J Agric Food Res. 2022;10:100420.
- Tiwari RK et al. Mechanistic insights on lignin-mediated plant defense against pathogen infection. Plant Physiol Biochem. 2025;228:110224.
- Ralph J et al. Lignins: Natural polymers from oxidative coupling of 4-hydroxyphenyl-propanoids. Phytochem Rev. 2004;3(1):29-60.
- Dixon RA et al. The phenylpropanoid pathway and plant defence-a genomics perspective. Mol Plant Pathol. 2002;3(5):371-90.
- Vance CP, Kirk TK, Sherwood RT. Lignification as a mechanism of disease resistance. Annu Rev Phytopathol. 1980;18(1):259-88.
- Nicholson RL, Hammerschmidt R. Phenolic compounds and their role in disease resistance. Annu Rev Phytopathol. 1992;30(1):369-89.
- Shah SWA et al. Lignin-based additive materials: A review of current status, challenges, and future perspectives. Addit Manuf. 2023;74:103711.
- Yadav S, Chattopadhyay D. Lignin: the building block of defense responses to stress in plants. J Plant Growth Regul. 2023;42(10):6652-66.
- Weng JK, Chapple C. The origin and evolution of lignin biosynthesis. New Phytol. 2010;187(2):273-85.