This study demonstrates that Qiming Granule (QMG) ameliorates diabetic retinopathy (DR) by modulating the gut–retina axis. QMG reshaped gut microbiota, suppressed systemic inflammation, and restored the CMKLR1-centered regulatory network, thereby reversing retinal histopathological damage. These findings position QMG as a promising gut–retina therapeutic strategy for DR.
Research Article
Correlational Analysis of Qiming Granule with the CMKLR1-Centered Network and Systemic Inflammation via the Gut–Retina Axis in Diabetic Retinopathy
In This Article
Summary
Abstract
Diabetic retinopathy (DR) is a neurovascular complication driven by chronic hyperglycemia and systemic inflammation, with emerging evidence highlighting the gut–retina axis as a critical but underexploited therapeutic target. This study investigates whether Qiming Granule (QMG) exerts its protective efficacy against DR by modulating the gut–retina axis. C57BL/6 mice were randomized into experimental groups and subjected to distinct interventions. Retinal histopathological changes were assessed by Hematoxylin-Eosin (HE) staining. Serum levels of inflammatory cytokines (IL-1β, IL-6, TNF-α) were measured by enzyme-linked immunosorbent assay (ELISA). The expression of key regulatory proteins (CMKLR1, Wnt5a, PPAR-γ, AP-1, TP53) in both retinal and colonic tissues was detected by Western blot (WB). Gut microbiota composition and diversity were characterized by full-length 16S rDNA sequencing. Correlational analyses were performed to assess relationships between gut microbiota and inflammatory factors or key proteins. QMG treatment improved retinal histopathological abnormalities, as evidenced by restoration of retinal laminar architecture, partial recovery of retinal ganglion cell numbers (P < 0.001), and reversal of retinal thinning (P < 0.01). It also markedly downregulated serum IL-1β, IL-6, and TNF-α levels (P < 0.0001). Along the gut‑retina axis, QMG reversed the abnormal expression of key regulatory proteins, notably the CMKLR1‑centered network (Wnt5a, PPAR-γ, AP-1, TP53). Furthermore, QMG restored gut microbiota composition, diversity, and function, and correlation analyses revealed that QMG couples systemic inflammation with these regulatory proteins to modulate the gut‑retina axis. This study provides preliminary pharmacological evidence that QMG ameliorates DR by coupling the CMKLR1-centered regulatory network (including Wnt5a, PPAR-γ, AP-1, and TP53) and systemic inflammation via the gut–retina axis, positioning QMG as a promising gut–retina therapeutic strategy for DR.
Introduction
Diabetic retinopathy (DR), one of the most common microvascular complications of diabetes mellitus (DM), is a leading cause of blindness among working-age adults worldwide1. Globally, DR affects approximately 20–30% of the DM population2. Chronic hyperglycemia drives the pathogenesis of DR by triggering a cascade of pathological events, including impaired neurovascular coupling, heightened inflammatory responses, and oxidative stress3. Recently, alterations in gut microbiota diversity and composition have been observed in diabetic patients with retinopathy compared to those without4,5. Consequently, the gut–retina axis—a bidirectional communication network linking intestinal homeostasis to retinal health—has emerged as a novel contributor to DR progression. However, the specific molecular mediators that translate gut–retina signals into retinal pathology remain largely uncharacterized, limiting the identification of reliable biomarkers and therapeutic targets.
The gut–retina axis delineates a complex bidirectional communication network between the intestinal microbiota and their metabolites with retinal tissues through immunological, metabolic, neuroendocrine, and vascular pathways, thereby modulating their homeostatic equilibrium6. Molecularly, the gut–retina axis is characterized by the dysregulation of key stress-responsive and cell-fate-determining proteins, specifically AP-1 and TP537,8,9. Besides, CMKLR1, a key chemokine receptor, emerges as a key mediator of endothelial dysfunction and metabolic dysregulation, establishing a critical link between gut microbiota alterations and diabetic retinopathy pathogenesis10. Importantly, Wnt signaling orchestrates dual regulatory roles in maintaining retinal vascular homeostasis and intestinal epithelial barrier function11, while PPAR signaling serves as a master regulator of inflammatory responses and metabolic processes across both ocular and intestinal tissues12,13. These molecular players collectively constitute an interconnected signaling network within the gut–retina axis, presenting novel mechanistic insights and therapeutic opportunities for diabetes-related complications. Targeting structural and functional alterations along this axis, therefore, represents a promising strategy for managing DR.
Traditional Chinese Medicine (TCM) has historically played a significant role in the treatment of diabetes and related retinopathy, with therapeutic decisions based on syndrome differentiation14. Qiming Granule (QMG), composed of Astragalus membranaceus, Pueraria lobata, Rehmannia glutinosa, Lycium barbarum, Senna obtusifolia, Leonurus japonicus, Typha angustifolia, and Whitmania pigra, is broadly applied in the treatment of DR. Approved by the National Medical Products Administration of China (Approval No. Z20090036), QMG has successfully completed clinical trials and received marketing authorization. QMG exhibits protective effects by preventing the thickening of the basement membrane in retinal capillaries, reducing damage to pericytes and retinal microvasculature, and maintaining the local pathological morphology of the eye15, making it a promising therapy for addressing DR. By targeting key proteins and inflammatory factors, QMG's active components exert anti-inflammatory, antioxidant, and anti-apoptotic effects, providing a mechanistic basis for its modulation of the gut–retina axis16. These properties provide a mechanistic basis for QMG’s potential modulation of the gut–retina axis, yet few studies have explored this link. Therefore, this study aims to validate the efficacy of QMG in modulating the gut–retina axis, providing experimental evidence for its therapeutic potential in DR.
This study bridges theoretical predictions with in vivo experimental data to validate the efficacy of QMG in modulating the gut–retina axis. These findings demonstrate that QMG ameliorates DR by coupling the CMKLR1‑centered regulatory network (including Wnt5a, PPAR-γ, AP-1, and TP53) with systemic inflammation via the gut–retina axis, positioning QMG as a promising gut–retina-targeted therapeutic strategy for DR. The graphical abstract is exhibited in Figure 1.
Protocol
All animal experiments were performed in compliance with the ARRIVE guidelines. The study was approved by the Ethics Review Committee of Sichuan Scientist Biotechnology Co., Ltd. (IACUC ISSUE SYST-2024-011). A detailed experimental timeline summarizing the study design is provided in Supplementary Figure 1.
Animal preparation and treatment
Mice were deeply anesthetized with 2% isoflurane inhalation. Under deep anesthesia, blood was collected via retro-orbital enucleation. Immediately after blood collection, eyeballs were enucleated for retinal tissue harvest. Subsequently, cervical dislocation was performed under deep anesthesia to ensure euthanasia. Colon tissues were then dissected immediately. Animals exhibiting adverse events were promptly removed from the study and received appropriate veterinary care.
Randomization and blinding
Male C57BL/6 mice, aged 5 weeks and weighing between 20 and 30 grams, were accommodated under strictly regulated conditions, including temperature and humidity. After one week of acclimatization, C57BL/6 mice were randomly assigned to three groups (blank, model, and intervention groups) using a computer-generated random number sequence. The randomization sequence was generated by an investigator not involved in animal handling or outcome assessment.
To ensure blinding, all animal care, drug administration, and data collection were performed by investigators unaware of group allocation. The coded group assignments were revealed only after the completion of all experiments and statistical analyses. The blinding applied to: the technician performing oral gavage; the pathologist evaluating retinal histology; and the analyst quantifying Western blot (WB) bands.
Sample size calculation
The sample size was determined based on a preliminary experiment evaluating retinal ganglion cell (RGC) counts under the same experimental conditions. Assuming a two-sided significance level (α) of 0.05 and a statistical power (1-β) of 0.80, a minimum of 5 mice per group was required to detect a clinically relevant difference in RGC counts between the model and intervention groups. Considering a potential dropout rate of approximately 20%, each group was set to include 6 mice.
Establishment of diabetic animals
The blank group received a standard diet, whereas the intervention and model groups were administered a high-fat, high-sugar diet (HFHSD) for a duration of four weeks. Following this dietary period, the intervention and model groups underwent intraperitoneal injection with a 1% Streptozotocin (STZ) solution at a dosage of 35 mg/kg17,18,19,20. After seventy-two hours of injection, mice exhibiting non-fasting blood glucose levels exceeding 16.7 mmol/L were considered to have successfully induced a DM model and were selected for further experimentation. The DM animals continued with the high-fat, high-sugar diet for an additional four months, whereas the blank group maintained their standard diet.
Taxonomic validation and quality assessment
The eight ingredients in QMG were taxonomically validated using the Modernized Plant Names Search (MPNS, http://mpns.kew.org/mpns-portal/). The quality of composition reporting for the QMG was evaluated using the ConPhYMP tool.
Administration methods
In the intervention group, the animals were orally administered QMG. QMG was purchased from Zhejiang Sansheng Mandi Pharmaceutical Co., Ltd. (Chinese National Drug Approval No. Z20090036). The QMG suspension was prepared by uniformly mixing QMG with distilled water. Mice in the intervention group were administered the suspension via oral gavage at an equivalent volume to the model and blank groups. The dosage was calculated based on the clinical single therapeutic dose of 4.5 g per 60 kg adult (the standard unit dose of the marketed formulation) using the body surface area (BSA) normalization method recommended by the FDA and Reagan-Shaw21. The conversion factor between adult humans (Km = 37) and mice (Km = 3) was 12.33, resulting in a mouse dose of 0.9 g/kg body weight. The model group and the blank group received an equivalent volume of saline via oral gavage. The administration was conducted daily between 9 AM and 11 AM for a consecutive period of 3 months.
Observation and testing indicators
General vital signs monitoring
The general vital signs and physiological indicators, including body weight, blood glucose levels, water and food consumption, urine output, activity levels and behavior, body temperature, as well as fur and skin condition, were systematically observed and recorded to comprehensively assess therapeutic interventions and detect potential complications.
Observation of morphological changes in the retina by HE staining analysis
All specimens were processed through an automatic dehydrator using a series of ethanol and xylene solutions after fixation, followed by embedding in paraffin. Subsequently, 4 µm paraffin sections were cut and stained with HE and then mounted with neutral gum. Retinal images were scanned using a 3DHISTECH Pannoramic SCAN scanner. Image analysis and data measurement were performed by Image-Pro Plus.
Detection of serum IL-6, TNF-α, and IL-1β by ELISA analysis
Blood samples were collected via retro‑orbital enucleation. Serum was separated by centrifugation at 1,000 × g for 15 min at 4 °C and stored at -80 °C until analysis. Serum levels of IL‑1β, IL‑6, and TNF‑α were measured according to standard procedures, including reagent equilibration, sample addition, incubation, washing, conjugate and substrate addition, reaction termination, optical density measurement, and concentration calculation based on a standard curve. The optical density was read at 450 nm using a microplate reader, and cytokine concentrations were calculated against standard curves.
Detection of the key regulatory proteins in retina and colon by WB analysis
Three independent biological replicates were conducted on a single membrane and sequentially probed for target proteins. All replicates were derived from a single cohort of animals sacrificed concurrently. When the molecular weight of a target protein was too close to that of GAPDH (<5 kDa difference), they were analyzed on independent membranes to prevent signal overlap. Each membrane was probed exclusively for either the target protein or GAPDH to ensure accurate quantification. The following primary antibodies were used: GAPDH polyclonal antibody (1:5000), CMKLR1 polyclonal antibody (1:1000), Wnt5a polyclonal antibody (1:1000), TP53 polyclonal antibody (1:1000), AP-1 monoclonal antibody (1:5000), and PPAR gamma (PPAR-γ) polyclonal antibody (1:1000). Total proteins were obtained by cell lysis followed by centrifugation. Protein concentrations were determined using the BCA assay. The extracted proteins were resolved by SDS-PAGE using a 12% separating gel and subsequently transferred onto membranes. The membranes were blocked in TBST containing 5% non-fat milk and incubated with the appropriate primary antibodies overnight at 4 °C. Following washing, the membranes were incubated with HRP-conjugated anti-rabbit or anti-mouse secondary antibodies at a dilution of 1:10,000. Finally, the protein bands were visualized and analyzed through chemiluminescence imaging. During visualization and data processing, blots were cropped horizontally to remove irrelevant molecular weight regions, and all sample lanes were retained without removal of inter-lane areas. Slight edge distortion may occur during cropping to remove irrelevant gel regions.
Detection of gut microbiota by 16S rDNA sequencing analysis
Fresh fecal samples were collected from each mouse prior to terminal procedures. Mice were placed individually in sterile cages for 10–15 min to allow spontaneous defecation. Fecal pellets were immediately collected with sterile forceps, transferred to sterile 1.5 mL tubes, snap-frozen in liquid nitrogen, and stored at -80 °C until DNA extraction. All procedures were performed under sterile conditions to minimize cross-contamination. The interval between defecation and freezing was maintained within 10 min to ensure microbial integrity. The fecal genomic DNA (gDNA) samples were purified using the Fecal gDNA extraction kit, followed by full-length 16S rDNA gene amplification via polymerase chain reaction (PCR) with universal primers 8F (5’-AGAGTTTGATCATGGCTCAG-3’) and 1492R (5’-CGGTTACCTTGTTACGACTT-3’). The PCR products were subsequently analyzed by agarose gel electrophoresis, purified, and quantified for downstream applications. High-throughput sequencing was conducted on the Nanopore GridION sequencer. The data analysis process included basecalling, data quality control, species annotation, phylogenetic tree construction, community analysis, Alpha and Beta diversity analysis, and differentially abundant species analysis and community function prediction. Various tools and databases, such as NanoFilt, Usearch, the R programming language, Python, and the SILVA database, were utilized during the analysis.
Correlation analysis of the gut–retina axis with systemic inflammation and multi-level gut Microbiota
To explore the potential associations between multi-level gut microbiota with serum inflammatory cytokines and key regulatory proteins, correlation analysis was performed by using the Luoning Bio-Cloud platform. Initially, the species abundance data at the Kingdom, Phylum, Class, Order, Family, Genus, and Species levels were extracted from the sequencing results. Physicochemical factors, including serum inflammatory cytokines and protein expression levels, were compiled into an environmental factor file. To ensure the reliability and visualization of the correlations, the data underwent normalization to eliminate the scale differences between microbial abundance and clinical measurement units. The correlation coefficients (R-values) and corresponding significance levels (P-values) were calculated. The results were visualized using a correlation heatmap, where color gradients indicate the strength and direction of the correlation (red representing positive correlation, blue representing negative correlation), and asterisks (**) denote statistical significance (P < 0.01).
Statistical methods
All statistical analyses and visualization were performed using GraphPad Prism. The t-test to compare means was employed for data that adhered to normal distribution. In cases where data deviated from normality, the Kruskal-Wallis test was used. Spearman's or Pearson's correlation was conducted for variable relationships. All statistical tests were conducted as two-tailed, with statistical significance set at 0.05.
Results
General situation of experimental animals
Blood glucose levels were significantly elevated in the model group (27.21 ± 6.03 mmol/L) compared with the blank group (P < 0.001), indicating the successful induction of the DM model. During the study period, the experimental animals showed stable body weight, continuous water and food intake, normal urine output, body temperature, healthy fur and skin condition, and normal behavior during the experiment.
Composition and validation of QMG
QMG, a proprietary Chinese medicine that passed Phase III clinical trials, encompasses Astragalus membranaceus (Fisch.) Bunge [Fabaceae, Astragali radix], Pueraria lobata (Willd.) Ohwi [Fabaceae, Puerariae lobatae radix], Rehmannia glutinosa (Gaertn.) Libosch. Ex Fisch. & C.A. Mey. [Orobanchaceae; Rehmanniae radix], Lycium barbarum L. [Solanaceae; Lycii fructus], Senna obtusifolia (L.) H.S. Irwin & Barneby [Fabaceae; Cassiae semen], Leonurus japonicus Houtt. [Lamiaceae, Leonuri herba], Typha angustifolia L. [Typhaceae; Typhae pollen], Whitmania pigra Whitman [Hirudinidae; Hirudo]15. The detailed information, including the Chinese name, scientific name by MPNS validation, species, family, part used, representative bioactive compounds, was summarized in Table 1, which defined the QMG and provided a transparent, scientifically grounded basis for the formulas under investigation.
| No. | Chinese name | Scientific name by MPNS validation | Species | Family | Part Used | Representative bioactive compounds | |||||||
| 1 | HuangQi | Astragalus membranaceus (Fisch.) Bunge [Fabaceae, Astragali radix] | Astragalus mongholicus (Fisch.) Bunge | Fabaceae | Radix | Astragaloside IV, Calycosin | |||||||
| 2 | GeGen | Pueraria lobata (Willd.) Ohwi [Fabaceae, Puerariae lobatae radix] | Pueraria lobata (Willd.) | Fabaceae | Radix | Puerarin, Daidzin | |||||||
| 3 | DiHuang | Rehmannia glutinosa (Gaertn.) Libosch. Ex Fisch. & C.A. Mey. [Orobanchaceae; Rehmanniae radix] | Rehmannia glutinosa (Gaertn.) Libosch. Ex Fisch. & C.A. Mey. | Orobanchaceae | Radix | Catalpol, Rehmannioside D | |||||||
| 4 | GouQiZi | Lycium barbarum L. [Solanaceae; Lycii fructus] | Lycium barbarum L. | Solanaceae | Fructus | Lycium barbarum polysaccharides, Betaine | |||||||
| 5 | JueMingZi | Senna obtusifolia (L.) H.S. Irwin & Barneby [Fabaceae; Cassiae semen] | Senna obtusifolia (L.) H.S. Irwin & Barneby | Fabaceae | Semen | Aurantio-obtusin, Emodin | |||||||
| 6 | Chong WeiZi | Leonurus japonicus Houtt. [Lamiaceae, Leonuri fructus] | Leonurus japonicus Houtt. | Lamiaceae | Fructus | Stachydrine, Leonurine | |||||||
| 7 | PuHuang | Typha angustifolia L. [Typhaceae; Typhae pollen] | Typha angustifolia L. | Typhaceae | Pollen | Isorhamnetin, Kaempferol | |||||||
| 8 | ShuiZhi | Whitmania pigra Whitman [Hirudinidae; Hirudo] | Whitmania pigra Whitman | Hirudinidae | Body | Hirudin, Calin | |||||||
Table 1: The composition and quality information of QMG ingredients. Detailed information on the composition and quality information of QMG ingredients, including the Chinese name, scientific name by MPNS validation, species, family, part used, and representative bioactive compounds.
QMG ameliorates the retinal morphology
As depicted in Figure 2A, the retina of the blank group exhibited a well-organized structure. The cellular arrangement was dense and orderly across all layers, with no evidence of structural disruption, exudation, or inflammatory infiltration. Compared with the blank group, retinal sections from the model group (Figure 2B) exhibited marked structural disorganization, characterized by disordered cellular arrangement, a significant reduction in RGC counts (P < 0.0001, Table 2, Figure 3A), and pronounced thinning of the total retinal thickness (P < 0.0001, Figure 3B). Notably, neovascular tufts penetrating the inner limiting membrane were observed (indicated by a red arrow), confirming successful establishment of the DR model. In contrast, the intervention group (Figure 2C) demonstrated significant attenuation of histopathological abnormalities relative to the model group, as evidenced by restoration of retinal laminar architecture, partial recovery of RGC numbers (P < 0.001, Table 2, Figure 3A), and reversal of retinal thinning (P < 0.01, Table 2, Figure 3B). These data provide strong evidence for QMG as an effective intervention for DR.
QMG attenuates systemic inflammatory response in DR
Compared with the blank group, the expression levels of IL-1β, IL-6, and TNF-α were significantly upregulated in the model group (P < 0.0001), confirming that the modeling procedure successfully induced a marked inflammatory response. Conversely, compared with the model group, the expression levels of IL-1β, IL-6, and TNF-α were significantly downregulated in the intervention group (p < 0.0001), indicating a potent inhibitory effect of QMG on systemic inflammation. The serum concentrations of IL-1β, IL-6, and TNF-α across the three groups are summarized in Table 3 and illustrated in Figure 4A–C.
QMG modulates the CMKLR1-centered regulatory network along the gut–retina axis
As shown in Figure 5, Figure 6, Figure 7, and Supplementary Figure 2, the results of this study showed that in DR model mice, the expression levels of five key regulatory proteins—AP-1, Wnt5a, CMKLR1, TP53, and PPAR-γ—exhibited a consistent downward trend in both colonic and retinal tissues. Following QMG intervention, the expression of these proteins showed varying degrees of recovery, with some proteins reaching statistical significance. Specifically, after QMG intervention, the expression of AP-1, Wnt5a, and CMKLR1 in colonic tissue was significantly higher than that in the model group (P < 0.05), while in retinal tissue, the expression of CMKLR1 and TP53 was significantly higher than that in the model group (P < 0.01). These findings may suggest that AP-1 and Wnt5a are more sensitive responders in the colon, whereas TP53, as an apoptosis regulator, plays a more critical role in retinal neuroprotection. Notably, CMKLR1 was the only protein that achieved significant recovery in both tissues, indicating that QMG may facilitate bidirectional communication along the gut–retina axis through systemic regulation of CMKLR1 expression.
The consistent directionality of expression changes for these five proteins in both colonic and retinal tissues holds important biological significance. As the primary habitat of the gut microbiota, changes in colonic protein expression reflect the state of the intestinal microenvironment, while the retina is the effector organ of DR. The consistency of expression patterns between these two tissues strongly supports the gut–retina axis as an important participant in the pathophysiological processes of DR.
QMG restores and improves the composition, diversity, and function of gut microbiota
The results of the community composition
Hierarchical clustering analysis revealed distinct shifts in gut microbial composition and clustering at multiple taxonomic levels following QMG intervention. At the phylum level (Figure 8A), the model group exhibited a marked reduction in Firmicutes abundance and a significant enrichment of Bacteroidetes compared with the blank group, indicating a diabetes-driven shift in the Firmicutes/Bacteroidetes ratio; notably, the intervention restored the proportions of both Firmicutes and Bacteroidetes to levels approaching those of the blank group, accompanied by an elevated relative abundance of Proteobacteria. At the class level (Figure 8B), the model group manifested an elevation in Bacteroidia and Clostridia and a lessening in Bacilli and Erysipelotrichia compared with the blank group; in contrast, the intervention group showed restoration in Bacteroidia and Erysipelotrichia to levels approaching those of the blank group, accompanied by elevated relative abundance of Clostridia and Alphaproteobacteria. At the order level (Figure 8C), the model group demonstrated an elevated proportion of Bacteroidales, and a decreased proportion of Erysipelotrichales and Lactobacillales compared with the blank group; conversely, the intervention group restored the proportions of Bacteroidales and Erysipelotrichales to levels approaching those of the blank group, accompanied by an elevated relative abundance of Clostridiales. At the family level (Figure 8D), the model group presented a growth in Odoribacteraceae, Peptostreptococcaceae, Rikenellaceae, and Tannerellaceae, and a decrease in Erysipelotrichaceae, Lactobacillaceae, Muribaculaceae, and Ruminococcaceae compared with the blank group; in contrast, the intervention group downregulated the proportions of Odoribacteraceae and Peptostreptococcaceae compared with the model group; restored the proportions of Erysipelotrichaceae and Ruminococcaceae to levels approaching those of the blank group, accompanied by an elevated relative abundance of Lachnospiraceae. At the genus level (Figure 8E), the model group exhibited an upward trend in Odoribacter, Paeniclostridium, Alistipes, Parabacteroides, and Clostridioides, and a decrease trend in Lactobacillus, Faecalibaculum, Ruminococcus, Bacteroides, and Muribaculum compared with the blank group; notably, the intervention group downregulated the proportions of Odoribacter, Clostridioides, and Paeniclostridium compared with the model group; restored the proportions of Faecalibaculum and Ruminococcus to levels approaching those of the blank group; and increased the relative abundance of Lachnoclostridium, Sphingomonas, Flavonifractor, and Blautia. At the species level (Figure 8F), the model group showed an increase in Odoribacter splanchnicus, Clostridioides difficile, and Paeniclostridium sordellii, and a decrease in Faecalibaculum rodentium, Bacteroides salanitronis, Muribaculum intestinale compared with the blank group; in contrast, the intervention group downregulated the proportion of Odoribacter splanchnicus and Clostridioides difficile compared with the model group; restored the proportions of Faecalibaculum rodentium, and Muribaculum intestinale, accompanied by elevated relative abundance of Lachnoclostridium phocaeense, and Flavonifractor plautii. Collectively, these findings indicate that QMG restored gut microbial composition across multiple taxonomic levels, shifting the community structure toward a homeostatic state.
The results of the Alpha diversity and Beta diversity
As indicated by the Alpha diversity results (Figure 9A), the intervention group exhibited the highest Chao1, PD, Simpson, and Shannon indices, while the model group displayed the lowest, with the blank group showing intermediate levels. These findings underscore the detrimental impact of DR on gut microbiota diversity and demonstrate that QMG intervention effectively restores and enhances microbial richness and evenness in DR mice.
As indicated by the Beta diversity representative results (Figure 9B,C), the principal coordinates analysis (PCoA) plots revealed a distinct separation of microbial communities across the three groups, which was statistically supported by the Permutational Multivariate Analysis of Variance (PERMANOVA). Specifically, the Bray-Curtis-based analysis indicated a significant structural divergence (PERMANOVA: R2 = 0.67, P < 0.001), suggesting that the DR model and QMG intervention accounted for a substantial proportion of the variation in microbial community composition. Consistent with this, the analysis based on Weighted unique fraction (UniFrac) distance, which incorporates phylogenetic relationships between taxa, further confirmed the significant community shift (PERMANOVA: R2 = 0.58, P < 0.01).
As displayed by the Beta diversity results (Figure 9D), the non-metric multidimensional scaling (NMDS) ordination plot demonstrated a clear spatial clustering of samples according to the respective groups, with a stress value of 0.04. Given that a stress value below 0.05 is generally considered to represent an excellent representation of the community structure in a reduced-dimensional space, these results collectively suggest that the QMG intervention significantly altered the global composition of the gut microbiota.
The results of the differential abundance analysis
According to the linear discriminant analysis effect size (LEfSe) analysis (Figure 9E), the results revealed that Clostridia, Clostridiales, Lachnospiraceae, and Lachnoclostridium were remarkably enriched in the intervention group, whereas Odoribacteraceae, Odoribacter, Peptostreptococcaceae, and Paeniclostridium were notably enriched in the model group. Therefore, the above gut microbiota might be the primary differential microbiota responsible for the intergroup differences between the model and intervention groups.
The results of community function prediction
The predicted functional profiles at Level 2 and Level 3 showed distinct clustering patterns across the three groups (Figure 9F,G). Specifically, compared with the blank group, the model group exhibited a significant deviation in the relative abundance of metabolic pathways. Notably, this functional perturbation in the model group was largely ameliorated in the intervention group. The functional composition of the intervention group showed a substantial shift back towards the profile observed in the blank group, indicating that the QMG intervention effectively modulated the gut microbial functional structure. These results suggest that the intervention not only reshaped the taxonomic composition and structure of the gut microbiota but also restored its functional metabolic capacity toward a homeostatic state.
QMG modulates the gut–retina axis by coupling systemic inflammation and key regulatory proteins
Associations at global levels
At the kingdom level (Figure 10A–C), QMG improved the CMKLR1-centered network mainly by modulating Bacteria along the gut-retina axis. Specifically, Bacteria positively correlated with retinal PPAR-γ in the blank group (P < 0.01), but this association was not observed in the model group. Following QMG intervention, bacterial abundance positively correlated with retinal CMKLR1 and Wnt5a yet negatively correlated with colonic TP53 and PPAR-γ (P < 0.01).
At the phylum level (Figure 10D–F), QMG improved the CMKLR1-centered network mainly by modulating Candidatus and Bacteroidetes along the gut-retina axis. Specifically, the positive correlation between Candidatus and colonic CMKLR1 observed in the blank group was lost following DR induction, but was restored by QMG intervention, which was accompanied by a negative correlation with serum IL-1β and TNF-α, while positively correlated with retinal PPAR-γ, AP-1, TP53, colonic AP-1, and serum IL-6 (P < 0.01). Proteobacteria in the model group negatively correlated with colonic CMKLR1 (P < 0.01), a trend that persisted following QMG intervention. Meanwhile, Firmicutes were positively correlated with retinal CMKLR1 in the model group, whereas Bacteroidetes and Tenericutes were negatively correlated with retinal CMKLR1 (P < 0.01). Following QMG intervention, Bacteroidetes shifted to positive correlations with retinal PPAR-γ, AP-1, TP53, and colonic CMKLR1 (P < 0.01). Additionally, Actinobacteria positively correlated with retinal CMKLR1 and Wnt5a (P < 0.01).
At the class level (Figure 10G–I), QMG improved the CMKLR1-centered network mainly by regulating Cytophagia and Bacteroidia along the gut-retina axis. Specifically, Cytophagia and Chitinophagia negatively correlated with retinal CMKLR1 in the blank group (P < 0.01). In the model group, Cytophagia, Bacteroidia, and Mollicutes negatively correlated with retinal CMKLR1, while colonic CMKLR1 positively correlated with Flavobacteriia and Epsilonproteobacteria, yet negatively with Tissierellia, Alphaproteobacteria, Clostridia, and Bacilli (P < 0.01). Following QMG intervention, Bacteroidia and Cytophagia positively correlated with colonic CMKLR1, retinal PPAR-γ, AP-1, TP53, colonic AP-1 and serum IL-6, whereas Mollicutes, Deltaproteobacteria, Alphaproteobacteria, and Gammaproteobacteria showed the opposite pattern (P < 0.01). Moreover, Chlamydiia, Actinobacteria, Tissierellia, Bacilli, and Negativicute negatively correlated with retinal CMKLR1 and Wnt5a, while Coriobacteriia exhibited the reverse correlation (P < 0.01).
At the order level (Figure 10J–L), QMG improved the CMKLR1-centered network mainly by modulating Bacteroidales, Bacillales, and Clostridiales along the gut–retina axis. Specifically, Cytophagales and Chitinophagales negatively correlated with retinal CMKLR1, whereas Marinilabiliales positively correlated with colonic CMKLR1 in the blank group (P < 0.01). In the model group, Mycoplasmatales, Cytophagales, Bacteroidales, and Marinilabiliales negatively correlated with retinal CMKLR1, while colonic CMKLR1 positively correlated with Flavobacteriales and Campylobacterales, yet negatively with Tissierellales, Bacillales, Sphingomonadales, Clostridiales, and Lactobacillales (P < 0.01). Following QMG intervention, Bacteroidales and Clostridiales positively correlated with colonic CMKLR1, AP-1, retinal PPAR-γ, AP-1, TP53, and serum IL-6, whereas Desulfovibrionales, Rhizobiales, Sphingomonadales, and Enterobacterales showed the opposite pattern (P < 0.01). Moreover, Eggerthellales and Coriobacteriales positively correlated with retinal CMKLR1 and Wnt5a, yet negatively with colonic TP53 and PPAR-γ, whereas Chlamydiales, Thermoanaerobacterales, Corynebacteriales, Tissierellales, and Bacillales exhibited the reverse correlation (P < 0.01).
Associations at Fine levels
At the family level (Figure 11A–C), QMG improved the CMKLR1-centered network primarily by modulating Lachnospiraceae, Bacteroidaceae, and Lactobacillaceae along the gut–retina axis. Specifically, Ruminococcaceae negatively correlated with retinal CMKLR1, whereas Lachnospiraceae positively correlated with retinal CMKLR1 in the blank group (P < 0.01). In the model group, Peptostreptococcaceae positively correlated with retinal CMKLR1, while Tannerellaceae, Bacteroidaceae, Odoribacteraceae, and Lachnospiraceae showed the opposite pattern (P < 0.01). Meanwhile, colonic CMKLR1 positively correlated with Marinilabiliaceae, Rikenellaceae, and Flavobacteriaceae, yet negatively with Lachnospiraceae and Lactobacillaceae (P < 0.01). Following QMG intervention, Enterobacteriaceae, Sphingomonadaceae, and Oscillospiraceae negatively correlated with colonic CMKLR1, AP-1, and serum IL-6, as well as retinal PPAR-γ, AP-1, and TP53, while positively correlating with serum IL-1β and TNF-α, whereas Peptococcaceae, Bacteroidaceae, Muribaculaceae, and Rikenellaceae showed the opposite pattern (P < 0.01). Moreover, Veillonellaceae, Peptostreptococcaceae, Lactobacillaceae, and Ruminococcaceae negatively correlated with retinal CMKLR1 and Wnt5a, yet positively with colonic TP53 and PPAR-γ, whereas Eggerthellaceae, Lachnospiraceae, and Hungateiclostridiaceae exhibited the reverse correlation (P < 0.01).
At the genus level (Figure 11D–F), QMG improved the CMKLR1-centered network primarily by modulating Lachnoclostridium, Clostridioides, and Bacteroides along the gut–retina axis. Specifically, Ruminococcus negatively correlated with retinal CMKLR1, whereas Lachnoclostridium showed the opposite pattern in the blank group (P < 0.01). In the model group, Lactobacillus and Sphingomonas negatively correlated with colonic CMKLR1, while Alistipes and Croceibacter positively correlated with colonic CMKLR1 (P < 0.01). Meanwhile, retinal CMKLR1 positively correlated with Paeniclostridium and Clostridioides, yet negatively with Mucinivorans, Intestinimonas, Flavonifractor, Parabacteroides, Bacteroides, Odoribacter, and Lachnoclostridium (P < 0.01). Following QMG intervention, Sphingomonas and Oscillibacter negatively correlated with colonic CMKLR1, AP-1, and serum IL-6, as well as retinal PPAR-γ, AP-1, and TP53, while positively correlating with serum IL-1β and TNF-α, whereas Bacteroides, Muribaculum, and Alistipes showed the opposite pattern (P < 0.01). Moreover, Dialister, Flavonifractor, Clostridioides, Ruminococcus, and Paeniclostridium negatively correlated with retinal CMKLR1 and Wnt5a, yet positively with colonic TP53 and PPAR-γ, whereas Pseudoclostridium, Lachnoclostridium, and Blautia exhibited the reverse correlation (P < 0.01).
At the species level (Figure 11G–I), QMG improved the CMKLR1-centered network primarily by modulating Clostridioides difficile, Alistipes shahii, and Paeniclostridium sordellii along the gut–retina axis. Specifically, Ruminococcus bicirculans and endosymbiont 'TC1' of Trimyema compressum negatively correlated with retinal CMKLR1, whereas Lactobacillus fermentum and Lactobacillus helveticus displayed the opposite pattern in the blank group (P < 0.01). In the model group, Croceibacter atlanticus, Alkalitalea saponilacus, Alistipes finegoldii, and Alistipes shahii positively correlated with colonic CMKLR1, while Sphingomonas panacis, Paeniclostridium sordellii, Clostridioides difficile, and Lactobacillus murinus positively correlated with retinal CMKLR1, yet Odoribacter splanchnicus, Mucinivorans hirudinis, Lachnoclostridium phocaense, Flavonifractor plautii, and Intestinimonas butyriciproducens showed the opposite pattern (P < 0.01). Following QMG intervention, Alistipes shahii and Muribaculum intestinale positively correlated with colonic CMKLR1, AP-1, and serum IL-6, as well as retinal PPAR-γ, AP-1, and TP53, while negatively correlating with serum IL-1β and TNF-α, whereas Sphingomonas panacis, Oscillibacter sp. PEA192, and Oscillibacter valericigenes exhibited the reverse pattern (P < 0.01). Moreover, Pseudoclostridium thermosuccinogenes, Lachnoclostridium phocaense, Bacteroides salanitronis, and Blautia sp. N6H1-15 positively correlated with retinal CMKLR1 and Wnt5a, yet negatively with colonic TP53 and PPAR-γ, whereas Paeniclostridium sordellii, Flavonifractor plautii, endosymbiont 'TC1' of Trimyema compressum, Clostridioides difficile, and Dialister pneumosintes showed the reverse correlation (P < 0.01). The detailed correlation results at kingdom, phylum, class, order, family, genus, and species levels are presented in Supplementary File 1.
DATA AVAILABILITY:
The 16S rDNA sequencing datasets generated and analyzed during the current study are available in the National Center for Biotechnology Information (NCBI) Sequence Read Archive (SRA) repository under the BioProject accession number: PRJNA1281561. All other data generated or analyzed during this study are included in this article.
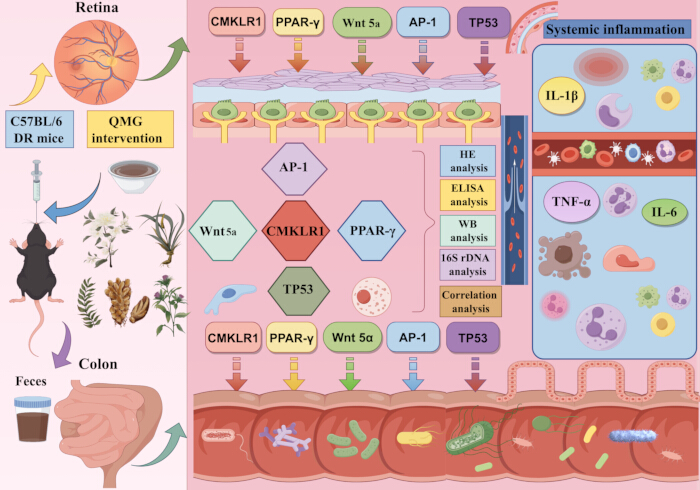
Figure 1: Graphical abstract. The graphical abstract shows the process of this study. Please click here to view a larger version of this figure.
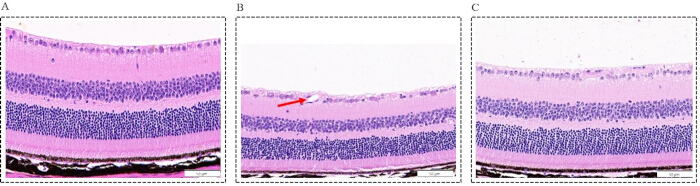
Figure 2: Morphological changes in the retina across the three groups (Scale bar = 50 µm, Magnification: ×400). (A) Blank group: representative photomicrographs of hematoxylin-eosin (HE)-stained retinal sections, showing an intact, well-organized retinal architecture with neatly arranged cellular layers; (B) Model group: representative photomicrographs of HE-stained retinal sections, showing marked structural disorganization, characterized by disordered cellular arrangement, a significant reduction in retinal ganglion cell (RGC) counts (P < 0.0001), pronounced thinning of the retinal thickness (P < 0.0001), and neovascular tufts penetrating the inner limiting membrane (indicated by a red arrow); (C) Intervention group: representative photomicrographs of HE-stained retinal sections, showing significant attenuation of histopathological abnormalities relative to the model group, as evidenced by restoration of retinal laminar architecture, partial recovery of RGC numbers (P < 0.001), and restoration of retinal thinning (P < 0.01). Please click here to view a larger version of this figure.
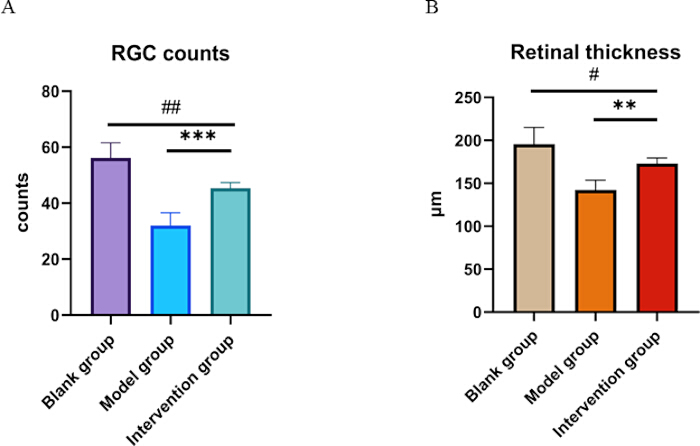
Figure 3: Histological quantification of RGC counts and retinal thickness. (A) Quantification of RGC counts in the ganglion cell layer. (B) Measurement of total retinal thickness (µm). Data are shown as mean ± SD (n = 6 per group). Compared with the blank group: #P <0.05, ##P <0.01; compared with the model group: **P <0.01, ***P <0.001. Please click here to view a larger version of this figure.
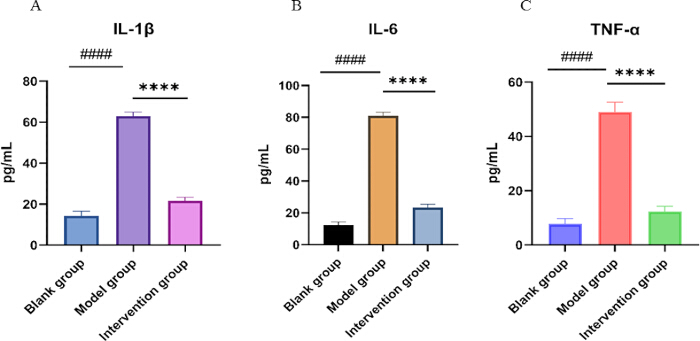
Figure 4: Serum concentrations of inflammatory cytokines in the three groups. Bar charts showing ELISA‑based quantification of serum IL‑1β (A), IL‑6 (B), and TNF‑α (C) levels in the blank control, model group, and intervention groups. Data are expressed as mean ± SD (n = 6 per group). Compared with the blank group: ####P < 0.0001; compared with the model group: ****P < 0.0001. Please click here to view a larger version of this figure.
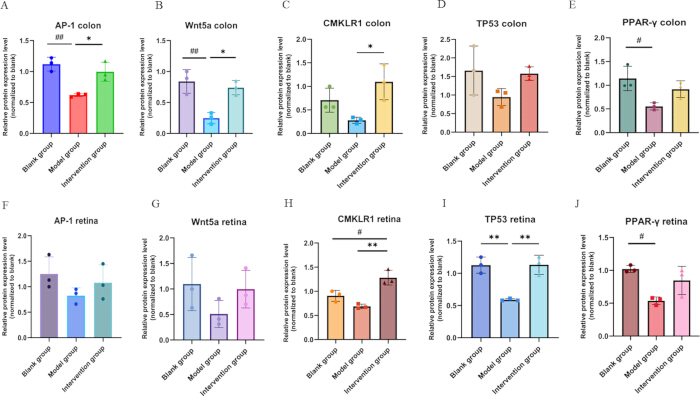
Figure 5: Bar chart of the expression levels of key regulatory proteins in the retina and colon. (A) Relative protein expression level (normalized to blank) of AP-1 in the colon (n = 3); (B) Relative protein expression level (normalized to blank) of Wnt5a in the colon (n = 3); (C) Relative protein expression level (normalized to blank) of CMKLR1 in the colon (n = 3); (D) Relative protein expression level (normalized to blank) of TP53 in the colon (n = 3); (E) Relative protein expression level (normalized to blank) of PPAR-γ in the colon (n = 3); (F) Relative protein expression level (normalized to blank) of AP-1 in the retina (n = 3); (G) Relative protein expression level (normalized to blank) of Wnt5a in the retina (n = 3); (H) Relative protein expression level (normalized to blank) of CMKLR1 in the retina (n = 3); (I) Relative protein expression level (normalized to blank) of TP53 in the retina (n = 3); (J) Relative protein expression level (normalized to blank) of PPAR-γ in the retina (n = 3). Compared with the blank group: #P < 0.05, ##P < 0.01; compared with the model group: *P < 0.05, **P < 0.01. Please click here to view a larger version of this figure.
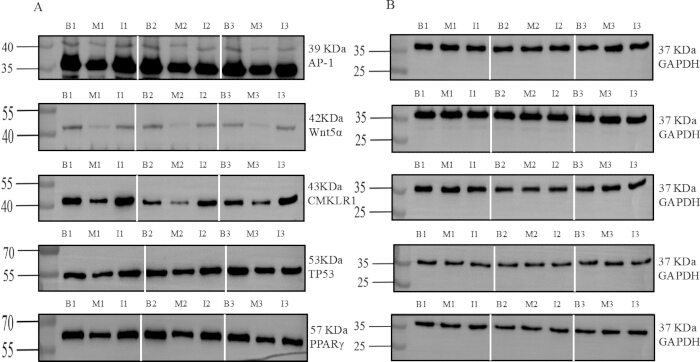
Figure 6: Representative WB grayscale blots of key regulatory proteins in the colon. (A) Target protein expression: AP-1, Wnt5a, CMKLR1, TP53, and PPAR-γ; (B) Loading control: GAPDH. Vertical white lines separate replicate sets (Rep1, Rep2, Rep3); Molecular weight markers (kDa) are indicated on the left, and protein names with corresponding kDa are shown on the right. Lanes are labeled as: B1 (Blank group 1), M1 (Model group 1), I1 (Intervention group 1); B2 (Blank group 2), M2 (Model group 2), I2 (Intervention group 2); B3 (Blank group 3), M3 (Model group 3), I3 (Intervention group 3). Full-length, uncropped Western blot (WB) images with visible molecular weight markers have been provided as Supplementary Figure 2. Please click here to view a larger version of this figure.
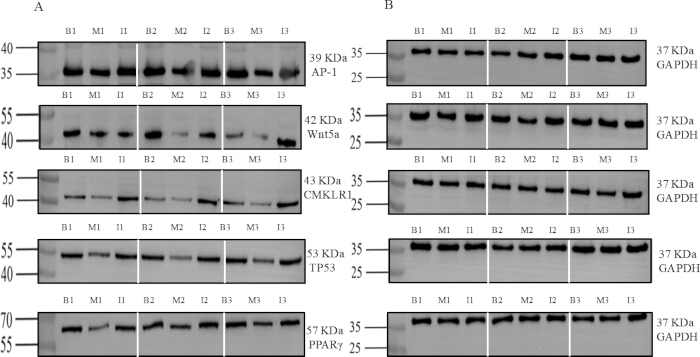
Figure 7: Representative WB grayscale blots of key regulatory proteins in the retina. (A) Target protein expression: AP-1, Wnt5a, CMKLR1, TP53, and PPAR-γ; (B) Loading control: GAPDH. Vertical white lines separate replicate sets (Rep1, Rep2, Rep3); Molecular weight markers (kDa) are indicated on the left, and protein names with corresponding kDa are shown on the right. Lanes are labeled as: B1 (Blank group 1), M1 (Model group 1), I1 (Intervention group 1); B2 (Blank group 2), M2 (Model group 2), I2 (Intervention group 2); B3 (Blank group 3), M3 (Model group 3), I3 (Intervention group 3). Full-length, uncropped WB images with visible molecular weight markers have been provided as Supplementary Figure 2. Please click here to view a larger version of this figure.
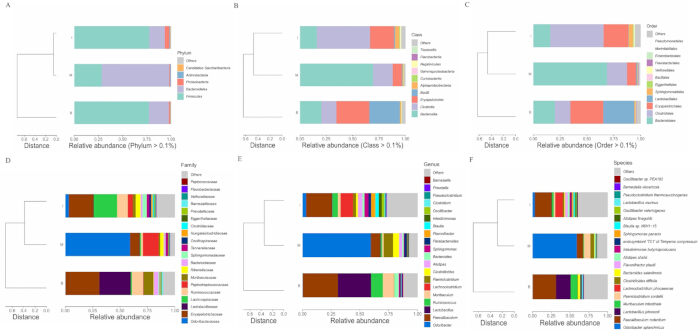
Figure 8: Hierarchical clustering of gut microbiota composition at different levels. Hierarchical clustering dendrogram based on Bray-Curtis dissimilarity among the blank control (B), model group(M), and intervention group (I). The branch length represents the degree of structural divergence. Stacked bar chart depicting the relative abundances of dominant phyla across the three groups. Phyla falling below the threshold are aggregated as “Others”. (A) Qiming granule (QMG) rebalances the gut microbiota composition at the phylum level; (B) QMG rebalances the gut microbiota composition at the class level; (C) QMG rebalances the gut microbiota composition at the order level; (D) QMG rebalances the gut microbiota composition at the family level; (E) QMG rebalances the gut microbiota composition at the genus level; (F) QMG rebalances the gut microbiota composition at the species level. Abbreviation: B, blank group; M, model group; I, intervention group. Please click here to view a larger version of this figure.
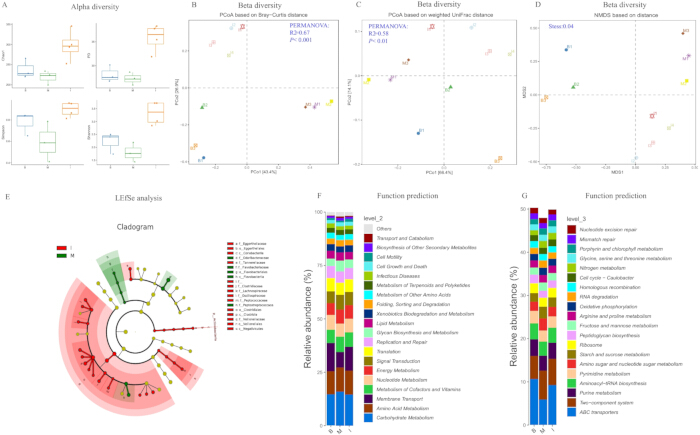
Figure 9: Analysis of gut microbiota diversity, differential abundance, and predicted functional pathways. (A) Alpha diversity analysis assessed by Chao1, PD, Simpson, and Shannon indices revealed that the intervention group exhibited higher microbial diversity than the model group, indicating that QMG treatment effectively restores gut microbial richness and evenness. (B) Beta diversity analysis assessed by principal coordinates analysis (PCoA) based on Bray-Curtis distance revealed significant differences among groups (PERMANOVA: R2=0.67, P < 0.001), indicating that the DR model and QMG intervention accounted for a substantial proportion of the variation in microbial community composition. (C) Beta diversity analysis assessed by PCoA based on weighted unique fraction (UniFrac) distance further confirmed the significant community shift (PERMANOVA: R2= 0.58, P < 0.01). (D) Beta diversity analysis assessed by non-metric multidimensional scaling (NMDS) ordination demonstrated a stress value of 0.04, suggesting that the QMG intervention significantly altered the global composition of the gut microbiota. (E) Cladogram of differential abundance analysis assessed by linear discriminant analysis effect size (LEfSe) revealed the primary differential microbiota between the model and intervention groups. Functional prediction of the gut microbiota at KEGG Level 2 (F) and KEGG Level 3 (G) suggested that the intervention not only reshaped the taxonomic composition and structure of the gut microbiota but also restored its functional metabolic capacity toward a homeostatic state. Please click here to view a larger version of this figure.
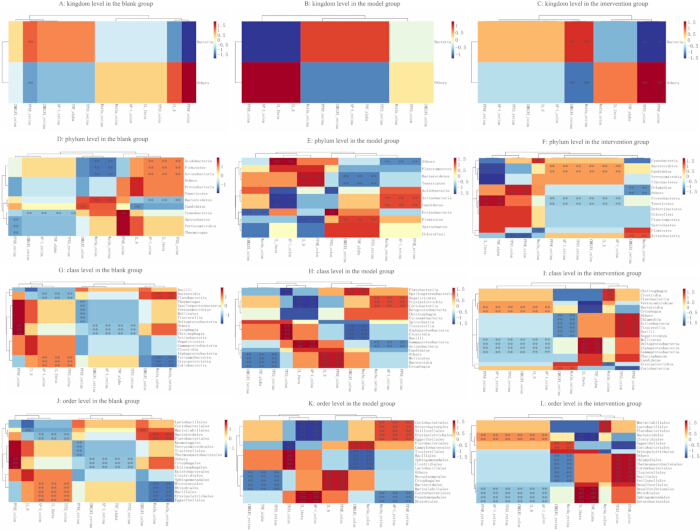
Figure 10: Global association of gut microbiota with inflammatory and regulatory factors. (A) Association of gut microbiota at kingdom level in the blank group; (B) Association of gut microbiota at kingdom level in the model group; (C) Association of gut microbiota at kingdom level in the intervention group; (D) Association of gut microbiota at phylum level in the blank group; (E) Association of gut microbiota at phylum level in the model group; (F) Association of gut microbiota at phylum level in the intervention group; (G) Association of gut microbiota at class level in the blank group; (H) Association of gut microbiota at class level in the model group; (I) Association of gut microbiota at class level in the intervention group; (J) Association of gut microbiota at order level in the blank group; (K) Association of gut microbiota at order level in the model group; (L) Association of gut microbiota at order level in the intervention group. Please click here to view a larger version of this figure.
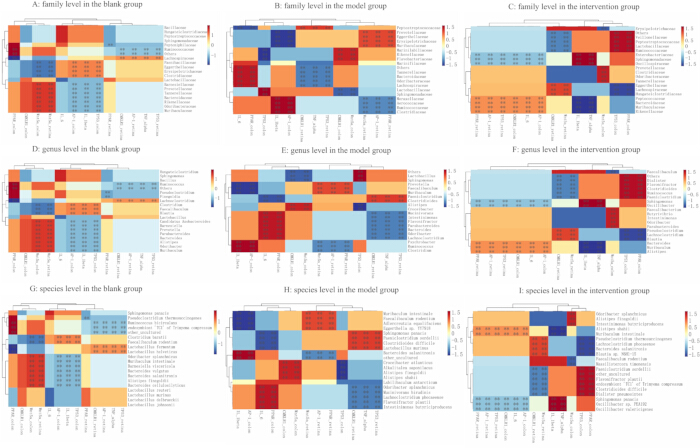
Figure 11: Fine association of gut microbiota with inflammatory and regulatory factors. (A) Association of gut microbiota at the family level in the blank group; (B) Association of gut microbiota at the family level in the model group. (C) Association of gut microbiota at family level in the intervention group; (D) Association of gut microbiota at genus level in the blank group; (E) Association of gut microbiota at genus level in the model group; (F) Association of gut microbiota at genus level in the intervention group; (G) Association of gut microbiota at species level in the blank group; (H) Association of gut microbiota at species level in the model group;(I) Association of gut microbiota at species level in the intervention group. Please click here to view a larger version of this figure.
| Groups (n = 6) | RGCs counts | Retinal thickness |
| Blank group | 56.17 ± 5.382 | 195.50 ± 19.54 μm |
| Model group | 32.00 ± 4.561#### | 142.30 ± 11.34 μm#### |
| Intervention group | 45.33 ± 2.066 ##*** | 173.00 ± 6.575 μm#** |
| p | <0.0001 | <0.0001 |
Table 2: Quantitative analysis of RGC counts and retinal thickness in the three experimental groups. Data are presented as Mean ± SD (n = 6 per group). Compared with the blank group: #P <0.05, ##P <0.01, ####P <0.0001; compared with the model group: **P <0.01, ***P <0.001.
| Groups (n = 6) | IL-1β | IL-6 | TNF-α |
| Blank group | 14.31 ± 2.28 | 12.48 ± 1.774 | 7.728 ± 2.048 |
| Model group | 62.88 ± 2.01#### | 80.95 ± 2.247#### | 49.00 ± 3.647#### |
| Intervention group | 21.7 ± 1.654**** | 23.27 ± 2.074**** | 12.35 ± 1.891**** |
| P | <0.0001 | <0.0001 | <0.0001 |
Table 3: Serum expression levels of IL-1β, IL-6, and TNF-α in the three experimental groups. Data are presented as Mean ± SD (n = 6 per group). Cytokine concentrations were determined by enzyme‑linked immunosorbent assay (ELISA) and are reported in pg/mL. Compared with the blank group: ####P < 0.0001; compared with the model group: ****P < 0.0001.
Supplementary Figure 1: Experimental Design and Study Timeline. Schematic overview of the experimental design.Please click here to download this file.
Supplementary Figure 2: Original, full-length, uncropped WB images corresponding to Figure 6 and Figure 7. Raw images without modification contain all molecular weight markers in colon and retina blots for AP-1, Wnt5a, TP53, CMKLR1, PPAR-γ, and loading control GAPDH. Molecular weight markers (kDa) are indicated. Lanes are labeled: B1 (Blank group 1), M1 (Model group 1), I1 (Intervention group 1); B2 (Blank group 2), M2(Model group 2), I2 (Intervention group 2); B3 (Blank group 3), M3 (Model group 3), I3 (Intervention group 3). The original blots were not subjected to high-contrast adjustments.Please click here to download this file.
Supplementary File 1: Detailed correlation analyses of gut microbiota with inflammatory and regulatory factors.Please click here to download this file.
Discussion
Diabetic retinopathy (DR) is a complex neurovascular complication driven by chronic hyperglycemia, inflammation, and metabolic dysregulation22. The American Academy of Ophthalmology categorizes DR into non-proliferative DR and proliferative DR, characterized by the onset of neovascularization23. Given the limitations of current therapeutic strategies, exploring novel mechanisms has emerged as a promising direction for addressing DR. Notably, recent breakthroughs have identified the gut–retina axis as a critical, yet underexploited, therapeutic target for DR. The gut–retina axis, which was first introduced and described by Sheldon Rowan in 20176, has gained popularity in the pathophysiological processes of ocular disease. However, the specific molecular mechanisms underlying the role of the gut–retina axis in the pathogenesis and progression of DR remain unclear, which hinders the development and clinical application of therapeutic strategies targeting this axis.
In this study, we systematically evaluated the efficacy and underlying mechanisms of QMG against DR. These findings provide preliminary evidence that QMG alleviates retinal histopathological damage, suppresses systemic inflammation, restores gut microbiota homeostasis, and bidirectionally modulates key regulatory proteins (the CMKLR1-centered regulatory network) in both the colon and retina, thereby establishing QMG as a potential modulator of the gut–retina axis. Chronic, low-grade systemic inflammation is a hallmark of DM and a major driver of retinal microvascular damage and DR progression24. The ELISA results demonstrated that serum levels of IL-1β, IL-6, and TNF-α were significantly elevated in DR model mice (P < 0.0001), confirming the presence of a robust systemic inflammatory response in the DR state. Uncontrolled release of these cytokines can disrupt the blood-retinal barrier, promote RGC apoptosis, and drive pathological neovascularization. Following QMG intervention, the levels of these cytokines were significantly downregulated (P < 0.0001), while retinal structural integrity was restored, RGC survival was increased, and retinal thickness was preserved. These results indicate that the retinal protective effects of QMG are closely associated with its potent systemic anti-inflammatory activity. Notably, this systemic anti-inflammatory effect does not occur in isolation but is coupled with QMG-mediated modulation of the gut microbiota and restoration of key regulatory proteins in the colon, suggesting that QMG may exert its therapeutic effects through a “gut-systemic inflammation-retina” axis.
To further elucidate the molecular mechanism by which QMG exerts its anti-DR effects along the gut–retina axis, the protein expression of the CMKLR1-centered regulatory network (including CMKLR1, Wnt5a, TP53, AP-1, and PPAR-γ) was examined in both colonic and retinal tissues. The results showed that after DR model induction, all five proteins exhibited a consistent downward trend in both the colon and retina, suggesting that signal communication between the gut and retina may be systemically blocked under DR conditions. Following QMG intervention, CMKLR1 was significantly upregulated in both the colon and retina (P < 0.05 and P < 0.01), indicating that QMG may restore bidirectional communication along the gut–retina axis through systemic activation of CMKLR1. In addition, QMG significantly restored the expression of AP-1 and Wnt5a in the colon, as well as TP53 expression in the retina, suggesting that different proteins may play tissue-specific functional roles along the axis: AP-1 and Wnt5a are more sensitive responders to QMG in the colon, while TP53, as an apoptosis regulator, plays a more critical role in retinal neuroprotection. Further correlation analysis revealed that colonic expression of AP-1, CMKLR1, PPAR-γ, and Wnt5a was significantly negatively correlated with systemic inflammatory cytokine levels (IL-1β, IL-6, TNF-α) (P < 0.05 to P < 0.001), whereas no direct correlation was observed between serum cytokines and retinal protein expression. This discrepancy carries important mechanistic implications: QMG may act primarily on the gut microenvironment by restoring the expression of key regulatory proteins in the colon, thereby suppressing systemic inflammation; the recovery of retinal proteins, in contrast, may be achieved through indirect pathways, such as the translocation of gut microbiota-derived metabolites into the circulation, which then remotely regulate retinal signaling cascades, rather than being directly mediated by systemic inflammatory factors. This finding supports a “gut-systemic inflammation-retina” axial regulatory model and provides key mechanistic evidence for the therapeutic effect of QMG on DR through the gut–retina axis. Among the investigated targets, CMKLR1 exhibited significant alterations in both retinal and colonic tissues, emerging as a potential primary biomarker linking the gut–retina axis. CMKLR1 has been implicated in glycolipid metabolism, DR severity, and gut microbiota modulation in previous studies25,26,27,28,29,30, suggesting that its differential expression along the gut–retina axis may reflect its involvement in multiple pathological processes. These findings position CMKLR1 as a promising candidate biomarker for DR diagnosis and therapeutic intervention, warranting further mechanistic validation.
While CMKLR1 functions as a central node in the gut–retina axis, the therapeutic effect of QMG is achieved through a multi-dimensional regulatory network in which Wnt5a, TP53, AP-1, and PPAR-γ provide essential synergistic support. Wnt signaling is critical for intestinal epithelial homeostasis and colonic health, including its roles in epithelial integrity, inflammation modulation, and microbiota-mediated mucosal protection31,32,33,34. PPAR-γ regulates inflammatory responses and has been shown to inhibit lipid-activated phagocytes in DR and promote photoreceptor survival via microglial modulation35,36,37. AP-1 serves as a transcription factor through which gut microbial metabolites, such as deoxycholic acid, influence inflammatory and immune homeostasis38,39,40,41. TP53 is involved in autophagy, apoptosis, and retinal neuronal injury under hyperglycemic conditions42,43,44,45. Collectively, these signaling nodes form an interconnected network that links gut microbial dynamics to retinal pathology, prompting us to investigate whether QMG modulates this network along the gut–retina axis.
A pivotal mechanism by which systemic inflammation is regulated originates from the gut ecosystem. The 16S rDNA sequencing analysis revealed a diabetes-driven structural dysbiosis in the model group, characterized by a significant imbalance in the Firmicutes/Bacteroidetes ratio, an enrichment of potential pathogenic taxa (e.g., Odoribacter and Clostridioides), and a depletion of beneficial taxa (e.g., Lactobacillus and Faecalibaculum). Remarkably, QMG treatment acted as a microbiota-restoring agent to reverse these pathological alterations by: (i) Restoring microbial homeostasis: normalizing the proportions of key families and genera (Faecalibaculum, Ruminococcus, Erysipelotrichaceae) towards the blank group baseline; (ii) Targeted modulation of pathobionts: downregulating the diabetes-associated overgrowth of Odoribacter splanchnicus and Clostridioides difficile; (iii) Promoting beneficial community assembly: inducing the proliferation of anti-inflammatory or metabolite-producing taxa, such as Lachnoclostridium, Blautia, and Flavonifractor plautii. Furthermore, the diversity analyses and Spearman correlation analysis at multi-levels indicated that the QMG intervention effectively rebalances the core multi-level composition in a manner that favors protective host-microbe interactions along the gut–retina axis. This result not only confirms the regulatory effect of QMG on the gut microbiota but also reveals a potential therapeutic strategy by which QMG coordinates microbiota remodeling with the activity of key regulatory proteins (e.g., IL-6, TP53) to jointly suppress systemic inflammation and thereby alleviate diabetic retinopathy.
Recent studies have verified that TCM exerts multi-target regulation on the microbiota-metabolism-immune axis, which distinguishes them from single-target pharmaceutical agents46. Accumulating evidence has demonstrated the therapeutic potential of QMG in DR and related ocular conditions. A multi-center randomized controlled trial showed that QMG significantly reduced retinal arteriovenous circulation time in DR patients, suggesting improved retinal blood flow and hypoxia47. Meta-analyses further confirmed that QMG combined with conventional treatment significantly improved central macular thickness, visual acuity, and overall effective rate in diabetic macular edema48, and also prolonged tear film breakup time and increased tear secretion in patients with dry eye disease49. In patients with NPDR-associated nerve injury, QMG demonstrated non-inferiority to calcium dobesilate in preserving retinal nerve fiber layer thickness and foveal avascular zone area50. Mechanistic studies have revealed that QMG protects against retinal damage through multiple pathways, including inhibition of Müller cell pyroptosis and immune inflammation via the P2X7R/NLRP3 pathway51, activation of the PI3K/Akt signaling pathway to reduce apoptosis, and modulation of tight junction proteins to preserve blood–retinal barrier integrity52. Network pharmacology analyses have identified multiple bioactive compounds in QMG that act synergistically on DR-related targets16, and clinical studies have reported no severe adverse events, indicating a favorable safety profile50. The therapeutic efficacy of QMG is attributed to the synergistic actions of its active components, including quercetin, kaempferol, isorhamnetin, formononetin, and β‑sitosterol, which collectively exert anti‑inflammatory, antioxidant, and anti‑apoptotic effects by targeting IL‑6, TNF‑α, TP53, and AP‑153,54,55,56,57,58,59. The present study extends this knowledge by demonstrating that QMG's protective effects are also mediated through modulation of the gut–retina axis, specifically by restoring gut microbiota homeostasis and regulating the CMKLR1‑centered molecular network to suppress systemic inflammation and alleviate retinal damage.
Several limitations of this study should be noted and warrant further investigation in future research. First, the causal relationship between gut microbial alterations and retinal functional improvements requires further validation. Although strong correlations were observed between QMG-induced microbiota remodeling and retinal protective phenotypes, direct causal inference experiments, such as fecal microbiota transplantation, germ-free animal models, or antibiotic-induced microbiota depletion, would be valuable to confirm this relationship in future studies. Second, 16S rDNA sequencing was employed to profile microbial composition, which provides adequate taxonomic resolution at the genus level and above but has limited capacity to deliver strain-level functional information or precise metabolic potential. Metagenomic sequencing or metabolomic analyses will be pursued in subsequent studies to identify the key microbial functional pathways regulated by QMG. Third, microbial changes were assessed only at the experimental endpoint, precluding a dynamic tracking of the temporal evolution of microbiota reconstruction during QMG intervention. Longitudinal sampling in future studies will help delineate the kinetics of QMG-driven microbiota remodeling and its temporal relationship with retinal protection. Fourth, although the histopathological analysis observed retinal thinning, RGC loss, and neovascular tufts, future studies should explore multiple-dose STZ injection protocols and genetically diabetic models, as well as provide a more comprehensive characterization of the DR phenotype.
In summary, this study demonstrates that QMG ameliorates DR by coupling the CMKLR1-centered molecular network with systemic inflammation via the gut–retina axis. The mechanism of action of QMG is manifested across three levels: at the microbial level, QMG reverses diabetes-induced gut dysbiosis (e.g., restoring the Firmicutes/Bacteroidetes ratio, suppressing Odoribacter and Clostridioides, and promoting beneficial bacteria such as Faecalibaculum); at the molecular level, QMG regulates the CMKLR1/Wnt5a/PPAR-γ/AP-1/TP53 pathway and alleviates systemic inflammation; at the tissue level, QMG protects retinal morphology. These findings support QMG as a promising gut–retina therapeutic strategy for DR and provide a mechanistic basis for the application of TCM in treating diabetic complications.
Disclosures
The authors declare that they have no known competing financial interests or personal relationships that could have appeared to influence the work reported in this paper.
Acknowledgements
The author would like to acknowledge all of their team members who provided a great deal of support and assistance to fulfill this research.
This research was supported by the National Natural Science Foundation of China (Grant Number:82474580), and Hospital Foundation Free Exploration Project in Hospital of Chengdu University of Traditional Chinese Medicine (No. 23ZYTS1601).
Materials
| Name | Company | Catalog Number | Comments |
|---|---|---|---|
| AP-1 monoclonal antibody | Proteintech | 66313-1-IG | 1:5000 |
| CMKLR1 polyclonal antibody | Affinity | AF5291 | 1:1000 |
| GAPDH polyclonal antibody | Affinity | AF7021 | 1:5000 |
| GoatAnti-Mouse IgG(H+L) HRP | MULTI SCIENCES | GAM0072 | 1:10000 |
| GoatAnti-Rabbit IgG(H+L) HRP | MULTI SCIENCES | GAR0072 | 1:10000 |
| GraphPad Prism | / | version 9.5 | |
| Image-Pro Plus | Media Cybernetics, Inc., Rockville, MD, USA | version 6.0 | |
| Luoning Bio-Cloud platform | http://www.biomediv.cn/login.html | ||
| Mouse IL-1β(Interleukin 1 Beta) ELISA Kit | Elabscience | E-EL-M0037 | Serum cytokine detection |
| Mouse IL-6(Interleukin-6) ELISA Kit | Elabscience | E-EL-M0044 | Serum cytokine detection |
| Mouse TNF-α(Tumor Necrosis Factor Alpha) ELISA Kit | Elabscience | E-EL-M3063 | Serum cytokine detection |
| NanoFilt | / | version 2.7.1 | |
| Nanopore GridION sequencer | Oxford Nanopore Technologies | https://store.nanoporetech.com/gridion.html | |
| Pannoramic SCAN II | 3DHISTECH Pannoramic SCAN scanner | https://www.3dhistech.com/scanners/pannoramic-scan-ii-digital-scanner/ | |
| PPAR gamma (PPAR-γ) polyclonal antibody | ImmunoWay | bs-0530R | 1:1000 |
| Python | / | version 3.7.4 | |
| Qiming Granule | Zhejiang Sansheng Mandi Pharmaceutical Co., Ltd. | Chinese National Drug Approval No. Z20090036 | 0.9 g/kg, oral gavage |
| R programming language | / | version 4.0.3 | |
| SILVA database | / | version 138 | |
| Streptozotocin (STZ) | Sigma-Aldrich | S0130 | 35 mg/kg, i.p. |
| TP53 polyclonal antibody | Abcam | ab131442 | 1:1000 |
| Usearch | / | version 10.0.240 | |
| Wnt5a polyclonal antibody | Proteintech | 55184-1-AP | 1:1000 |
| Zymo Research BIOMICS DNA Microprep Kit | Zymo Research | D4301 | Fecal gDNA extraction |
References
- Lei C, et al. Homocysteine and diabetic retinopathy. Exp Eye Res. 2026;262:110729.
- Owens DR, et al. IDF diabetes Atlas: A worldwide review of studies utilizing retinal photography to screen for diabetic retinopathy from 2017 to 2024 inclusive. Diabetes Res Clin Pract. 2025;226:112346.
- Zhu J, Huang J, Sun Y, Xu W, Qian H. Emerging role of extracellular vesicles in diabetic retinopathy. Theranostics. 2024;14(4):1631–1646.
- Xie L, Lin W. The role of gut microbiota dysbiosis in the inflammatory pathogenesis of diabetic retinopathy. Front Immunol. 2025;16:1604315.
- Niu J, Liu Y, Peng H, Chen J, Chen L. Early-stage diabetic retinopathy: gut-metabolic triggers, immune-neurodegeneration, and interventions. Graefes Arch Clin Exp Ophthalmol. 2025;263(10):2723–2736.
- Rowan S, et al. Involvement of a gut-retina axis in protection against dietary glycemia-induced age-related macular degeneration. Proc Natl Acad Sci U S A. 2017;114(22):E4472–E4481.
- Rzeczycki P, Pęciak O, Plust M, Droździk M. Gut Microbiota in the Regulation of Intestinal Drug Transporters: Molecular Mechanisms and Pharmacokinetic Implications. Int J Mol Sci. 2025;26(24):11897.
- Yang H, et al. Mediating role of aging and obesity in the relationship between dietary index for gut microbiota and metabolic syndrome and its potential regulatory mechanisms. Eur J Med Res. 2025;31(1):137.
- Zahavi EE, et al. Repeat-element RNAs integrate a neuronal growth circuit. Cell. 2025;188(16):4350–4365.e22.
- Dander E, et al. The chemerin/CMKLR1 axis regulates intestinal graft-versus-host disease. JCI Insight. 2023;8(5):e154440.
- Zhang J, et al. Therapeutic targets in the Wnt signaling pathway: Treating cancer with specificity. Biochem Pharmacol. 2025;236:116848.
- Liu M, Lim ST, Song W, Coffman TM, Wang X. Beyond lipids: fenofibrate in diabetic retinopathy and nephropathy. Trends Pharmacol Sci. 2026;47(3):325–341.
- Wu Y, et al. The active ingredient β-sitosterol in the anti-inflammatory agents alleviates perianal inflammation in rats by inhibiting the expression of Srebf2, activating the PPAR signaling pathway, and altering the composition of gut microbiota. Int Immunopharmacol. 2025;152:114470.
- Lin T, Chen C, Zhao LC, Zhu HY, Li W. The beneficial effects of Traditional Chinese Medicine on diabetic retinopathy: mechanisms, therapeutics, and prospects. Acupunct Herb Med 2026;6(2):188–204.
- Huo J, et al. Evaluation of individualized treatment of nonproliferative diabetic retinopathy: a multicenter, randomized, parallel-controlled study. J Tradit Chin Med. 2022;42(1):90–95.
- Huang Y, et al. Pharmacological mechanism and clinical study of Qiming granules in treating diabetic retinopathy based on network pharmacology and literature review. J Ethnopharmacol. 2023;302(Pt A):115861.
- Salma B, et al. Ameliorative Efficacy of the Cassia auriculata Root Against High-Fat-Diet + STZ-Induced Type-2 Diabetes in C57BL/6 Mice. ACS Omega. 2020;6(1):492–504.
- Srinivasan K, Viswanad B, Asrat L, Kaul CL, Ramarao P. Combination of high-fat diet-fed and low-dose streptozotocin-treated rat: a model for type 2 diabetes and pharmacological screening. Pharmacol Res. 2005;52(4):313–320.
- Liu Y, Deng J, Fan D. Ginsenoside Rk3 ameliorates high-fat-diet/streptozocin-induced type 2 diabetes mellitus in mice via the AMPK/Akt signaling pathway. Food Funct. 2019;10(5):2538–2551.
- Hu RY, et al. AFG Ameliorates Diabetic Retinopathy through AMPK-Dependent Autolysosomal Pathway: From Network Pharmacology to In Vivo and In Vitro Validation. J Agric Food Chem. 2026;74(2):2124–2139.
- Reagan-Shaw S, Nihal M, Ahmad N. Dose translation from animal to human studies revisited. FASEB J. 2008;22(3):659–661.
- Zou Q, et al. Oxidative stress in diabetic retinopathy. Clin Chim Acta. 2026;584:120871.
- Clements JN, Mesawich J, Twisdale C. Current and Emerging Pharmacologic Therapies for Diabetic Retinopathy. Pharmacotherapy. 2026;46(3):e70119.
- Rezvani Z, Khani F, Afarid M, Asadian F, Takhshid MA. Clinical values of systemic inflammatory indices in diabetic retinopathy. Clin Exp Optom. 2026;109(3):371–385.
- Zhu Z, et al. Targeting the CMKLR1-Mediated Signaling Rebalances Immunometabolism State in Middle-Age Testicular Macrophages. Adv Sci (Weinh). 2026;13(14):e15166.
- Lin Y, et al. Epithelial chemerin-CMKLR1 signaling restricts microbiota-driven colonic neutrophilia and tumorigenesis by up-regulating lactoperoxidase. Proc Natl Acad Sci U S A. 2022;119(29):e2205574119.
- Puthanmadhom Narayanan S, et al. Epigenetic Alterations Are Associated With Gastric Emptying Disturbances in Diabetes Mellitus. Clin Transl Gastroenterol. 2020;11(3):e00136.
- Wang L, et al. Chemerin/CMKLR1 Axis Promotes the Progression of Proliferative Diabetic Retinopathy. Int J Endocrinol. 2021;2021:4468625.
- Zheng C, et al. α-NETA down-regulates CMKLR1 mRNA expression in ileum and prevents body weight gains collaborating with ERK inhibitor PD98059 in turn to alleviate hepatic steatosis in HFD-induced obese mice but no impact on ileal mucosal integrity and steatohepatitis progression. BMC Endocr Disord. 2023;23(1):9.
- Dranse HJ, et al. The impact of chemerin or chemokine-like receptor 1 loss on the mouse gut microbiome. PeerJ. 2018;6:e5494.
- Flores-Hernández E, et al. Canonical and non-canonical Wnt signaling are simultaneously activated by Wnts in colon cancer cells. Cell Signal. 2020;72:109636.
- Qi Y, et al. Heat-inactivated Bifidobacterium adolescentis ameliorates colon senescence through Paneth-like-cell-mediated stem cell activation. Nat Commun. 2023;14(1):6121.
- Ou W, et al. Cooperation of Wnt/β-catenin and Dll1-mediated Notch pathway in Lgr5-positive intestinal stem cells regulates the mucosal injury and repair in DSS-induced colitis mice model. Gastroenterol Rep (Oxf). 2024;12:goae090.
- Dong Y, et al. Berberine ameliorates DSS-induced intestinal mucosal barrier dysfunction through microbiota-dependence and Wnt/β-catenin pathway. Int J Biol Sci. 2022;18(4):1381–1397.
- Escandon P, et al. The role of peroxisome proliferator-activated receptors in healthy and diseased eyes. Exp Eye Res. 2021;208:108617.
- Blot G, et al. Perilipin 2-positive mononuclear phagocytes accumulate in the diabetic retina and promote PPARγ-dependent vasodegeneration. J Clin Invest. 2023;133(19):e161348.
- Zhou W, et al. TREM2-dependent activation of microglial cell protects photoreceptor cell during retinal degeneration via PPARγ and CD36. Cell Death Dis. 2024;15(8):623.
- Bala Kumar S, et al. Gut microbial metabolites targeting JUN in renal cell carcinoma via IL-17 signaling pathway: network pharmacology approach. Mol Divers. 2026;30(1):613–632.
- Wang L, et al. Gut microbial bile acid metabolite skews macrophage polarization and contributes to high-fat diet-induced colonic inflammation. Gut Microbes. 2020;12(1):1–20.
- Hagan T, et al. Antibiotics-Driven Gut Microbiome Perturbation Alters Immunity to Vaccines in Humans. Cell. 2019;178(6):1313–1328.e13.
- Meng Y, et al. Jinlida ameliorates diabetic kidney disease via gut microbiota-dependent production of pyridoxamine targeting renal AGEs/RAGE and TGF-β pathways. Phytomedicine. 2026;150:157744.
- Zhou H, Zhang L, Ding C, Zhou Y, Li Y. Upregulation of HMOX1 associated with M2 macrophage infiltration and ferroptosis in proliferative diabetic retinopathy. Int Immunopharmacol. 2024;134:112231.
- Mohammad HMF, et al. Neuroprotective effect of levetiracetam in mouse diabetic retinopathy: Effect on glucose transporter-1 and GAP43 expression. Life Sci. 2019;232:116588.
- Peng H, et al. Autophagy and senescence of rat retinal precursor cells under high glucose. Front Endocrinol (Lausanne). 2023;13:1047642.
- Ding Y, Chen L, Xu J, Feng Y, Liu Q. APAF1 Silencing Ameliorates Diabetic Retinopathy by Suppressing Inflammation, Oxidative Stress, and Caspase-3/GSDME-Dependent Pyroptosis. Diabetes Metab Syndr Obes. 2024;17:1635–1649.
- Yang T, et al. Clinical study on the modulating effects of Jiaotaiwan on the modulating effects of microbiota–SCFAs–neurotransmitter/immune axis in patients with depression. Acupunct Herb Med 2025;5(4):456–468.
- Luo XX, et al. Effect of qiming granule on retinal blood circulation of diabetic retinopathy: a multicenter clinical trial. Chin J Integr Med. 2009;15(5):384–388.
- Hu Z, et al. Add-on effect of Qiming granule, a Chinese patent medicine, in treating diabetic macular edema: A systematic review and meta-analysis. Phytother Res. 2021;35(2):587–602.
- Yang M, et al. The Efficacy and Safety of Qiming Granule for Dry Eye Disease: A Systematic Review and Meta-Analysis. Front Pharmacol. 2020;11:580.
- Ma XF, et al. Efficacy and Safety of Qiming Granule for Nerve Injury Associated with Non-proliferative Diabetic Retinopathy: A Multicenter, Randomized, Non-inferiority, Active-Controlled Clinical Trial. Chin J Integr Med. 2026;32(3):195–203.
- Zhou Q, et al. Qiming granules regulate Müller cell pyroptosis and the P2X7R/NLRP3 immune inflammatory pathway in diabetic retinopathy. Chin Med. 2026;21(1):89.
- Zhou L, Qin T, Lv Y, Wu Z. Qiming Granules Ameliorate Diabetic Retinopathy by Regulating the PI3K/Akt Signaling Pathway. J Ocul Pharmacol Ther. 2026;42(3):202–212.
- Li HD, Li MX, Zhang WH, Zhang SW, Gong YB. Effectiveness and safety of traditional Chinese medicine for diabetic retinopathy: A systematic review and network meta-analysis of randomized clinical trials. World J Diabetes. 2023;14(9):1422–1449.
- Chen F, et al. Isorhamnetin promotes functional recovery in rats with spinal cord injury by abating oxidative stress and modulating M2 macrophages/microglia polarization. Eur J Pharmacol. 2021;895:173878.
- Naudhani M, Thakur K, Ni ZJ, Zhang JG, Wei ZJ. Formononetin reshapes the gut microbiota, prevents progression of obesity and improves host metabolism. Food Funct. 2021;12(24):12303–12324.
- Qu Y, et al. Kaempferol Alleviates Murine Experimental Colitis by Restoring Gut Microbiota and Inhibiting the LPS-TLR4-NF-κB Axis. Front Immunol. 2021;12:679897.
- Saikia L, et al. Therapeutic Potential of Quercetin in Diabetic Neuropathy and Retinopathy: Exploring Molecular Mechanisms. Curr Top Med Chem. 2024;24(27):2351–2361.
- Yao H, et al. Kaempferol Protects Blood Vessels From Damage Induced by Oxidative Stress and Inflammation in Association With the Nrf2/HO-1 Signaling Pathway. Front Pharmacol. 2020;11:1118.
- Zhang HX, Li YY, Liu ZJ, Wang JF. Quercetin effectively improves LPS-induced intestinal inflammation, pyroptosis, and disruption of the barrier function through the TLR4/NF-κB/NLRP3 signaling pathway in vivo and in vitro. Food Nutr Res. 2022;66:10.