This retrospective study presents a structured protocol for combined respiratory and Kegel exercise rehabilitation after laparoscopic hysterectomy and evaluates its association with early recovery, acute pain, pelvic floor symptoms, pelvic floor muscle performance, and quality of life.
Method Article
Combined Respiratory and Kegel Exercises for Postoperative Recovery After Laparoscopic Hysterectomy: A Retrospective Controlled Study
* These authors contributed equally
In This Article
Summary
Abstract
This study presents a structured protocol combining respiratory and Kegel exercises for postoperative rehabilitation following laparoscopic hysterectomy and retrospectively evaluates the protocol's association with recovery outcomes. Ninety-four patients treated between January 2022 and August 2023 were retrospectively evaluated according to the postoperative rehabilitation documented in their medical records: 47 received combined respiratory and Kegel exercises in addition to routine rehabilitation (observation group), and 47 received routine rehabilitation alone (control group). The combined program was initiated on postoperative day 1 after clinical stabilization and continued during hospitalization and after discharge for 2 months; the exact postoperative hour of the first rehabilitation session was not consistently documented in the retrospective records. Because the study was retrospective, random sequence generation, allocation concealment, and prospective blinding were not performed. Baseline demographic and clinical characteristics showed no evident between-group imbalance. The observation group had earlier first flatus, earlier resumption of oral intake, and a shorter postoperative hospital stay. At the 2-month follow-up, the observation group showed fewer pelvic floor symptom indicators and better sustained- and rapid-contraction pelvic floor muscle performance. Acute postoperative pain at 12 h and 24 h was lower in the observation group. Because oral intake, first flatus, and the 12 h pain assessment occurred before or around rehabilitation initiation, these early postoperative findings were interpreted as descriptive between-group differences rather than effects attributable to the rehabilitation intervention. The observation group also had higher Incontinence Quality of Life scores and lower Pelvic Floor Impact Questionnaire-7 scores, indicating a more favorable quality-of-life profile. Receipt of combined respiratory and Kegel exercise rehabilitation was associated with more favorable postoperative recovery, although the retrospective single-center design requires cautious interpretation and prospective confirmation.
Introduction
Laparoscopic hysterectomy is widely used for gynecological conditions, including uterine fibroids, endometriosis, gynecological malignancies, and uterine prolapse1,2. Compared with conventional open surgery, laparoscopic hysterectomy is generally associated with less surgical trauma, reduced intraoperative blood loss, less postoperative pain, and faster recovery3,4. Nevertheless, postoperative pain, nausea and vomiting, delayed recovery of gastrointestinal function, and impaired early recovery may still occur after laparoscopic hysterectomy5,6. Hysterectomy may alter the anatomical and functional relationships among the pelvic floor muscles, fascia, ligaments, and nerves, potentially contributing to urinary, bowel, and prolapse-related symptoms. In a long-term observational cohort, vaginal vault prolapse was identified in 4.4% of women after laparoscopic hysterectomy, indicating that clinically relevant pelvic floor sequelae may persist even after minimally invasive surgery7. Therefore, postoperative rehabilitation should address not only incision healing and early physical recovery but also pelvic floor function and quality of life.
Respiratory exercise and pelvic floor muscle training may target different but functionally related components of postoperative recovery. Respiratory exercises may promote thoracoabdominal mobility, improve ventilation, facilitate relaxation, and support early postoperative mobilization. The diaphragm, abdominal muscles, and pelvic floor muscles also participate in coordinated regulation of intra-abdominal pressure. Experimental evidence has demonstrated that pelvic floor muscles contribute to respiratory and postural functions, providing a physiological basis for coordinating breathing with pelvic floor muscle contraction and relaxation8. Kegel exercise directly trains voluntary pelvic floor muscle contraction, endurance, and neuromuscular control and is widely used in rehabilitation for urinary incontinence and pelvic floor dysfunction9,10. Accordingly, combining respiratory and Kegel exercises may theoretically facilitate coordinated breathing and pelvic floor activation while supporting early postoperative recovery and subsequent pelvic floor rehabilitation.
Previous studies have incorporated breathing exercises into multimodal rehabilitation after gynecological abdominal surgery and reported favorable pain-related and recovery outcomes11. Pelvic floor rehabilitation programs have also been evaluated in gynecological cancer survivors, with reported improvements in pelvic floor function and quality of life12. However, the evidence remains incomplete. A recent systematic review of pelvic floor muscle training after hysterectomy found moderate-quality evidence for improvement in sexual function, whereas effects on urinary symptoms, pelvic floor muscle performance, quality of life, and vaginal prolapse remained uncertain13. Few studies have evaluated a combined respiratory and Kegel exercise program specifically after laparoscopic hysterectomy while simultaneously examining early gastrointestinal recovery, acute postoperative pain, pelvic floor symptoms, pelvic floor muscle performance, and quality of life. Therefore, this retrospective controlled study aimed to evaluate the association between receipt of a combined respiratory and Kegel exercise program and postoperative recovery after laparoscopic hysterectomy. We hypothesized that receipt of the combined program would be associated with earlier gastrointestinal recovery, a shorter postoperative hospital stays, lower acute postoperative pain, fewer pelvic floor symptom indicators, better pelvic floor muscle performance, and better quality of life.
Protocol
The study was approved by the Ethics Committee of Hebei PetroChina Central Hospital (approval no. FKWK_HLLC2304) and conducted in accordance with the Declaration of Helsinki. Written informed consent for use of clinical data was obtained from all participants.
1. Study design and participant identification
- Review the electronic medical records of consecutive patients who underwent laparoscopic hysterectomy at Hebei PetroChina Central Hospital between January 2022 and August 2023.
- Screen all potentially eligible records using the predefined inclusion and exclusion criteria.
NOTE: In total, 128 records were screened during the study period. Thirty-four records were excluded for the following reasons: preexisting pelvic floor dysfunction (n = 8), urinary tract infection or active pelvic inflammatory disease (n = 5), cesarean section or other pelvic surgery within the previous 12 months (n = 6), clinically significant liver or kidney dysfunction (n = 3), chronic respiratory disease interfering with respiratory exercise (n = 4), and incomplete clinical data (n = 8). The remaining 94 patients were included in the final cohort. A participant-flow diagram is provided in Supplementary Figure 1. - Extract baseline demographic and clinical variables, including age, body mass index (BMI), indication for hysterectomy, parity, menopausal status, major comorbidities, and surgical duration.
- Categorize patients according to the postoperative rehabilitation documented in the medical records.
- Define the observation group (OG) as patients who received combined respiratory and Kegel exercises in addition to routine rehabilitation.
- Assign the control group (CG) as patients who received routine rehabilitation alone.
NOTE: In this cohort, each group contained 47 patients.
- Document the rehabilitation strategy as determined during routine clinical care before retrospective data collection. Do not describe the study as randomized. State that random sequence generation and allocation concealment were not applicable, and that no prospective blinding of patients, rehabilitation therapists, outcome assessors, or statisticians was performed.
2. Eligibility criteria
- Include patients who met the indications for laparoscopic hysterectomy; had clear consciousness and stable vital signs; were married women without fertility requirements; successfully underwent laparoscopic hysterectomy; and had complete clinical data.
- Exclude patients with preexisting pelvic floor dysfunction; clinically significant liver or kidney dysfunction; urinary tract infection; active pelvic inflammatory disease, including vaginitis or genital herpes; cesarean section or other pelvic surgery within the previous 12 months; neurological disorders affecting pelvic floor motor control or rehabilitation; connective tissue disease affecting pelvic support; chronic respiratory disease interfering with respiratory exercise; hematological disease; or mental disorders affecting participation or outcome assessment.
- Do not exclude the history of cesarean section or other pelvic surgery more than 12 months before the index hysterectomy solely on the basis of surgical history if the patient had clinically recovered and had no persistent pelvic floor dysfunction or surgery-related functional impairment.
- Use the 12-month interval to reduce potential confounding from recovery after a recent operation.
3. Rehabilitation interventions
- Provide both groups with the same routine perioperative nursing care, including preoperative health education, psychological support, preoperative preparation, intraoperative monitoring, postoperative basic care, activity guidance, dietary guidance, and discharge education. Do not provide the CG with structured respiratory exercises, Kegel exercises, or other specific pelvic floor muscle training.
- For the OG, initiate combined respiratory and Kegel exercise rehabilitation on postoperative day 1 after confirming stable vital signs and absence of contraindications to exercise. Do not initiate or temporarily withhold exercise in the presence of hemodynamic instability, active postoperative bleeding, fever or suspected acute infection, severe or uncontrolled pain, marked dizziness or syncope, acute dyspnea or chest discomfort, or any other condition judged by the clinical team to make exercise unsafe. Because this was a retrospective study, the exact postoperative hour of the first rehabilitation session was not consistently documented in the available records. Continue the program during hospitalization and after discharge for a total of 2 months.
- Perform respiratory exercises three times daily.
- Position the patient supine. Instruct the patient to inhale slowly through the nose, allowing the abdomen to expand, and then exhale through the mouth while gently drawing the abdominal wall inward without forceful trunk flexion or external compression.
- Position the patient sitting and ask the patient to place one hand over the upper chest and the other over the abdomen. Instruct the patient to inhale slowly through the nose and exhale through slightly pursed lips while allowing the abdominal wall to move inward.
- Use an inspiratory-to-expiratory ratio of approximately 1:2. Maintain a respiratory frequency of 6–8 breaths/min.
- Perform Kegel exercises by instructing patients to contract and lift the pelvic floor muscles as if attempting to stop passage of urine or flatus while avoiding gluteal and abdominal contraction and breath-holding14,15,16.
- Perform 10 pelvic floor contractions per set and complete 3 sets during each session.
- Allow a 60 s rest interval between sets.
- During postoperative week 1, maintain each contraction for 3–5 s followed by an equal or slightly longer relaxation period.
- During weeks 2–4, increase the contraction duration to 5–8 s depending on tolerance.
- During weeks 5–8, encourage contractions of approximately 8–10 s at a strong but comfortable voluntary intensity without pain or obvious compensatory movement.
NOTE: If a patient was unable to tolerate the prescribed contraction duration, use the lower end of the stage-specific duration range and extend the relaxation interval as needed. If discomfort, fatigue, or obvious compensatory movement persisted, or if pain, marked dizziness, active bleeding, dyspnea, chest discomfort, or other signs of intolerance occurred, stop the session immediately and place the patient in a safe resting position. - Assess vital signs and bleeding or surgical-site status as appropriate, notify the responsible clinical team, and resume exercise only after the symptoms had resolved and the patient had been considered safe to continue.
- Conduct each combined session for approximately 30 min, three times daily, using approximately 10 min of respiratory exercise followed by approximately 20 min of pelvic floor muscle contraction-relaxation cycles, including the prescribed 60 s rest intervals between sets.
- During hospitalization, have a trained rehabilitation nurse demonstrate and supervise the exercises, correct gluteal or abdominal compensation and breath-holding, and require patients to demonstrate the exercises independently before discharge.
- Document inpatient adherence in nursing rehabilitation records. Record any session terminated because of poor tolerance as an incomplete session. After discharge, use a daily exercise log and weekly telephone follow-up. Calculate adherence as completed sessions/prescribed sessions × 100%; consider at least 80% completion satisfactory.
- Provide routine postoperative care as follows.
- Maintain standard hydration and monitor vital signs. Keep the patient supine without a pillow for the first 6 h after surgery.
- Remove the urinary catheter within 6 h postoperatively according to the clinical care pathway. Begin assisted limb movements from postoperative hour 6.
- Guide patients to ambulate on postoperative day 2.
- Provide dietary guidance emphasizing small, frequent meals and avoiding dairy and legumes during early recovery.
- Apply the same predefined institutional discharge criteria to both groups, independent of rehabilitation group assignment.
4. Outcome assessment
- Define pelvic floor symptom status at the 2-month follow-up as the prespecified primary endpoint, assessed using five predefined binary indicators: lower abdominal or pelvic discomfort, urinary incontinence, abnormal urination, abnormal defecation, and abnormal vaginal symptoms. Analyze these five indicators separately rather than combining them into a composite score.
- Define early postoperative recovery, acute postoperative pain, pelvic floor muscle performance, and quality of life as secondary outcomes.
- Obtain baseline demographic and clinical characteristics and screen for preexisting pelvic floor dysfunction before surgery.
- Record time to first flatus (h), time to resume oral intake (h), and postoperative hospital stay (days) during the index hospitalization.
- At the 2-month follow-up, evaluate the prespecified primary endpoint using five binary pelvic floor symptom indicators: lower abdominal or pelvic discomfort, urinary incontinence, abnormal urination, abnormal defecation, and abnormal vaginal symptoms.
- Interpret terminology according to standardized International Urogynecological Association/International Continence Society (IUGA/ICS) terminology17. Record each indicator as absent (0) or present (1) and analyze each separately.
- Assess pelvic floor muscle performance at the 2-month follow-up using a computerized intravaginal pelvic floor rehabilitation system equipped with a reusable intravaginal biofeedback probe (see Table of Materials).
- Ask the patient to empty the bladder. Have the patient rest in the supine position for approximately 5 min before testing.
- Apply a small amount of water-based conductive lubricant to the probe. Have a trained assessor insert the probe into the mid-vaginal canal with the patient's consent.
- Adjust the probe to ensure stable contact with the vaginal wall. Permit one or two practice contractions before formal testing.
- Perform the formal pelvic floor muscle performance assessment as follows.
- Instruct the patient to contract and lift the pelvic floor muscles as strongly as possible without abdominal or gluteal contraction. Use maximal voluntary effort rather than a preset percentage of maximal voluntary contraction.
- For sustained-contraction assessment, instruct the patient to perform three maximal voluntary contractions of approximately 5 s each. Allow approximately 10 s of relaxation between contractions.
- For rapid-contraction assessment, instruct the patient to perform five brief maximal contractions of approximately 1–2 s each. Allow complete relaxation between contractions.
- Monitor breathing and visible abdominal or gluteal compensation during testing. Repeat a contraction if obvious compensation or breath-holding occurs.
- Record device-generated sustained- and rapid-contraction performance grades separately on a 0–5 scale: 0, no effective contraction; 1, very weak; 2, weak; 3, moderate; 4, good; and 5, strong. NOTE: Quantitative preoperative pelvic floor muscle performance grades were not available.
- Assess acute postoperative pain from routine nursing records at 12 h and 24 h after surgery using the four-category ordinal classification documented in clinical care: no pain (0), mild pain (1), moderate pain (2), and severe pain (3). Treat this as a study-specific ordinal clinical measure rather than a validated VAS or NRS. These time points are intended to characterize acute pain during the immediate postoperative recovery period, not pain throughout the 2-month rehabilitation period.
- At the 2-month follow-up, assess quality of life using the Incontinence Quality of Life questionnaire (I-QOL) and the Pelvic Floor Impact Questionnaire-7 (PFIQ-7).
- Transform the 22-item I-QOL to a 0-100 scale, with higher scores indicating better incontinence-related quality of life18. Score PFIQ-7 from 0 to 300 points, with higher scores indicating a greater negative impact of pelvic floor symptoms on daily activities and quality of life19.
5. Statistical analysis
- Perform statistical analyses using statistical analysis software and generate figures using scientific graphing software (see Table of Materials). The de-identified dataset used for the statistical analyses is provided in Supplementary File 1.
NOTE: Because the study is retrospective, include all eligible patients during the study period rather than performing a prospective sample-size calculation. A sensitivity analysis indicated that 47 patients per group provided approximately 80% power to detect a standardized between-group difference of 0.58 at a two-sided alpha level of 0.05. - Analyze continuous and categorical variables as follows.
- Assess the normality of continuous variables using the Shapiro-Wilk test. Present continuous data as mean ± standard deviation (SD).
- Compare normally distributed continuous variables using independent-samples t-tests. Compare non-normally distributed continuous variables using Mann-Whitney U tests.
- Present categorical variables as number (percentage). Compare categorical variables using chi-square or Fisher exact tests, as appropriate.
- Analyze repeated ordinal pain measurements at 12 h and 24 h using generalized estimating equations to account for within-patient correlation. Report effect estimates with 95% confidence intervals where appropriate. Use two-sided tests and consider P < 0.05 statistically significant.
Results
Baseline characteristics
A total of 94 patients were included, with 47 patients in each group. Mean age was 48.94 ± 6.73 years in the OG and 49.25 ± 6.98 years in the CG; corresponding BMI values were 22.18 ± 1.86 kg/m2 and 22.26 ± 1.78 kg/m2. No significant between-group differences were observed in age, BMI, indication for hysterectomy, parity, menopausal status, hypertension, diabetes mellitus, or surgical duration (all P > 0.05), indicating no evident imbalance in the measured baseline characteristics (Table 1).
| Characteristic | Observation group (n = 47) | Control group (n = 47) | t/χ2 | P |
| Age, years | 48.94 ± 6.73 | 49.25 ± 6.98 | 0.219 | 0.827 |
| BMI, kg/m² | 22.18 ± 1.86 | 22.26 ± 1.78 | 0.213 | 0.832 |
| Indication for hysterectomy, n (%) | 0.055 | 0.973 | ||
| Uterine fibroids | 25 (53.2) | 24 (51.1) | ||
| Adenomyosis | 14 (29.8) | 15 (31.9) | ||
| Endometriosis | 8 (17.0) | 8 (17.0) | ||
| Parity, n (%) | 0.172 | 0.678 | ||
| 1 | 22 (46.8) | 20 (42.6) | ||
| ≥2 | 25 (53.2) | 27 (57.4) | ||
| Menopausal status, n (%) | 0.052 | 0.820 | ||
| Premenopausal | 34 (72.3) | 33 (70.2) | ||
| Postmenopausal | 13 (27.7) | 14 (29.8) | ||
| Hypertension, n (%) | 8 (17.0) | 9 (19.1) | 0.072 | 0.789 |
| Diabetes mellitus, n (%) | 4 (8.5) | 5 (10.6) | — | 1.000 |
| Surgical duration, min | 102.60 ± 18.40 | 104.30 ± 19.10 | 0.439 | 0.661 |
Table 1: Baseline demographic and clinical characteristics of the two groups. Continuous variables are presented as mean ± SD and categorical variables as n (%). BMI, body mass index. Fisher exact test was used for diabetes mellitus because of the small expected cell count.
Postoperative clinical indicators
Early postoperative clinical indicators differed between the two groups. Because oral intake and first flatus occurred before or around rehabilitation initiation, these findings were interpreted as descriptive between-group differences rather than effects attributable to the combined exercise program. Time to first flatus was 15.65 ± 2.11 h versus 23.65 ± 3.45 h (mean difference [MD], -8.00 h; 95% CI, -9.17 to -6.83; P < 0.001). Resumption of oral intake occurred at 6.15 ± 1.88 h versus 9.56 ± 2.89 h (MD, -3.41 h; 95% CI, -4.41 to -2.41; P < 0.001). Postoperative hospital stay was 3.18 ± 1.11 days versus 6.08 ± 1.89 days (MD, -2.90 days; 95% CI, -3.54 to -2.26; P < 0.001) (Figure 1).
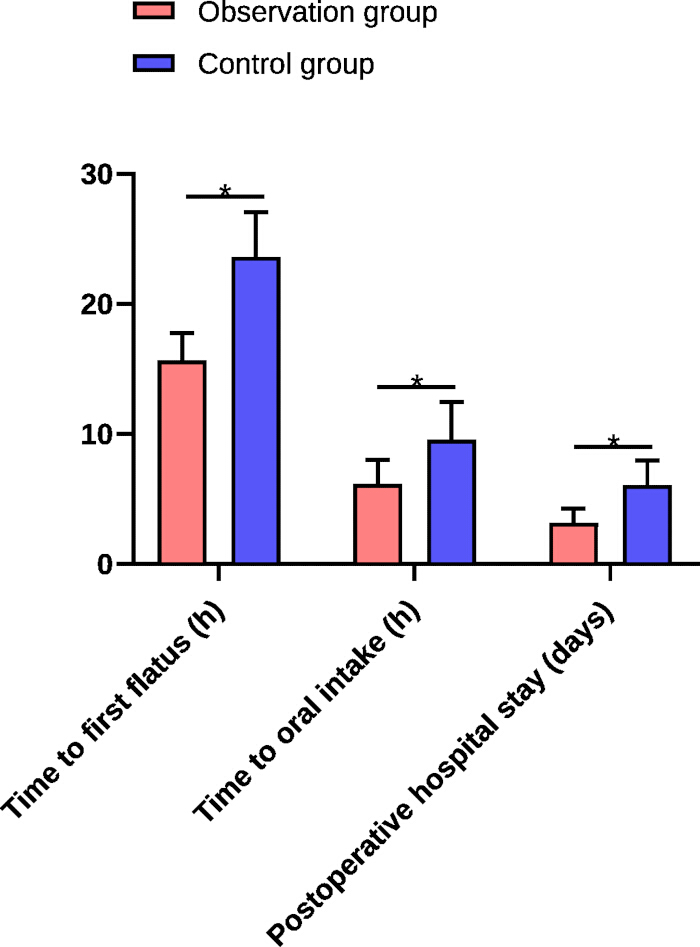
Figure 1: Comparison of postoperative clinical recovery parameters between the two groups. Data are presented as mean ± SD. *P < 0.05. Please click here to view a larger version of this figure.
Pelvic floor symptoms
At baseline, no included patient had documented pelvic floor dysfunction symptoms because preexisting pelvic floor dysfunction was an exclusion criterion. At the 2-month follow-up, lower abdominal or pelvic discomfort occurred in 1/47 (2.1%) patients in the OG and 8/47 (17.0%) in the CG; urinary incontinence in 1/47 (2.1%) and 5/47 (10.6%); abnormal urination in 4/47 (8.5%) and 11/47 (23.4%); abnormal defecation in 2/47 (4.3%) and 10/47 (21.3%); and abnormal vaginal symptoms in 3/47 (6.4%) and 13/47 (27.7%), respectively. Overall, the OG showed lower frequencies of postoperative pelvic floor symptom indicators (Figure 2).
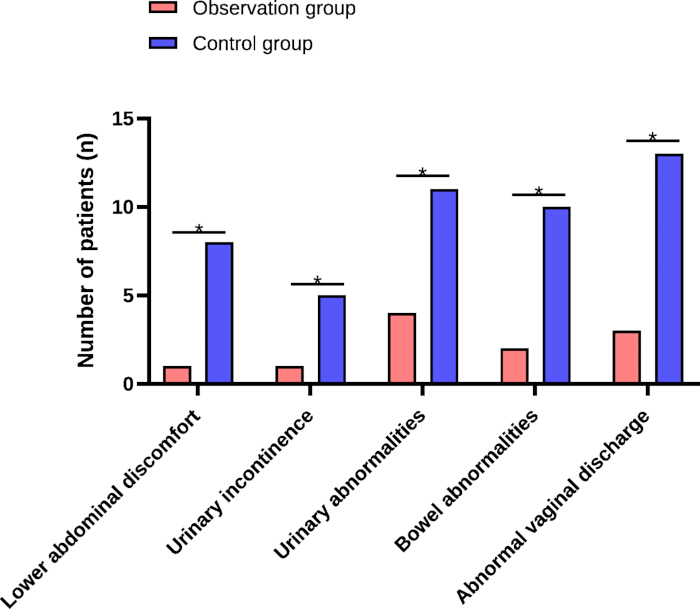
Figure 2: Comparison of pelvic floor symptom indicators between the two groups at the 2-month follow-up. Data are presented as number of patients (n). No included patient had documented pelvic floor dysfunction symptoms at baseline because preexisting pelvic floor dysfunction was an exclusion criterion. *P < 0.05. Please click here to view a larger version of this figure.
Pelvic floor muscle performance
Quantitative pelvic floor muscle performance grades were available at the 2-month follow-up. Sustained-contraction performance was 3.25 ± 0.33 in the OG and 2.71 ± 0.21 in the CG (MD, 0.54; 95% CI, 0.43-0.65; P < 0.001). Rapid-contraction performance was 2.08 ± 0.14 and 1.53 ± 0.11, respectively (MD, 0.55; 95% CI, 0.50-0.60; P < 0.001). Within the predefined 0-5 grading framework, these values correspond approximately to moderate versus weak-to-moderate sustained performance and weak versus very weak-to-weak rapid performance. Because no validated normal cutoff or minimal clinically important difference has been established for this device-specific scale in post-hysterectomy patients, the values should be interpreted descriptively rather than as evidence of normalization (Figure 3).
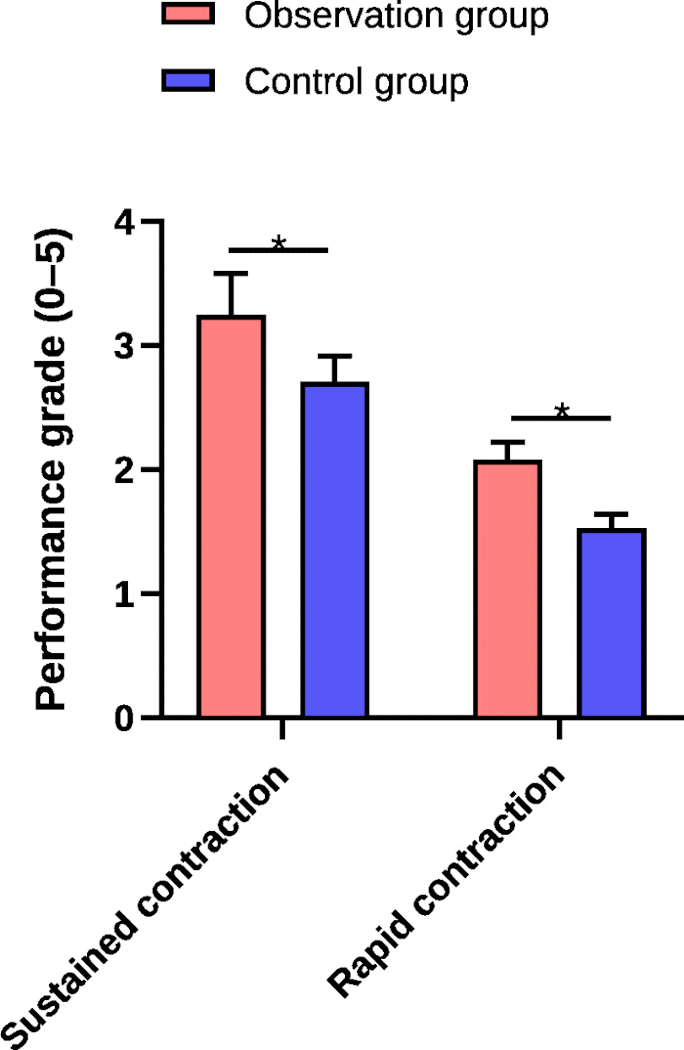
Figure 3: Comparison of pelvic floor muscle performance between the two groups. Data are presented as mean performance grade (0–5) ± SD. *P < 0.05. Please click here to view a larger version of this figure.
Early postoperative pain
Postoperative pain severity was assessed at 12 h and 24 h to characterize acute pain during immediate recovery. Repeated-measures analysis showed lower pain severity in the OG than in the CG across the two time points (P < 0.05). These findings represent descriptive between-group differences in acute postoperative pain; because the 12 h assessment could precede or overlap with rehabilitation initiation, they should not be interpreted as an analgesic effect attributable to the combined exercise program (Figure 4).
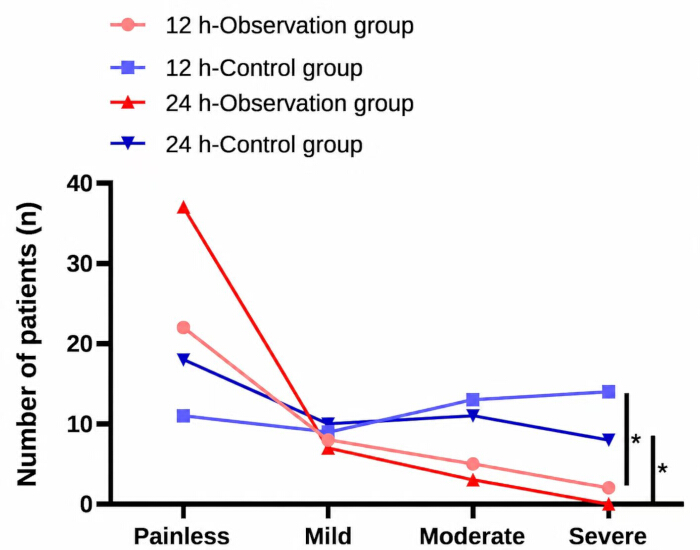
Figure 4: Distribution of acute postoperative pain severity at 12 and 24 h after surgery. Data are presented as number of patients (n). Please click here to view a larger version of this figure.
Quality of life
At the 2-month follow-up, the OG had a higher I-QOL score than the CG (79.58 ± 8.11 vs. 69.87 ± 8.71 points; MD, 9.71 points; 95% CI, 6.26-13.16; P < 0.001), indicating better incontinence-related quality of life. In contrast, the PFIQ-7 score was lower in the OG (36.89 ± 9.77 vs. 51.95 ± 11.89 points; MD, -15.06 points; 95% CI, -19.52 to -10.60; P < 0.001), indicating a lower negative impact of pelvic floor symptoms on daily life. Thus, the two instruments showed directionally consistent results (Figure 5).
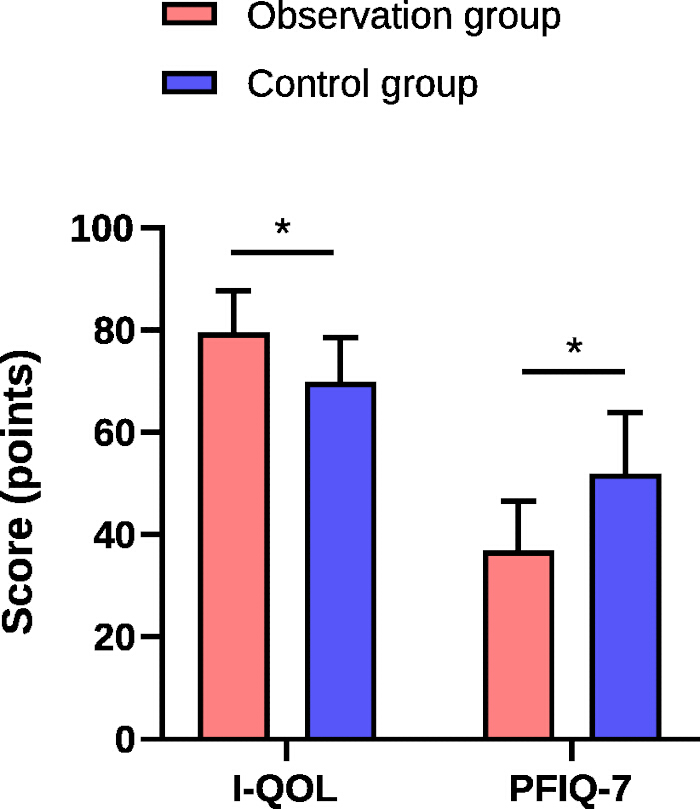
Figure 5: Comparison of quality-of-life scores between the two groups. Data are presented as mean score (points) ± SD. *P < 0.05. Please click here to view a larger version of this figure.
Supplementary Figure 1: Participant-flow diagram. This shows the number of records screened, excluded (with reasons), and finally included in the observation group and control group. Please click here to download this file.
Supplementary File 1: De-identified dataset used for the statistical analyses. Please click here to download this file.
Discussion
Laparoscopic hysterectomy is a minimally invasive approach associated with relatively small incisions, reduced blood loss, less postoperative pain, and shorter recovery compared with open surgery, although postoperative discomfort, nausea, and delayed recovery can still occur20,21. Hysterectomy may alter the anatomical and functional relationships of pelvic supporting structures and may consequently affect pelvic floor support and function to varying degrees22,23. This statement describes potential anatomical effects of hysterectomy in general and does not imply that a specific resection of pelvic supporting structures was uniformly performed in all patients in this cohort. These considerations support attention to both immediate recovery and pelvic floor rehabilitation after laparoscopic hysterectomy.
In the present study, the OG had earlier first flatus, earlier oral intake, and a shorter postoperative hospital stay. However, because oral intake and first flatus occurred before or around rehabilitation initiation, these early differences cannot be attributed to the combined exercise program. Respiratory training may support ventilation, thoracoabdominal mobility, respiratory muscle function, and early activity24,25. Kegel exercise was originally developed as a structured pelvic floor muscle training approach and remains widely used to improve voluntary pelvic floor contraction and control16,26,27. The observed differences are also consistent with recent evidence supporting pelvic floor muscle training after total hysterectomy28. However, a systematic review found more consistent evidence for pelvic floor muscle training than for breathing exercises and concluded that the additional benefit of combining breathing with pelvic floor muscle training remains uncertain29. Therefore, the present findings support further investigation of the combined approach but do not establish an independent additive effect of respiratory exercise.
The OG also showed fewer pelvic floor symptom indicators and higher sustained- and rapid-contraction performance grades at 2 months. Pelvic floor muscle performance during voluntary contraction reflects coordinated neuromuscular recruitment rather than isolated activation of a single histological fiber type30,31. Accordingly, sustained- and rapid-contraction indices were interpreted only as functional performance measures. The approximately half-grade between-group differences suggest a relative functional advantage, but the absence of a validated normal cutoff or minimal clinically important difference for this device-specific scale in post-hysterectomy patients limits conclusions regarding normalization or clinical magnitude. Several procedural steps are critical for correct implementation of the protocol. Patients should maintain the prescribed breathing pattern and perform pelvic floor contractions without gluteal or abdominal compensation or breath-holding; supervised instruction and feedback are therefore important, particularly during the initial training period32,33,34,35. For patients unable to tolerate the prescribed contraction duration, the lower end of the stage-specific duration range can be used and the relaxation interval extended. If discomfort, fatigue, pain, dizziness, bleeding, or other signs of intolerance persist, the session should be stopped and resumed only after clinical reassessment confirms that exercise can be continued safely.
The quality-of-life findings were directionally consistent across the two instruments: higher I-QOL and lower PFIQ-7 scores in the OG both indicated a more favorable profile at 2 months. Beyond statistical significance, the 8.00 h earlier first flatus, 3.41 h earlier resumption of oral intake, and 2.90-day shorter postoperative hospital stay suggest potential practical relevance for early recovery. Nevertheless, the retrospective non-randomized design does not exclude residual confounding. Unmeasured factors such as perioperative analgesic use, individual rehabilitation motivation, and home support may have influenced recovery; the observed differences should therefore be interpreted as associations rather than definitive causal effects. From a clinical perspective, this protocol may provide a structured nursing rehabilitation approach for clinically stable patients recovering from laparoscopic hysterectomy who have no contraindications to exercise. Its staged format allows supervised initiation during hospitalization and continuation as a home-based rehabilitation program after discharge. The protocol is intended to complement, rather than replace, routine postoperative care, and its application to other gynecological procedures or higher-risk populations requires further evaluation.
Several limitations should be considered. First, this was a retrospective, non-randomized study, and prospective blinding of patients, rehabilitation therapists, outcome assessors, and statisticians was not implemented. Awareness of rehabilitation exposure may therefore have influenced subjective outcomes, particularly pain and patient-reported quality-of-life measures. Postoperative pain was assessed using a study-specific four-category ordinal classification rather than a formally validated VAS or NRS and was limited to 12 h and 24 h; the pain findings therefore apply only to the acute postoperative period. Second, adherence after discharge relied on exercise logs and weekly telephone follow-up and was not verified using objective electronic monitoring. Third, the single-center setting and relatively small sample may limit external validity and generalizability. Finally, follow-up was limited to 2 months, and quantitative instrumented pelvic floor muscle grades were unavailable at baseline; within-patient change in muscle performance and longer-term persistence of the observed differences therefore could not be determined.
In this retrospective controlled study, receipt of combined respiratory and Kegel exercise rehabilitation was associated with better pelvic floor outcomes and more favorable quality-of-life measures at the 2-month follow-up after laparoscopic hysterectomy. Early postoperative recovery and pain also differed between the two groups, but these early differences should not be attributed to the rehabilitation intervention because their timing preceded or overlapped with rehabilitation initiation. These findings should be interpreted in light of the retrospective, single-center design and require confirmation in larger multicenter prospective studies with longer follow-up.
Disclosures
The authors declare no conflicts of interest.
Acknowledgements
This work was supported by the Langfang Science and Technology Support Project of Hebei Province (Grant No. 2023013232).
Materials
| Name | Company | Catalog Number | Comments |
|---|---|---|---|
| PHENIX USB4 pelvic floor rehabilitation system | Electronic Concept Lignon Innovation (France) | PHENIX USB4 | Used for pelvic floor muscle performance assessment. |
| Intravaginal biofeedback probe compatible with PHENIX USB4 | Not specified in source records | Not specified in source records | A vaginal/intravaginal biofeedback probe was used with the PHENIX USB4. Exact accessory manufacturer/model should be confirmed from the hospital inventory before final submission. |
| IBM SPSS Statistics | IBM Corp. | Version 26.0 | Used for statistical analysis. |
| GraphPad Prism | GraphPad Software, LLC | Version 8 | Used for figure generation. |
References
- Sokol AI, Green IC. Laparoscopic hysterectomy. Clin Obstet Gynecol. 2009;52(3):304–312.
- Hawe JA, Garry R. Laparoscopic hysterectomy. Semin Laparosc Surg. 1999;6(2):80–89.
- Sandberg EM, et al. Total laparoscopic hysterectomy versus vaginal hysterectomy: a systematic review and meta-analysis. J Minim Invasive Gynecol. 2017;24(2):206–217.e22.
- Nesbitt-Hawes EM, et al. Laparoscopic subtotal hysterectomy: evidence and techniques. J Minim Invasive Gynecol. 2013;20(4):424–434.
- Inania M, Sharma P, Parikh M. Role of enhanced recovery after surgery in total laparoscopic hysterectomy. J Minim Access Surg. 2022;18(2):186–190.
- Liu J, et al. Effect of esketamine-based opioid-sparing anesthesia strategy on postoperative pain and recovery quality in patients undergoing total laparoscopic hysterectomy: a randomized controlled trial. Heliyon. 2024;10(3):e24941.
- Vermeulen CKM, et al. Pelvic organ prolapse after laparoscopic hysterectomy compared with vaginal hysterectomy: the POP-UP study. Int Urogynecol J. 2021;32(4):841–850.
- Hodges PW, Sapsford R, Pengel LHM. Postural and respiratory functions of the pelvic floor muscles. Neurourol Urodyn. 2007;26(3):362–371.
- Urvaylıoğlu AE, Kutlutürkan S, Kılıç D. Effect of Kegel exercises on the prevention of urinary and fecal incontinence in patients with prostate cancer undergoing radiotherapy. Eur J Oncol Nurs. 2021;51:101913.
- Cho ST, Kim KH. Pelvic floor muscle exercise and training for coping with urinary incontinence. J Exerc Rehabil. 2021;17(6):379–387.
- Yılmaz S, Terzioğlu F. The effects of Kinesio taping and breathing exercises on pain management after gynaecological abdominal surgery: a randomized controlled study. Int J Nurs Pract. 2023;29(2):e13088.
- Yang EJ, Lim JY, Rah UW, Kim YB. Effect of a pelvic floor muscle training program on gynecologic cancer survivors with pelvic floor dysfunction: a randomized controlled trial. Gynecol Oncol. 2012;125(3):705–711.
- de Oliveira NFF, et al. Pelvic floor muscle training for urinary symptoms, vaginal prolapse, sexual function, pelvic floor muscle strength, and quality of life after hysterectomy: a systematic review with meta-analyses. Braz J Phys Ther. 2024;28(5):101122.
- Mikuš M, et al. Efficacy comparison between Kegel exercises and extracorporeal magnetic innervation in treatment of female stress urinary incontinence: a randomized clinical trial. Medicina (Kaunas). 2022;58(12):1863.
- Ojukwu CP, et al. Comparative effects of selected abdominal and lower limb exercises in the recruitment of the pelvic floor muscles: determining adjuncts to Kegel exercises. J Bodyw Mov Ther. 2022;29:180–186.
- Kegel AH. Progressive resistance exercise in the functional restoration of the perineal muscles. Am J Obstet Gynecol. 1948;56(2):238–248.
- Haylen BT, et al. An International Urogynecological Association/International Continence Society joint report on the terminology for female pelvic floor dysfunction. Neurourol Urodyn. 2010;29(1):4–20.
- Wagner TH, et al. Quality of life of persons with urinary incontinence: development of a new measure. Urology. 1996;47(1):67–71.
- Zhu L, et al. Chinese validation of the Pelvic Floor Impact Questionnaire Short Form. Menopause. 2011;18(9):1030–1033.
- Orhan A, et al. Laparoscopic hysterectomy trends in challenging cases (1995–2018). J Gynecol Obstet Hum Reprod. 2019;48(10):791–798.
- Delgado-Sánchez E, et al. Laparoscopic single-port versus mini-laparoscopic hysterectomy: an international study. Gynecol Obstet Invest. 2022;87(6):381–388.
- Deprest JA, Munro MG, Koninckx PR. Review on laparoscopic hysterectomy. Zentralbl Gynakol. 1995;117(12):641–651.
- Margulies SL, et al. Comparing benign laparoscopic and abdominal hysterectomy outcomes by time. Surg Endosc. 2020;34(2):758–769.
- Toprak N, Sen S, Varhan B. The role of diaphragmatic breathing exercise on urinary incontinence treatment: a pilot study. J Bodyw Mov Ther. 2022;29:146–153.
- Pu CY, et al. Effects of preoperative breathing exercise on postoperative outcomes for patients with lung cancer undergoing curative intent lung resection: a meta-analysis. Arch Phys Med Rehabil. 2021;102(12):2416–2427.e4.
- Huang YC, Chang KV. Kegel exercises. In: StatPearls. StatPearls Publishing; Treasure Island (FL); 2023. PMID: 32310358.
- Cavkaytar S, et al. Effect of home-based Kegel exercises on quality of life in women with stress and mixed urinary incontinence. J Obstet Gynaecol. 2015;35(4):407–410.
- Madill SJ, McLean L. Quantification of abdominal and pelvic floor muscle synergies in response to voluntary pelvic floor muscle contractions. J Electromyogr Kinesiol. 2008;18(6):955–964.
- Madill SJ, Harvey MA, McLean L. Women with SUI demonstrate motor control differences during voluntary pelvic floor muscle contractions. Int Urogynecol J Pelvic Floor Dysfunct. 2009;20(4):447–459.
- Wang Y, Wang J, Li W. Basic vs electromyographic biofeedback-assisted pelvic floor muscle training for the improvement of sexual function after total hysterectomy: a prospective study. Sex Med. 2024;12(3):qfae034.
- Bø K, Driusso P, Jorge CH. Can you breathe yourself to a better pelvic floor? A systematic review. Neurourol Urodyn. 2023;42(6):1261–1279.
- Mundet L, et al. Kegel exercises, biofeedback, electrostimulation, and peripheral neuromodulation improve clinical symptoms of fecal incontinence and affect specific physiological targets: a randomized controlled trial. J Neurogastroenterol Motil. 2021;27(1):108–118.
- Hooley JS. Kegel exercises. J Fla Med Assoc. 1993;80(3):213.
- Begić M, et al. Comparison of Kegel exercises and a combination of Kegel exercises with the use of the KegelSmart biofeedback device in the treatment of static urinary incontinence. Med Glas (Zenica). 2023;20(2):276.
- Harvey MA. Pelvic floor exercises during and after pregnancy: a systematic review of their role in preventing pelvic floor dysfunction. J Obstet Gynaecol Can. 2003;25(6):487–498.