This protocol describes a standardized magnetic resonance imaging–based method for diagnosing epidural lipomatosis and predicting its risk in patients with degenerative lumbar spondylolisthesis.
A subscription to JoVE is required to view this content. Sign in or start your free trial.
Method Article
Magnetic Resonance Imaging-Based Diagnostic Protocol and Risk Prediction for Epidural Lipomatosis in Degenerative Lumbar Spondylolisthesis
* These authors contributed equally
In This Article
Summary
Abstract
This protocol presents a standardized magnetic resonance imaging (MRI)-based diagnostic approach for epidural lipomatosis in patients with degenerative lumbar spondylolisthesis (DLS) and describes the development of a clinical risk prediction model. Consecutive patients with DLS underwent standardized MRI evaluation, including T1-weighted sequences for epidural lipomatosis detection, Goutallier grading of multifidus fatty infiltration, and radiographic assessment. The study cohort was partitioned into a modeling cohort (n = 248) and a validation cohort (n = 106). Independent predictors were identified through univariate screening followed by multivariable binary logistic regression. For transparent reporting, the effects of age and body mass index (BMI) are expressed per 10-year and per 5 kg/m2 increases, respectively. The bedside prediction equation is presented using algebraically equivalent raw-unit coefficients so that age (years) and BMI (kg/m2) can be entered directly. Five independent predictors were identified: age (odds ratio [OR] = 1.510 per 10-year increase), female sex (OR = 2.354), BMI (OR = 1.874 per 5 kg/m2 increase), L5 segment involvement (OR = 3.766), and Goutallier grade 3-4 (OR = 3.184). The model achieved area under the receiver operating characteristic curve values of 0.834 in the modeling cohort and 0.815 in the validation cohort. Calibration and decision curve analyses supported the model as an exploratory clinical decision-support tool; however, external validation is required before broad clinical implementation. This protocol provides a reproducible MRI-based framework for epidural lipomatosis assessment with an integrated bedside prediction tool that combines clinical and radiographic parameters to facilitate standardized evaluation and individualized risk prediction in patients with DLS.
Introduction
Degenerative lumbar spondylolisthesis (DLS) affects 4%–8% of the general population, with prevalence rising markedly after the fifth decade of life1,2. Defined by anterior vertebral displacement over its subjacent counterpart with an intact posterior neural arch, DLS frequently precipitates spinal canal stenosis and neurogenic claudication, substantially compromising patient mobility, muscle strength, and quality of life3. Among the associated imaging features, the epidural lipomatosis sign—characterized as a band-like hyperintense fat signal on midsagittal T1-weighted magnetic resonance imaging (MRI) at the slipped level—is an important radiographic indicator that may facilitate disease recognition and severity assessment. Epidural lipomatosis was traditionally associated with glucocorticoid administration, epidural steroid exposure, or endocrine disturbances such as Cushing’s syndrome4,5,6. However, it is increasingly documented among individuals with obesity or metabolic syndrome without steroid exposure7,8,9,10, suggesting that metabolic and biomechanical factors play a substantial etiologic role. A recent systematic review summarized diverse etiologies and clinical outcomes across reported cases11, and symptomatic improvement following weight reduction has also been documented12. Previous MRI-based grading and quantitative assessment methods for spinal epidural lipomatosis have been reported, including axial epidural fat-to-thecal sac ratio approaches and locoregional grading systems13,14. Nevertheless, a standardized MRI-based protocol specifically for the systematic evaluation of epidural lipomatosis in patients with DLS has not been established. Interpretation therefore remains operator-dependent without consistent diagnostic criteria tailored to this patient population, the clinical determinants distinguishing affected from unaffected individuals remain incompletely characterized, and clinicians lack a practical instrument for risk estimation during the initial evaluation.
To address these gaps, the present protocol establishes a standardized, clinically applicable framework for MRI-based assessment of epidural lipomatosis in patients with DLS. The protocol integrates clinical parameters, predefined MRI diagnostic criteria with specific image acquisition parameters, paraspinal muscle assessment using a spine-adapted Goutallier grading approach, axial confirmatory assessment of thecal sac compromise, and a predictive model for bedside risk stratification. The Manjila grading system is acknowledged as an important locoregional reference because it evaluates craniocaudal extent on sagittal imaging and axial severity using a 3 × 3 grid-based assessment, which may inform surgical planning and facilitate distinction among dorsal, ventral, and circumferential epidural fat distribution14,15,16. The present protocol is not intended to replace existing spinal epidural lipomatosis grading systems; rather, it provides a focused workflow for DLS-associated slipped levels while documenting axial and locoregional features when clinically relevant. This approach is intended to promote a more reproducible evaluation of epidural lipomatosis while supporting standardized imaging assessment and individualized clinical risk estimation in patients with DLS.
Access restricted. Please log in or start a trial to view this content.
Protocol
This MRI protocol is designed for a 1.5 Tesla superconducting scanner equipped with a dedicated 16-channel spine surface coil. The protocol can be adapted to other 1.5 or 3.0 T systems with equivalent hardware. All procedures were performed in compliance with the Declaration of Helsinki and were approved by the Institutional Review Board of Tianjin Union Medical Center (approval number: 2024-IRB-089).
1. Patient Selection and Clinical Evaluation
- Obtain approval from the Institutional Review Board and Ethics Committee before patient enrollment. Ensure that all procedures involving human participants comply with the Declaration of Helsinki. Document the approval number (2024-IRB-089) in all study records.
NOTE: The requirement for individual informed consent may be waived when the study uses fully de-identified pre-existing clinical data and imaging datasets, provided that the waiver complies with institutional policy and national regulations governing the secondary use of clinical data. Obtain explicit approval for the waiver from the ethics committee. Obtain ethics approval before proceeding to patient enrollment. - Screen consecutive patients presenting to the spine surgery department with a confirmed diagnosis of DLS. Review standing lateral or flexion-extension radiographs to confirm anterior vertebral slippage of ≥3 mm or ≥10% of the vertebral body width.
- Verify degenerative changes at the corresponding level, including intervertebral disc degeneration and facet joint hypertrophy17. Confirm the absence of a pars interarticularis defect on lateral radiographs and sagittal MRI.
- Enroll patients aged 18–85 years who underwent standard lumbar MRI (sagittal T1-weighted, sagittal T2-weighted, and axial T2-weighted sequences) within 2 weeks of clinical assessment. Exclude patients who underwent prior spinal surgery or epidural steroid injection within the previous 6 months.
- Measure anterior vertebral slippage on standing lateral or flexion-extension radiographs using the posterior vertebral body line method. Draw a vertical reference line along the posterior cortex of the caudal vertebral body, then measure the perpendicular distance from this line to the posteroinferior corner of the slipped cranial vertebra. Record the displacement in millimeters and, when required, as a percentage of the anteroposterior width of the caudal vertebral body.
- Exclude patients with non-degenerative spondylolisthesis (isthmic, traumatic, pathologic, postoperative, or developmental or anatomic mimics such as a hypoplastic L5 vertebral body and L5–S1 pseudolisthesis), glucocorticoid use for >3 cumulative months during the previous year, or confirmed endogenous hypercortisolism (Cushing’s syndrome, adrenal adenoma, or pituitary adrenocorticotropic hormone-secreting tumor).
- Exclude patients who received anabolic steroid or testosterone replacement therapy within the previous 6 months. Exclude MRI examinations with insufficient image quality, including motion artifact grade II or higher or incomplete lumbosacral coverage.
- Exclude patients with severe cardiopulmonary or renal insufficiency (American Society of Anesthesiologists Physical Status Class IV–V), active infection, or contraindications to MRI.
CAUTION: Complete MRI safety screening before scanner entry. Exclude patients with MRI-incompatible implanted devices. - Grade motion artifact using a four-level image-quality scale: grade 0 = no visible artifact; grade I = mild artifact without diagnostic impairment; grade II = moderate artifact obscuring anatomic margins or measurement landmarks; and grade III = severe artifact rendering the sequence non-diagnostic. Exclude examinations with grade II or III artifact on any sequence required for outcome classification or repeat the affected sequence before including the examination in the study.
- Extract clinical data from the electronic medical record (EMR) database and the Picture Archiving and Communication System (PACS) using a standardized REDCap data collection form completed by two trained research assistants.
- Record age (years), sex (male/female), body mass index (BMI; kg/m2), and slipped segment (L3, L4, or L5).
- Record symptom duration, the presence of neurogenic claudication, and prior conservative treatments.
- Have two trained research assistants independently extract clinical variables from the EMR and PACS into duplicate REDCap forms. Compare the two forms after data extraction and resolve discrepancies by referring to the source records. Refer unresolved discrepancies to a senior investigator for adjudication.
- Identify missing or incomplete variables during REDCap range and completeness checks. Verify missing values against the EMR, PACS, and original imaging reports. Exclude a patient from model development only when a required predictor, outcome variable, or essential MRI sequence cannot be recovered. Do not perform statistical imputation for required model variables.
- Randomly assign eligible patients to the modeling cohort (n = 248) and the validation cohort (n = 106) using a 7:3 allocation ratio in SPSS version 27.0 with a random seed of 42.
- Classify patients within the modeling cohort into epidural lipomatosis and non-lipomatosis groups according to the consensus diagnosis of two senior spine radiologists with >10 years of experience, following the MRI interpretation protocol described in Step 3.
- In SPSS version 27.0, set the random seed to 42, select Transform > Compute Variable, and generate a uniform random variable using RV.UNIFORM(0,1). Sort cases in ascending order according to this variable, assign the first 70% of eligible cases to the modeling cohort and the remaining 30% to the validation cohort, and retain the allocation variable unchanged for all subsequent analyses.
- Use simple random allocation rather than stratified randomization. Do not force balance of baseline demographic, radiographic, or MRI variables during cohort assignment.
- After random allocation, compare baseline demographic, clinical, radiographic, and MRI variables between the modeling and validation cohorts using Student’s t-test or the chi-squared test, as appropriate. Consider the allocation acceptable when no clinically meaningful imbalance is identified, and report the cohort comparability assessment in Table 1.
NOTE: Complete cohort allocation after verifying all eligibility criteria.
| Variable | Modeling Cohort (n = 248) | Validation Cohort (n = 106) | t/χ2 | P Value |
| Age (years) | 67.87 ± 11.39 | 68.16 ± 11.93 | 0.216 | 0.829 |
| Sex, n (%) | 0.002 | 0.966 | ||
| Male | 96 (38.71) | 42 (39.62) | ||
| Female | 152 (61.29) | 64 (60.38) | ||
| Body mass index (kg/m²) | 24.88 ± 3.62 | 24.91 ± 3.48 | 0.077 | 0.939 |
| Slipped segment, n (%) | 0.564 | 0.754 | ||
| L3 | 31 (12.50) | 14 (13.21) | ||
| L4 | 149 (60.08) | 67 (63.21) | ||
| L5 | 68 (27.42) | 25 (23.58) | ||
| Pfirrmann grade, n (%) | 0.104 | 0.991 | ||
| Grade II | 18 (7.26) | 8 (7.55) | ||
| Grade III | 74 (29.84) | 33 (31.13) | ||
| Grade IV | 93 (37.50) | 38 (35.85) | ||
| Grade V | 63 (25.40) | 27 (25.47) | ||
| Goutallier grade, n (%) | 3.022 | 0.388 | ||
| Grade 1 | 78 (31.45) | 27 (25.47) | ||
| Grade 2 | 86 (34.68) | 33 (31.13) | ||
| Grade 3 | 52 (20.97) | 28 (26.42) | ||
| Grade 4 | 32 (12.90) | 18 (16.98) | ||
| Distal facet joint angle (°) | 55.26 ± 6.42 | 55.18 ± 6.39 | 0.111 | 0.912 |
| Distal facet joint effusion (mm) | 0.94 ± 0.21 | 0.93 ± 0.20 | 0.444 | 0.657 |
| Distal disc height (mm) | 9.16 ± 1.92 | 9.20 ± 1.88 | 0.193 | 0.847 |
| Proximal facet joint angle (°) | 49.95 ± 6.03 | 50.03 ± 5.99 | 0.115 | 0.908 |
| Proximal facet joint effusion (mm) | 0.84 ± 0.26 | 0.83 ± 0.25 | 0.237 | 0.813 |
| Proximal disc height (mm) | 8.05 ± 1.52 | 8.08 ± 1.50 | 0.156 | 0.876 |
| Pelvic incidence (PI, °) | 52.18 ± 7.94 | 52.35 ± 7.85 | 0.188 | 0.851 |
| Pelvic tilt (PT, °) | 24.35 ± 7.17 | 24.28 ± 7.23 | 0.080 | 0.936 |
| Sacral slope (SS, °) | 44.91 ± 6.83 | 45.01 ± 6.79 | 0.129 | 0.898 |
| Thoracic kyphosis (TK, °) | 21.18 ± 7.67 | 21.25 ± 7.62 | 0.075 | 0.940 |
Table 1: Baseline characteristics of the modeling and validation cohorts. Continuous variables are presented as mean ± standard deviation (SD), and categorical variables are presented as number (%). Baseline demographic, clinical, radiographic, and magnetic resonance imaging characteristics were compared between the modeling cohort (n = 248) and the validation cohort (n = 106) to assess cohort comparability. Abbreviations: BMI, body mass index; PI, pelvic incidence; PT, pelvic tilt; SS, sacral slope; TK, thoracic kyphosis.
2. MRI Acquisition Protocol
- Perform MRI safety screening using a standardized questionnaire. Identify contraindications, including pregnancy, implanted electronic devices, ferromagnetic foreign bodies, claustrophobia, and a history of allergic reactions to gadolinium-based contrast agents.
- Instruct the patient to remove all metallic objects, including jewelry, watches, piercings, and hearing aids. Position the patient supine on the MRI table.
- Place a soft cushion beneath the knees to achieve approximately 20°–30° of flexion and reduce physiological lumbar lordosis. Position the spine coil centered at the L3 vertebral level to provide coverage from T12 to S3.
- Secure the coil with direct skin contact and eliminate visible air gaps. Place foam padding on both sides to minimize patient motion and provide an MRI-compatible emergency call device.
- Do not administer intravenous gadolinium-based contrast agents. The diagnostic workflow uses non-contrast sagittal T1-weighted, sagittal T2-weighted, and axial T2-weighted sequences.
- Acquire a three-plane scout (localizer) sequence using a gradient-echo sequence with TR = 8 ms, TE = 4 ms, slice thickness = 8 mm, and field of view = 400 mm × 400 mm.
- Verify complete lumbar spine coverage from T12/L1 to the sacrum. Reposition the patient if the lumbosacral junction is not completely visualized.
- Acquire sagittal T1-weighted turbo spin-echo images using TR = 500 ms, TE = 12 ms, field of view = 280 × 280 mm, matrix = 512 × 256, slice thickness = 4 mm, slice gap = 0.4 mm, and NEX = 2.
- Prescribe slices parallel to the spinous processes. Acquire a minimum of 11 sagittal slices to provide complete left-to-right coverage.
NOTE: T1-weighted imaging is the primary sequence for identifying epidural lipomatosis because adipose tissue demonstrates intrinsically high signal intensity relative to surrounding structures. The selected acquisition parameters maximize T1 weighting while maintaining adequate signal-to-noise ratio and spatial resolution. Typical acquisition time is approximately 3–4 min. - When adapting the protocol to an equivalent 1.5 or 3.0 T platform, maintain the required anatomic coverage, sequence type, slice orientation, slice thickness, interslice gap, and diagnostic planes. Optimize the field of view, matrix, number of excitations, echo train length, and parallel imaging factor as needed, provided that epidural fat, thecal sac margins, and slipped-level anatomy remain clearly visible for diagnostic interpretation.
- Prescribe slices parallel to the spinous processes. Acquire a minimum of 11 sagittal slices to provide complete left-to-right coverage.
- Acquire sagittal T2-weighted turbo spin-echo images using TR = 3,500-4,000 ms, TE = 100-120 ms, field of view = 280 mm × 280 mm, matrix = 512 × 256, slice thickness = 4 mm, slice gap = 0.4 mm, and NEX = 2.
- Match slice positioning to the sagittal T1-weighted acquisition to permit direct image comparison.
NOTE: T2-weighted imaging provides complementary anatomical information by improving visualization of cerebrospinal fluid (CSF), the thecal sac, and intervertebral disc morphology. This sequence is also used for Pfirrmann grading of intervertebral disc degeneration. Typical acquisition time is approximately 4–5 min.
- Match slice positioning to the sagittal T1-weighted acquisition to permit direct image comparison.
- Acquire axial T2-weighted fast spin-echo images at each lumbar intervertebral disc level from L1/L2 through L5/S1 using TR = 4,000 ms, TE = 112 ms, field of view = 180 mm × 180 mm, matrix = 320 × 256, slice thickness = 4 mm, slice gap = 0.4 mm, and NEX = 3.
- Prescribe axial slices parallel to each intervertebral disc space. Acquire 6-8 slices through the slipped segment to ensure complete anatomical coverage.
NOTE: Axial T2-weighted imaging permits assessment of epidural fat distribution and thecal sac morphology. The combination of sagittal T1-weighted, sagittal T2-weighted, and axial T2-weighted sequences provides complementary anatomical information for comprehensive evaluation. Total acquisition time for all lumbar levels is approximately 15–20 min. The complete examination, including patient positioning and scout imaging, requires approximately 30–35 min.
- Prescribe axial slices parallel to each intervertebral disc space. Acquire 6-8 slices through the slipped segment to ensure complete anatomical coverage.
- Evaluate image quality before ending the examination. Confirm the absence of motion artifact grade II or higher, complete visualization of the lumbosacral junction, adequate signal-to-noise ratio, and absence of significant wrap-around artifact.
- Repeat any sequence that does not satisfy the image quality criteria. Export all Digital Imaging and Communications in Medicine (DICOM) images to the PACS with metadata preserved.
- Define acceptable image quality as complete coverage from T12/L1 through the sacrum, sharp visualization of the posterior vertebral body cortices and thecal sac margins, absence of wrap-around artifact extending into the spinal canal, and sufficient signal-to-noise ratio to distinguish epidural fat from CSF and paraspinal muscle. Repeat any sequence that does not meet these criteria.
- Use the same four-level motion artifact grading system described in Step 1.3.3. Repeat sequences with grade II or III motion artifact before releasing the patient, or exclude the examination if repeat imaging cannot be performed.
NOTE: Verify image quality before releasing the patient from the scanner.
3. MRI Image Interpretation for Epidural Lipomatosis
NOTE: Epidural lipomatosis is defined as pathological overgrowth of unencapsulated mature adipose tissue within the spinal epidural space. In DLS, this condition contributes to spinal canal stenosis and may necessitate combined decompression during fusion surgery. Accurate diagnosis requires systematic evaluation across multiple imaging sequences and planes.
- Perform image interpretation on a dedicated PACS workstation equipped with a medical-grade diagnostic monitor (minimum 3 megapixels; DICOM Part 14 Grayscale Standard Display Function). Maintain controlled ambient lighting (≤50 lux).
- Load the complete MRI examination. Display sagittal T1-weighted and sagittal T2-weighted images side-by-side in the upper viewing window and axial T2-weighted images in the lower viewing window with synchronized anatomical cross-referencing.
- Use the institutional PACS viewer with DICOM-calibrated measurement tools and synchronized sagittal-axial cross-referencing enabled. Apply consistent window and level settings for side-by-side image comparison during each reading session. Record the PACS vendor and software version in the Table of Materials.
- Identify the slipped vertebral level on the midsagittal T1-weighted image by observing anterior vertebral displacement. Draw a reference line along the posterior cortex of the subjacent vertebral body.
- Measure the perpendicular distance from the reference line to the posterior-inferior corner of the slipped vertebra. Confirm that the measured displacement is ≥3 mm or ≥10% of the vertebral body width.
NOTE: Accurate localization of the slipped level is essential because epidural lipomatosis is evaluated specifically at the level of vertebral slippage. - Perform vertebral slippage measurements using the built-in calibrated electronic caliper tool on the PACS workstation. Verify pixel calibration from the DICOM metadata before measurement and record all distances to the nearest 0.1 mm.
- Measure the perpendicular distance from the reference line to the posterior-inferior corner of the slipped vertebra. Confirm that the measured displacement is ≥3 mm or ≥10% of the vertebral body width.
- Examine the posterior epidural space at the slipped level on the midsagittal T1-weighted image. Identify a band-like or crescent-shaped hyperintense signal located between the thecal sac anteriorly and the ligamentum flavum or spinous process posteriorly.
- Compare the lesion signal intensity directly with subcutaneous fat on the same image. If fat-suppressed sequences are available, confirm signal suppression to verify the fatty nature of the lesion.
NOTE: Differentiate epidural lipomatosis from other T1-hyperintense epidural lesions, including subacute epidural hematoma and proteinaceous fluid collections. Confirm epidural lipomatosis only when the lesion demonstrates signal characteristics identical to subcutaneous fat and conforms to the epidural space. - Use the protocol-defined sagittal criteria as the primary slipped-level screening method and cross-reference positive or equivocal findings on axial T2-weighted images. During prospective implementation, document epidural fat distribution, thecal sac deformation, and compatibility with established MRI-based assessment methods, including axial epidural fat-to-thecal sac ratio approaches and the locoregional Manjila grading system. In the retrospective cohort used for model development, these established grading systems were not applied as independent reference standards, and the original binary outcome was not retrospectively reclassified.
- Compare the lesion signal intensity directly with subcutaneous fat on the same image. If fat-suppressed sequences are available, confirm signal suppression to verify the fatty nature of the lesion.
- Measure the craniocaudal extent of the epidural fat deposit using electronic calipers on the PACS workstation. Place the calipers at the superior and inferior margins of the contiguous epidural fat deposit and record the maximum measurement.
- Confirm that the craniocaudal extent measures ≥5 mm on the same sagittal plane. Use visibility on at least two adjacent sagittal slices only to confirm mediolateral continuity and reduce partial-volume artifacts; do not use adjacent sagittal slices to estimate craniocaudal extent.
- Cross-reference the lesion on sagittal T2-weighted images to evaluate signal characteristics. Review the corresponding axial T2-weighted images to assess circumferential epidural fat distribution and anterior-posterior reduction of the thecal sac.
NOTE: Use a craniocaudal extent of ≥5 mm as the operational slipped-level screening threshold in this protocol. Record the thecal sac anteroposterior diameter and cross-sectional area on axial images as continuous confirmatory measurements. Do not use fixed axial cutoff values as independent reference standards in the present retrospective cohort. - If the fat signal is visible on only one sagittal slice, classify the finding as indeterminate unless axial images demonstrate corresponding epidural fat accumulation and the same-plane craniocaudal extent remains ≥5 mm. This criterion distinguishes the primary craniocaudal measurement from the supportive mediolateral continuity assessment.
- Measure the anteroposterior diameter of the thecal sac on the axial T2-weighted image demonstrating maximal compression at the slipped level by measuring the distance from the anterior to the posterior margin of the dural sac. Measure the cross-sectional area by tracing the inner dural boundary using the PACS region-of-interest tool or the ImageJ polygon selection tool, and record the area in mm2.
- Compare the sagittal extent and axial severity qualitatively with the Manjila grading framework. In this DLS-focused protocol, use the Manjila grading system as a locoregional reference for documentation rather than as the primary outcome definition because the study endpoint is the presence of slipped-level epidural lipomatosis within the prediction model.
- Apply the four original slipped-level criteria used for cohort classification: (1) a band-like or crescent-shaped T1-hyperintense signal in the posterior epidural space at the slipped level; (2) signal intensity identical to subcutaneous fat; (3) a craniocaudal extent ≥5 mm on the same sagittal plane; and (4) reproducibility on adjacent sagittal slices. For prospective clinical implementation, do not rely solely on the sagittal criteria. Confirm corresponding epidural fat accumulation and thecal sac contour deformity on axial images, and document whether the fat distribution is dorsal, ventral, or circumferential.
- Record the axial quantitative findings, including the anteroposterior diameter and cross-sectional area of the thecal sac, together with qualitative compatibility with epidural fat-to-thecal sac ratio-based assessment methods and the Manjila locoregional grading system.
NOTE: The original study was not designed as a diagnostic accuracy study using an established MRI reference standard, and the original DICOM images were not reanalyzed during manuscript revision. Therefore, sensitivity, specificity, and inter-method agreement were not recalculated. These additional axial descriptors are intended to support prospective clinical implementation and do not alter the original study outcome or prediction model.
- Record the axial quantitative findings, including the anteroposterior diameter and cross-sectional area of the thecal sac, together with qualitative compatibility with epidural fat-to-thecal sac ratio-based assessment methods and the Manjila locoregional grading system.
- Have two senior spine radiologists (≥10 years of experience) independently interpret all examinations. Complete a standardized structured reporting form documenting the presence or absence of each diagnostic criterion, slipped vertebral level, maximum craniocaudal extent (mm), and overall diagnosis.
- Resolve disagreements through consensus with a third senior spine radiologist (>15 years of experience) who is blinded to the initial assessments. Calculate interobserver agreement using Cohen’s kappa statistic.
- Use a structured reporting form to document the slipped level, epidural fat distribution (dorsal, ventral, or circumferential), maximum craniocaudal extent, same-plane sagittal measurement, adjacent-slice visibility, axial confirmation, thecal sac diameter, thecal sac cross-sectional area, final diagnosis, and reader confidence. Before formal image interpretation, calibrate all observers using 20 representative training cases that include negative, borderline, and positive examinations.
NOTE: Complete all consensus interpretations before proceeding to statistical analysis.
4. Intervertebral Disc Degeneration Assessment
- Review sagittal T2-weighted MRI images at the slipped segment. Scroll through all sagittal slices and select the image that provides the clearest visualization of the nucleus pulposus.
- Grade intervertebral disc degeneration using the Pfirrmann grading system18. Assign Grade I to discs with homogeneous hyperintense signal identical to CSF, normal disc height, and a clear nucleus-annulus distinction.
- Assign Grade II to discs with inhomogeneous hyperintense signal containing horizontal low-signal bands, preserved disc height, and a clear nucleus-annulus distinction. Assign Grade III to discs with intermediate gray signal, an indistinct nucleus-annulus boundary, and normal or mildly decreased disc height.
- Assign Grade IV to discs with inhomogeneous hypointense dark gray signal, complete loss of the nucleus-annulus distinction, and moderately to severely decreased disc height. Assign Grade V to discs with inhomogeneous hypointense signal, a collapsed disc space, complete loss of the nucleus-annulus distinction, and marked disc space narrowing.
- Have two board-certified radiologists with ≥5 years of musculoskeletal imaging experience independently assign Pfirrmann grades. Record the assigned grade for each evaluated disc.
- Resolve grading discrepancies through adjudication by a third board-certified radiologist. Calculate interobserver agreement using the weighted Cohen’s kappa statistic.
- Blind the radiologists to clinical symptoms, treatment history, epidural lipomatosis status, prediction model variables, and each other’s assessments during independent Pfirrmann grading.
- Perform Pfirrmann grading using the same diagnostic-quality monitors and standardized viewing conditions described in Step 3.1.
NOTE: Complete consensus grading before proceeding to the assessment of paraspinal muscle fatty infiltration.
5. Paraspinal Muscle Fatty Infiltration Assessment
- Review axial T2-weighted fast spin-echo images at the midpoint of the slipped intervertebral disc. Identify the multifidus muscles bilaterally as the deep paraspinal muscles immediately lateral to the spinous process and lamina.
- Review the sagittal images to determine the side of predominant vertebral slippage. Select the multifidus muscle on the corresponding side for assessment.
- Use a spine-adapted Goutallier grading approach derived from the original classification of fatty muscle degeneration and previous applications to the lumbar multifidus19,20. Assign Grade 0 to muscles demonstrating homogeneous low signal intensity, complete absence of fatty streaks, and well-maintained muscle bulk. Assign Grade 1 to muscles containing small linear high-signal fatty streaks occupying <5% of the cross-sectional area.
- Assign Grade 2 to muscles demonstrating clearly visible fatty infiltration involving 5%–50% of the cross-sectional area. Assign Grade 3 to muscles demonstrating ≥50% fatty infiltration with residual muscle tissue.
- Assign Grade 4 to muscles in which the entire cross-sectional area is replaced by fat with no discernible muscle tissue. Dichotomize the results for statistical analysis as Grades 0-2 and Grades 3-4.
NOTE: The multifidus is the largest and most medial paraspinal muscle and serves as the primary dynamic stabilizer of the lumbar segment. Severe fatty infiltration (Grades 3-4) indicates substantial fatty replacement and is treated as the clinically severe category for modeling because it reflects a threshold at which fat occupies at least approximately half of the muscle cross-sectional area. - Specify that the original Goutallier grading system was adapted for lumbar multifidus assessment on axial MRI. Dichotomize Grades 0–2 and Grades 3–4 to distinguish absent-to-moderate fatty infiltration from severe fatty replacement, thereby reducing model complexity while preserving an adequate events-per-variable ratio in the prediction model. Treat the percentage thresholds used in this protocol as operational MRI-based criteria and not as a verbatim reproduction of the original shoulder computed tomography Goutallier classification.
- Determine the side of predominant vertebral slippage by reviewing axial and sagittal images for asymmetric vertebral translation, rotational displacement, or greater lateral recess narrowing. If no side predominates, assess the side demonstrating greater multifidus fatty infiltration. If both sides are symmetric, assess the right multifidus muscle and document this decision.
- Export the axial T2-weighted fast spin-echo DICOM image from the PACS. Open the image in ImageJ software (version 1.53t).
- Select the polygon selection tool and trace the fascial boundary of the target multifidus muscle. Identify the fascial boundary as the thin dark line surrounding the muscle.
- Open Image > Adjust > Threshold. Set the lower threshold to 120 arbitrary units and the upper threshold to the maximum pixel value.
- Select Red as the display color to verify identification of fatty regions. Click Apply to generate the binary mask.
- Use a threshold value of 120 arbitrary units as a scanner- and sequence-specific starting point rather than as a universal threshold. Recalibrate the threshold using representative local images whenever the scanner platform, radiofrequency coil, magnetic field strength, or image acquisition parameters differ from those used in the derivation protocol.
- Do not interpret the threshold value as histologically validated for all imaging systems. Use it as a reproducible image-processing aid and visually verify each binary mask against the original axial T2-weighted image before performing quantitative measurements.
- Open Analyze > Measure in ImageJ. Enable Area, Area Fraction, Limit to Threshold, and Display Label before performing the measurement.
- Record the %Area value as the quantitative intramuscular fat percentage.
- Repeat the measurement after an interval of at least 24 h using the same operator. Calculate the intraclass correlation coefficient (ICC) to assess intraoperator reliability.
NOTE: An ICC >0.90 indicates excellent intraoperator reliability. - During repeat measurements, blind the operator to the initial measurement by storing the original value in a locked REDCap field and reopening the DICOM image as a new measurement session after an interval of at least 24 h.
- Have two board-certified radiologists independently assign Goutallier grades and perform the ImageJ-based quantitative measurements. Provide standardized training using a reference image set before study assessments.
- Resolve disagreements through consensus with a third senior musculoskeletal radiologist. Calculate Cohen’s kappa for Goutallier classification and the intraclass correlation coefficient for quantitative fat percentage.
- Use a 20-case training dataset before study assessment, including five cases each representing minimal, mild, moderate, and severe fatty infiltration. Conduct a calibration session to review reference images, region-of-interest placement, threshold adjustment, and discrepancy-resolution procedures before independent image grading begins.
NOTE: If the interobserver Cohen’s kappa falls below 0.70 or the intraclass correlation coefficient falls below 0.85, conduct a recalibration session before resuming the analysis.
6. Risk Prediction Model Development and Application
- Compile all study variables into a structured dataset using REDCap. Define the outcome variable as binary: 1 = epidural lipomatosis present (all four diagnostic criteria in Step 3.5 fulfilled) and 0 = epidural lipomatosis absent.
- Encode predictor variables as follows: age (years); sex (0 = male, 1 = female); BMI (kg/m2); slipped segment (0 = L3/L4, 1 = L5); and Goutallier grade (0 = Grades 0–2; 1 = Grades 3–4, representing severe fatty infiltration). For reporting, express the effect of age per 10-year increase and the effect of BMI per 5 kg/m2 increase. Use raw-unit coefficients in the bedside prediction equation that are algebraically equivalent to the reported increment-based coefficients.
- Perform data cleaning by identifying missing values, verifying outliers, and confirming that all variables fall within the expected ranges.
- Exclude patients with missing required outcome or predictor variables after verifying the source records. Inspect continuous variables using range checks and scatterplots, correct verified data-entry errors against the source records, retain biologically plausible outliers, and do not impute required model variables.
- Open SPSS version 27.0 and set the random seed to 42 to ensure reproducibility. Perform univariate screening using Student’s t-test for continuous variables and the chi-squared test for categorical variables.
- Select variables with P < 0.05 for multivariable analysis. Fit a multivariable binary logistic regression model using backward stepwise elimination based on Akaike Information Criterion (AIC) minimization.
- Assess model goodness-of-fit using the Hosmer-Lemeshow test. Calculate the variance inflation factor (VIF) for all retained predictors and confirm that all VIF values are <5.
- Exponentiate the regression coefficients to obtain adjusted odds ratios (ORs) with 95% confidence intervals (CIs). Generate a forest plot using the forestplot package in R to visualize the effect sizes (Figure 1). Report the effect of age per 10-year increase and the effect of BMI per 5 kg/m2 increase.
- Use univariate screening followed by backward stepwise selection as an exploratory model-building strategy for this single-center dataset. Interpret the final model as a hypothesis-generating clinical decision-support tool because stepwise selection may produce unstable coefficient estimates and optimistic model performance. Confirm model performance through external validation before clinical implementation.
- Export the cleaned SPSS dataset as a comma-separated values (.csv) file with variable labels removed and coding preserved. Generate the forest plot in R version 4.3.1 using the forestplot package. Confirm that the variable coding in R matches the SPSS coding dictionary before plotting.
- Evaluate model discrimination by calculating the area under the receiver operating characteristic curve (AUC) for the modeling cohort. Estimate the standard error using the DeLong test.
- Evaluate model calibration using calibration plots that compare predicted and observed probabilities across grouped predicted-risk intervals in both the modeling and validation cohorts (Figure 2). Interpret the validation cohort calibration curve cautiously because fewer observations are available at the extremes of predicted risk.
- Perform decision curve analysis using the rmda package (version 1.6) in R version 4.3.1. Compare the prediction model with the treat-all and treat-none strategies across a range of threshold probabilities (Figure 3).
- Validate the final model using the held-out internal validation cohort (n = 106). Report the validation AUC, calibration plot, and decision curve descriptively. Interpret agreement between the modeling and validation cohorts as evidence of internal consistency rather than proof of external validity.
- Perform receiver operating characteristic analysis, calibration plotting, and decision curve analysis in R version 4.3.1. Archive the R scripts, package versions, input dataset, coding dictionary, and output figures with the statistical analysis record.
- Do not use fixed thresholds, such as an AUC difference ≤0.05 or a calibration slope of 0.8–1.2, as formal validation criteria. Report these values descriptively as indicators of internal model stability and state that multicenter external validation is required before broad clinical application.
NOTE: Complete internal validation before applying the model to external clinical datasets.
- Collect the five predictor variables for a new patient with DLS: age (years), sex, BMI (kg/m2), slipped segment (L3/L4 or L5), and multifidus Goutallier grade at the slipped level.
- Calculate the predicted probability using the logistic regression equation expressed in raw clinical units:

Here, z = -5.521 + (0.0412 × age) + (0.856 × sex) + (0.1256 × BMI) + (1.326 × slipped segment) + (1.158 × Goutallier grade) . Enter age in years; code sex as 0 = male and 1 = female; enter BMI in kg/m2; code slipped segment as 0 = L3/L4 and 1 = L5; and code Goutallier grade as 0 = Grades 0–2 and 1 = Grades 3–4. The raw-unit coefficients for age and BMI are algebraically equivalent to coefficients expressed per 10-year and per 5 kg/m2 increases, respectively. - Interpret the predicted probability descriptively as follows: <20% indicates a low estimated probability, 20%–50% indicates an intermediate estimated probability, and >50% indicates a high estimated probability of epidural lipomatosis. Use these categories for risk communication and workflow prioritization rather than treatment selection.
NOTE: Use the prediction model only as a clinical decision-support tool. Do not substitute the model for clinical judgment or radiological interpretation. Do not apply the model to populations outside the derivation cohort, including patients with isthmic spondylolisthesis, postoperative spinal conditions, or steroid-induced epidural lipomatosis, without additional validation. - Enter raw age and BMI values directly into the prediction equation. Algebraic rescaling of the age and BMI coefficients changes only the presentation of the equation and does not alter the predicted probabilities, odds ratios, receiver operating characteristic curves, calibration plots, or decision curve analysis results.
- Report odds ratios consistently as follows: age per 10-year increase; BMI per 5 kg/m2 increase; sex, female versus male; slipped segment, L5 versus L3/L4; and Goutallier grade, Grades 3–4 versus Grades 0–2.
- Use the low-, intermediate-, and high-probability categories as pragmatic clinical communication groups derived from the model-predicted probability distribution and decision curve analysis. Do not interpret these categories as validated treatment thresholds because prospective external validation is required to establish optimal decision thresholds.
- Calculate the predicted probability using the logistic regression equation expressed in raw clinical units:
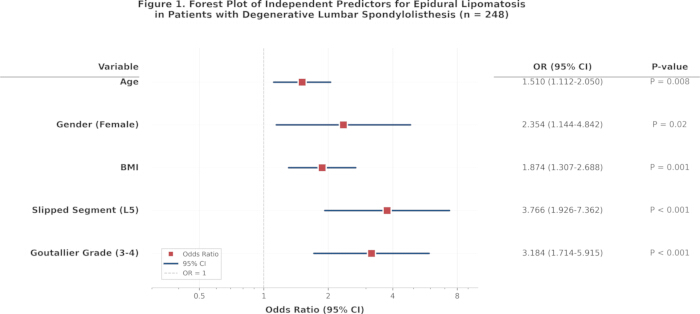
Figure 1. Forest plot of independent predictors of epidural lipomatosis in patients with degenerative lumbar spondylolisthesis. Forest plot showing the adjusted odds ratios (ORs) and 95% confidence intervals (CIs) for the five independent predictors identified by multivariable binary logistic regression. Red squares indicate the adjusted ORs, horizontal blue lines represent the corresponding 95% CIs, and the vertical dashed line indicates the null value (OR = 1). The effect of age is reported per 10-year increase, and the effect of body mass index (BMI) is reported per 5 kg/m2 increase. Please click here to view a larger version of this figure.
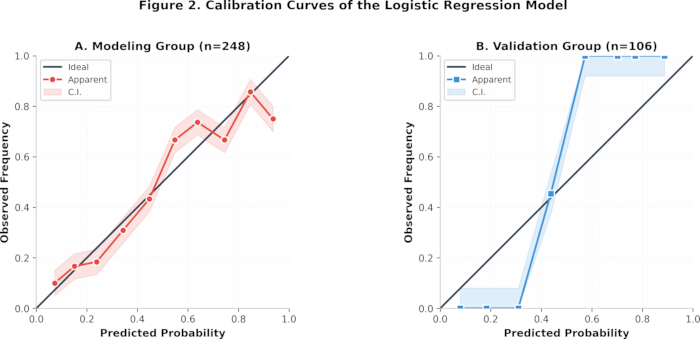
Figure 2. Calibration curves of the logistic regression prediction model. (A) Calibration curve for the modeling cohort (n = 248). (B) Calibration curve for the validation cohort (n = 106). The x-axis represents the predicted probability of epidural lipomatosis, and the y-axis represents the observed frequency. The solid black diagonal line indicates ideal calibration, colored lines with symbols represent the apparent model performance, and shaded regions denote the 95% confidence intervals (C.I.). Please click here to view a larger version of this figure.
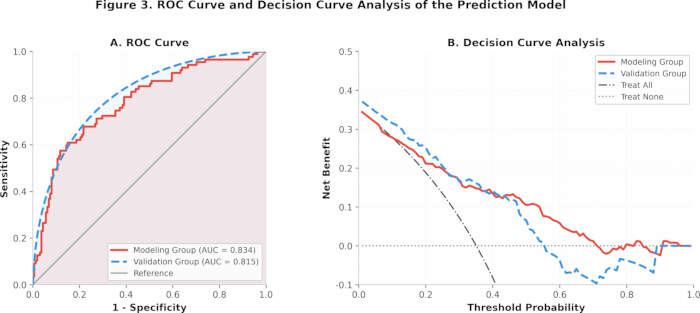
Figure 3. Receiver operating characteristic curve and decision curve analysis of the prediction model. (A) Receiver operating characteristic (ROC) curves for the modeling cohort (area under the curve [AUC] = 0.834) and the validation cohort (AUC = 0.815). The gray diagonal line represents the reference line for a non-discriminatory classifier. (B) Decision curve analysis showing the net benefit of the prediction model across threshold probabilities. The red solid line represents the modeling cohort, the blue dashed line represents the validation cohort, the black dash-dot line represents the treat-all strategy, and the gray dotted line represents the treat-none strategy. Please click here to view a larger version of this figure.
Access restricted. Please log in or start a trial to view this content.
Results
The protocol was applied to 354 consecutive patients with DLS. Random allocation produced a modeling cohort (n = 248) and a validation cohort (n = 106). Comparison of baseline demographic, clinical, radiographic, and MRI characteristics demonstrated no statistically significant differences between the cohorts, indicating comparable patient distributions for subsequent model development and internal validation (Table 1).
Within the modeling cohort, 87 patients were classified a...
Access restricted. Please log in or start a trial to view this content.
Discussion
The present protocol integrates standardized MRI acquisition, structured image interpretation, and quantitative risk modeling into a cohesive clinical decision-support tool for identifying epidural lipomatosis in patients with DLS. Four sequential components comprise the workflow: systematic patient characterization, including demographic and anthropometric variables; standardized sagittal T1-weighted MRI acquisition optimized for epidural fat visualization; structured qualitative assessment of epidural fat deposition an...
Access restricted. Please log in or start a trial to view this content.
Disclosures
The authors declare that they have no competing financial or non-financial interests.
Acknowledgements
The authors thank Shiwu Zhang for technical assistance. This work was supported by the Tianjin Key Medical Discipline Construction Project (Grant No. TJYXZDXK-3-005A-4). The funding body had no role in the study design, data collection, data analysis, decision to publish, or preparation of the manuscript.
Access restricted. Please log in or start a trial to view this content.
Materials
| Name | Company | Catalog Number | Comments |
|---|---|---|---|
| 1.5 Tesla magnetic resonance imaging scanner | Equipment | Siemens Healthineers | Magnetom Aera |
| 16-channel spine surface coil | Equipment | Siemens Healthineers | Standard configuration |
| DICOM Part 14-compliant diagnostic monitor (3 megapixels) | Equipment | Barco NV | Nio Color 3MP, MDNC-3421CN; DICOM calibration via Barco QAWeb Enterprise |
| forestplot R package | Software | R Foundation for Statistical Computing | Version 3.1.3 |
| ImageJ | Software | National Institutes of Health | Version 1.53t |
| PACS workstation | Equipment | Dell Inc. | Precision 3660 Tower Workstation; Windows 10, 64-bit operating system |
| Picture Archiving and Communication System (PACS) | Software | INFINITT Healthcare Co., Ltd. | INFINITT PACS 7.0 |
| R | Software | R Foundation for Statistical Computing | Version 4.3.1 |
| REDCap | Software | Vanderbilt University | Version 13.1 |
| rmda R package | Software | R Foundation for Statistical Computing | Version 1.6 |
| SPSS Statistics | Software | IBM | Version 27.0 |
References
- García-Ramos CL, et al. Espondilolistesis degenerativa lumbar II: tratamiento y controversias. Acta Ortop Mex. 2020;34(6):433-440.
- Rangwalla K, et al. Degenerative lumbar spondylolisthesis: review of current classifications and proposal of a novel classification system. Eur Spine J. 2024;33(5):1762-1772.
- Nava-Bringas TI, et al. Association of strength, muscle balance, and atrophy with pain and function in patients with degenerative spondylolisthesis. J Back Musculoskelet Rehabil. 2014;27(3):371-376.
- Ahmad S, et al. Spinal epidural lipomatosis: a rare association of Cushing’s disease. Endocrinol Diabetes Metab Case Rep. 2020;2020:20-0136.
- Al-Omari AA, et al. Is there a relationship between lumbosacral epidural spinal injections and lumbosacral epidural lipomatosis? A retrospective study. Neurochirurgie. 2025;71(2):101636.
- Jaimes R III, Rocco AG. Multiple epidural steroid injections and body mass index linked with occurrence of epidural lipomatosis: a case series. BMC Anesthesiol. 2014;14:70.
- D’Agostino V, et al. Could spinal epidural lipomatosis be the hallmark of metabolic syndrome on the spine? A literature review with emphasis on etiology. Diagnostics (Basel). 2023;13(2):322.
- Ishihara S, et al. Spinal epidural lipomatosis is a previously unrecognized manifestation of metabolic syndrome. Spine J. 2019;19(3):493-500.
- Abe T, et al. Spinal epidural lipomatosis is associated with liver fat deposition and dysfunction. Clin Neurol Neurosurg. 2019;185:105480.
- Marrone N, et al. Spinal epidural fat as an imaging biomarker of visceral obesity: an MRI-based quantitative analysis. Diagnostics (Basel). 2025;15(19):2490.
- Alomari S, et al. Etiologies and outcomes of spinal epidural lipomatosis: systematic review of the literature and meta-analysis of reported cases. Clin Spine Surg. 2022;35(9):383-387.
- Haggerty T, et al. Significant symptom resolution of spinal lipomatosis with weight loss. Clin Case Rep. 2023;11(9):e7126.
- Borré DG, et al. Lumbosacral epidural lipomatosis: MRI grading. Eur Radiol. 2003;13(7):1709-1721.
- Manjila S, et al. Spinal epidural lipomatosis causing lumbar canal stenosis: a pictorial essay on radiological grading and the role of bariatric surgery versus laminectomy. Cureus. 2022;14(7):e26492.
- Ben Salah MH, Ziaka M. Holothoracic spinal epidural lipomatosis: report of a rare presentation and review of literature. SAGE Open Med Case Rep. 2025;13:2050313X251339051.
- Liu Z, et al. Case report: technical description and clinical evaluation of three cases of unilateral biportal endoscopic decompression for symptomatic spinal epidural lipomatosis. Front Surg. 2024;11:1309202.
- Zhou X, et al. The correlation between radiographic and pathologic grading of lumbar facet joint degeneration. BMC Med Imaging. 2016;16:27.
- Pfirrmann CW, et al. Magnetic resonance classification of lumbar intervertebral disc degeneration. Spine (Phila Pa 1976). 2001;26(17):1873-1878.
- Goutallier D, et al. Fatty muscle degeneration in cuff ruptures. Pre- and postoperative evaluation by CT scan. Clin Orthop Relat Res. 1994;304:78-83.
- Duan PG, et al. Is the Goutallier grade of multifidus fat infiltration associated with adjacent-segment degeneration after lumbar spinal fusion? J Neurosurg Spine. 2021;34(2):190-195.
- James G, et al. Fat infiltration in the multifidus muscle is related to inflammatory cytokine expression in the muscle and epidural adipose tissue in individuals undergoing surgery for intervertebral disc herniation. Eur Spine J. 2021;30(4):837-845.
- Liu Y, et al. Fat infiltration in the multifidus muscle as a predictor of prognosis after decompression and fusion in patients with single-segment degenerative lumbar spinal stenosis: an ambispective cohort study based on propensity score matching. World Neurosurg. 2019;128:e989-e1001.
- Shahidi B, et al. The effect of fatty infiltration, revision surgery, and sex on lumbar multifidus passive mechanical properties. JOR Spine. 2023;6(3):e1266.
- Walter BA, et al. MR elastography-derived stiffness: a biomarker for intervertebral disc degeneration. Radiology. 2017;285(1):167-175.
- Bayerl SH, et al. Treatment results for lumbar epidural lipomatosis: does fat matter? Eur Spine J. 2019;28(1):69-77.
- Ulrich NH, et al. Two-year outcome comparison of decompression in 14 lipomatosis cases with 169 degenerative lumbar spinal stenosis cases: a Swiss prospective multicenter cohort study. Eur Spine J. 2020;29(9):2243-2253.
Access restricted. Please log in or start a trial to view this content.