This study compared five machine learning algorithms for thyroid nodule classification using super-resolution ultrasound features. SVM performed best (accuracy 68.6%, Area Under the Curve 0.690), identifying microcalcification and post-contrast enlargement as key contributors, but the findings require external validation before clinical use.
Research Article
Quantitative Super-Resolution Ultrasound Microvascular Features for Machine Learning-Based Classification of Thyroid Nodules
147 views
⸱
September 11th, 2026
* These authors contributed equally
In This Article
Summary
Abstract
This study compared five machine learning algorithms—Random Forest (RF), Support Vector Machine (SVM), Decision Tree (DT), eXtreme Gradient Boosting (XGBoost), and Gradient Boosting (GB)—for classifying thyroid nodules using quantitative features derived from conventional ultrasound, contrast-enhanced ultrasound (CEUS), and super-resolution ultrasound (SRUS). The retrospective study included 68 thyroid nodules from 63 patients (30 benign and 38 confirmed as papillary thyroid carcinoma [PTC]) and was analyzed using 25 quantitative features via five-fold patient-grouped cross-validation, ensuring that all nodules from the same patient were assigned to the same fold. Model performance was summarized across folds and from pooled out-of-fold (OOF) predictions, and a focused OOF SHapley Additive exPlanations (SHAP) analysis using a permutation-based explainer was performed for the best-performing SVM. SVM achieved the highest mean accuracy (0.686 ± 0.120) and mean Receiver Operating Characteristic-Area Under Curve (ROC-AUC) (0.690 ± 0.164), with a pooled OOF sensitivity of 0.842 and specificity of 0.500, while microcalcification and post-contrast enlargement were identified as the most significant model-specific SHAP contributors. RF offered balanced performance (accuracy 55.9%, sensitivity 55.3%, specificity 56.7%), whereas DT performed poorly (accuracy 0.429, ROC-AUC 0.447), approaching random guessing. The study demonstrated that quantitative SRUS measurements can be incorporated into conventional classifiers; however, the findings remain exploratory and require prospective, multicenter validation with larger cohorts before clinical implementation.
Introduction
Thyroid nodules represent a highly prevalent clinical finding, with detection rates approaching 68% in asymptomatic populations when examined by ultrasound examination1. Recent meta-analyses have revealed that the global prevalence of thyroid nodules has increased from 21.53% during 2000-2011 to 29.29% during 2012-2022, affecting approximately one in every four individuals in the general population2,3. Among these nodules, 7–15% are ultimately diagnosed as thyroid cancer, of which papillary thyroid carcinoma (PTC) represents the predominant subtype4,5. PTC accounts for 80–90% of all thyroid malignancies and has become one of the fastest-growing cancer types, with incidence rates increasing from 4.8 to 14.9 per 100,000 between 1975 and 20126.
Conventional ultrasound remains the cornerstone for thyroid nodule evaluation, offering a non-invasive, cost-effective, and widely accessible diagnostic modality7. Traditional sonographic features suggestive of malignancy include marked hypo-echogenicity, irregular margins, microcalcifications, and taller-than-wide shape8,9. However, it is fundamentally limited by the acoustic diffraction barrier, which restricts spatial resolution to approximately 100 micrometers10. This limitation significantly constrains the ability to visualize microvasculature and assess fine vascular morphology, which are critical parameters for distinguishing between benign and malignant thyroid lesions11. Color Doppler flow imaging (CDFI) and contrast-enhanced ultrasound (CEUS), while improving blood flow detection, can only visualize vessels with flow velocities exceeding 1 cm/s and remain constrained by diffraction-limited resolution12,13.
Super-resolution ultrasound (SRUS), as a transformative technology, overcomes the traditional diffraction limit of conventional ultrasound systems14,15. By leveraging contrast microbubbles as point targets for localization and tracking, SRUS achieves micron-scale spatial resolution, enabling visualization and quantification of microvasculature at an unprecedented level of detail16,17. This technique can measure both microvascular density (MVD) and microvascular flow rate (MFR), providing structural and functional assessments precisely unattainable through non-invasive imaging17,18. Pilot studies have demonstrated that benign thyroid nodules exhibit significantly higher MFR than malignant ones, with mean values of 16.76 ± 6.82 mm/s versus 9.86 ± 4.54 mm/s, respectively19. The introduction of "ultrasound microvasculomics"—a high-throughput extraction of quantitative features from SRUS images—further enhances the potential for precise and personalized microvascular assessment.
Machine learning (ML) has revolutionized medical image analysis, particularly in thyroid nodule characterization20,21. Deep learning models, particularly convolutional neural networks (CNNs), have achieved Receiver Operating Characteristic-Area Under Curve (ROC-AUC) values exceeding 0.90 in previous studies22,23,24. Ensemble machine learning approaches combining multiple algorithms—including Random Forest (RF), Support Vector Machines (SVM), Decision Trees (DT), Gradient Boosting (GB), and eXtreme Gradient Boosting (XGBoost)—have shown promise in improving diagnostic accuracy and robustness across heterogeneous datasets21. As Habchi et al.25 recently reviewed comprehensively, the field of artificial intelligence (AI) for thyroid cancer has rapidly expanded to include visual converters, large language models, and hybrid architectures, reflecting the development of the field towards increasingly complex image-based diagnostic frameworks.
While conventional ultrasound features have been extensively studied in conjunction with AI algorithms, the combination of super-resolution microvascular parameters with ML models remains largely unexplored. Despite the promising potential of SRUS technology and the proven efficacy of machine learning algorithms in medical imaging, several critical questions remain unanswered. First, which machine learning architecture—whether traditional algorithms such as RF and SVM, or advanced ensemble methods like XGBoost and GB—performs optimally when applied to SRUS-derived microvascular features? Second, how do these models compare in terms of sensitivity, specificity, and overall diagnostic accuracy for differentiating benign from malignant thyroid nodules? Third, which microvascular parameters extracted from SRUS imaging contribute most significantly to classification performance? Addressing these questions is essential for establishing evidence-based frameworks for the clinical translation of SRUS-assisted thyroid nodule diagnosis.
Accordingly, this study aims to comprehensively evaluate the performance of five ML algorithms (RF, SVM, DT, XGBoost, and GB) for classifying thyroid nodules using super-resolution ultrasound microvascular imaging data. By systematically comparing these approaches and identifying the most informative microvascular biomarkers, this investigation seeks to advance the diagnostic paradigm for thyroid nodule characterization and contribute to the growing body of evidence supporting the clinical utility of SRUS technology in oncological imaging. We hypothesized that the prespecified 25 variable feature set would provide above-chance discrimination between benign nodules and nodules reported as papillary thyroid carcinoma. Patient-grouped cross-validation was used to reduce information leakage, and a focused SHAP analysis was added to describe how the selected classifier used the measured variables. Both analyses were exploratory.
Protocol
Study design and patient population
This retrospective study analyzed thyroid ultrasound examinations obtained between 13 June 2024 and 13 January 2025. The study protocol was approved by the Ethics Committee of Beijing Friendship Hospital, Capital Medical University (approval No. BFHHZS20240300) and was conducted in accordance with the ethical principles outlined in the Declaration of Helsinki, and informed consent was waived because of the retrospective design. The dataset comprised 68 thyroid nodules from 63 patients (30 benign and 38 malignant), and the nodule was the analytic unit. Reference diagnoses were based on ultrasound-guided fine-needle aspiration cytology (FNAC). The malignant group comprised 38 nodules reported as papillary thyroid carcinoma on FNAC.
Inclusion criteria
Eligible patients were required to meet all of the following criteria: (1) underwent conventional grayscale and Doppler ultrasonography, followed by CEUS with satisfactory image quality permitting subsequent microvascular flow imaging analysis; (2) had a cytopathological diagnosis of PTC confirmed by fine-needle aspiration biopsy, with or without concomitant positive BRAFV600E mutation testing; or had a Bethesda Category III (atypia of undetermined significance) cytology result, but with concurrent positive BRAFV600E mutation testing; (3) had a cytopathological diagnosis of benign, proliferative nodules, adenomatous nodules, or benign follicular nodules in Bethesda Category II without concomitant positive BRAFV600E mutation testing.
Exclusion criteria
Patients were excluded from the study if any of the following conditions were present: (1) poor-quality CEUS images or insufficient microbubble signal precluding reliable microvascular flow assessment; (2) absence of cytological or pathological results; (3) histopathological diagnosis of a rare or special subtype of thyroid carcinoma (e.g. anaplastic variants); or (4) cytological findings suggestive of follicular neoplasm (Bethesda Category IV) or any lesion with indeterminate follicular origin, regardless of mutational status; (5) Hashimoto's thyroiditis
Ultrasound, CEUS, and SRUS acquisition
All examinations were performed with the referenced ultrasound system and a linear-array transducer. Patients were positioned supine with the neck extended. The target nodule was localized and measured on B-mode ultrasound; microcalcifications were recorded, and the same lesion-centered imaging plane was used to assess intranodular vascularity with Color Doppler.
After intravenous access was established, the system was switched to a low-mechanical-index CEUS/URM mode (URM means Ultra-Resolution Microscopy imaging). CEUS was performed with a SonoVue intravenous bolus injection of 1.2 mL immediately followed by a saline flush of 5ml; the onscreen timer and continuous cine acquisition were started with bolus administration. The probe was kept in a fixed plane with minimal pressure, and the patient was asked to avoid swallowing during wash-in and wash-out.
For quantitative CEUS, a lesion-restricted region of interest was used to derive the time-intensity parameters. For SRUS, the URM workflow localized and tracked microbubble signals after motion control and generated vessel-ratio, complexity, microvascular density, perfusion index, and flow velocity measurements. The representative image exports showed settings of VSP 4, RES 2, CTR 3, SM 2, VEN 3, and CPT 10 s; corresponding settings were unavailable for the remaining examinations.
The 25 model-input variables are listed in Table 1 and grouped by acquisition modality: age and sex; B-mode microcalcification; Color Doppler intranodular vascularity; qualitative CEUS; quantitative CEUS; and 11 SRUS microvascular measurements.
Feature selection
All 25 quantitative features were retained in the machine learning models. Only numeric features were used; patient names, registration numbers, and lesion-size fields were excluded. No data-driven feature selection was performed, and the same prespecified predictors were entered into each classifier.
Feature standardization
No transformation, imputation, or global scaling was applied before cross-validation. Standardization was applied only to the radial-basis-function SVM via a StandardScaler pipeline. The scaler was fitted on each fold's training nodules and then applied to that fold's validation nodules. Tree-based classifiers received the original numeric scales:

where x is the original feature value, µ is the training-fold mean, and σ is the training-fold standard deviation. Fold-wise preprocessing prevented validation observations from contributing to the SVM scaling parameters.
Data partitioning
Primary performance evaluation used five-fold StratifiedGroupKFold cross-validation with shuffle = True and random_state = 42. A patient identifier defined 63 groups, and all nodules from the same patient were assigned to the same fold. No patient contributed nodules to both the training and validation subsets of a fold.
Model training and validation
Training protocol
Five classifiers were evaluated: random forest (100 trees; random_state = 42), radial-basis-function SVM (C = 1.0; gamma = scale; probability = True; StandardScaler pipeline; random_state = 42), decision tree (Gini criterion; unrestricted depth; random_state = 42), XGBoost (100 estimators; learning_rate = 0.3; max_depth = 6; subsample = 1.0; colsample_bytree = 1.0; random_state = 42), and gradient boosting (100 estimators; learning_rate = 0.1; max_depth = 3; random_state = 42). No grid search, Bayesian optimization, threshold tuning, or nested model selection was performed.
Cross-validation
Within each of five patient-grouped folds, models were trained on the remaining patient groups and evaluated on the held-out groups. Accuracy, sensitivity, specificity, precision, F1-score, and ROC-AUC were calculated for each fold and summarized as mean ± SD. OOF predictions were pooled across all 68 nodules to generate one cross-validated ROC curve and one confusion matrix for each model.
Performance evaluation
Evaluation metrics
Model performance was assessed within each patient-grouped validation fold and from pooled OOF predictions using the following metrics:
Accuracy: Overall proportion of correct predictions

Sensitivity (Recall): Proportion of actual malignant nodules correctly identified


Specificity: Proportion of actual benign nodules correctly identified
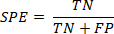
Precision (Positive Predictive Value): Proportion of predicted malignant cases that were truly malignant
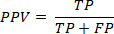
F1-Score: Harmonic mean of precision and recall

Area Under the Receiver Operating Characteristic Curve (ROC-AUC): Measure of the model's ability to discriminate between benign and malignant nodules across all classification thresholds
where TP = true positives (correctly identified malignant nodules), TN = true negatives (correctly identified benign nodules), FP = false positives (benign nodules incorrectly classified as malignant), and FN = false negatives (malignant nodules incorrectly classified as benign).
Confusion matrix analysis
OOF confusion matrices were generated by pooling the predictions made for each nodule only in the fold in which that patient was held out. Thus, each nodule received a prediction from a model trained on nodules from other patients.
Feature importance analysis
For the Random Forest model, feature importance scores were calculated based on the mean decrease in Gini impurity across all decision trees. The top 15 most important features were identified and ranked to determine which microvascular parameters contributed most significantly to classification performance.
Exploratory SHAP analysis
A focused OOF SHAP analysis using a permutation-based explainer was performed for the SVM. For each held-out nodule, only the corresponding training-fold observations were used as the background distribution (128 antithetic permutations; random seed = 20260716). Mean absolute SHAP values summarized the magnitude of contributions, and signed values indicated the direction. The analysis was exploratory and not used to infer causality, identify independent biomarkers, or define clinical thresholds.
Statistical analysis
Comparative analysis
Model performance was summarized descriptively across the five patient-grouped validation folds and in pooled OOF predictions. No formal between-model hypothesis test or P-value-based ranking was performed because the folds are related and the cohort is small.
For baseline group comparisons, normality of continuous variables was assessed within each outcome group using the Shapiro-Wilk test. Welch's t test was used when both groups were compatible with normality; otherwise, a two-sided Mann-Whitney U test was used. Categorical variables were assessed with Pearson's chi-square test, with Fisher's exact test for sparse 2 x 2 tables. P values were two-sided, exploratory, and unadjusted (alpha = 0.05).
Reproducibility
Reproducibility was supported by a specified patient-group definition, fixed random seed (42), fixed classifier configurations, and fold-wise preprocessing. Identifiers were used only for grouping and were not entered as predictors or exported with model outputs.
Results
Patient characteristics and study population
A total of 68 thyroid nodules from 63 patients were included, comprising 30 benign nodules and 38 PTCs. The nodule was the analytic unit, and patient grouping prevented nodules from the same patient from appearing in both the training and validation subsets. Baseline characteristics are summarized in Table 2.
Figure 1 shows technically successful lesion-restricted SRUS/URM reconstructions from a representative benign nodule and a nodule reported as PTC according to ultrasound-guided FNAC. Both examples display the lesion outline, reconstructed microvascular map, and device-generated quantitative overlay. These examples demonstrate successful acquisition and reconstruction in both reference classes but do not, by themselves, establish diagnostic separation or model performance.
Five classifiers were evaluated using five-fold patient-grouped cross-validation of the 68-nodule dataset. Performance metrics are reported as fold mean ± SD and pooled OOF values in Table 3. Figure 2, Figure 3, and Figure 4 show the OOF ROC curves, grouped-fold metric summaries, and OOF confusion matrices.
Figure 4 displays pooled OOF confusion matrices, in which each nodule was predicted only by a model trained without nodules from the same patient. SVM correctly classified 32 of 38 malignant nodules (sensitivity 0.842) but misclassified 15 of 30 benign nodules as malignant (specificity 0.500). The decision tree had the largest number of false-negative and false-positive classifications. These patterns demonstrate why accuracy alone is insufficient and illustrate both successful and suboptimal outcomes.
In the focused OOF SHAP analysis (Figure 5 and Table 4), microcalcification and post-contrast enlargement made the largest model-specific contributions to the SVM malignancy probability, followed by enhancement homogeneity and sex. These findings describe how the fitted SVM used the measured variables in this cohort and do not establish independent clinical importance.
Data availability statement
The data underlying this article will be shared on reasonable request to the corresponding author.
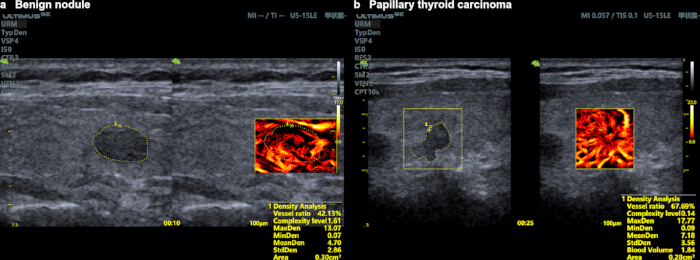
Figure 1. Representative lesion-restricted SRUS/URM images. (A) Benign thyroid nodule. (B) Papillary thyroid carcinoma according to ultrasound-guided FNAC. Each panel shows the lesion outline and corresponding microvascular reconstruction with the device-generated quantitative overlay. The examples illustrate successful acquisition and reconstruction and are not used to estimate diagnostic accuracy. Abbreviations: SRUS = Super-resolution ultrasound; URM = ultra-resolution microscopic imaging; FNAC = fine needle aspiration cytology. Please click here to view a larger version of this figure.
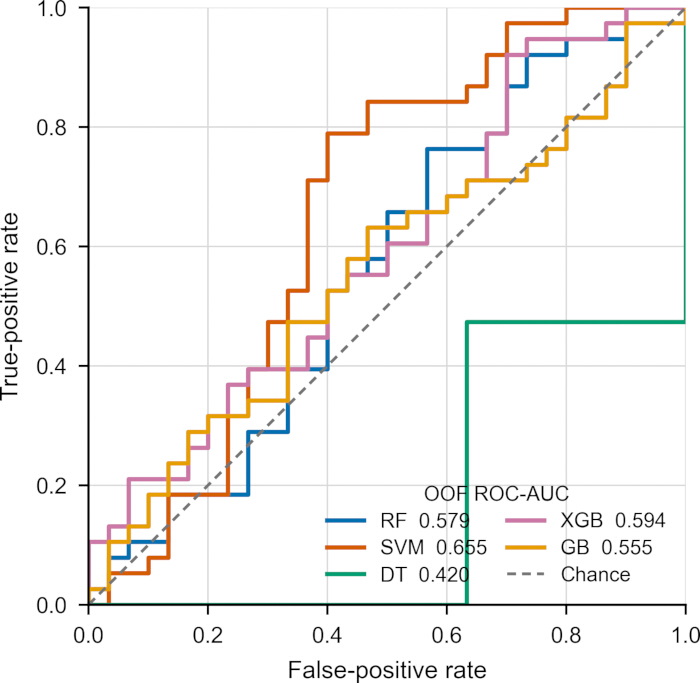
Figure 2. Patient-grouped OOF ROC curves for the five classifiers. Each curve summarizes one held-out prediction per nodule; the dashed diagonal indicates chance discrimination. Abbreviations: RF = Random Forest; SVM = Support Vector Machine; DT = Decision Tree; XGB = eXtreme Gradient Boosting; GB = Gradient Boosting; OOF = Out-of-fold; ROC-AUC = Receiver Operating Characteristic-Area Under Curve. Please click here to view a larger version of this figure.
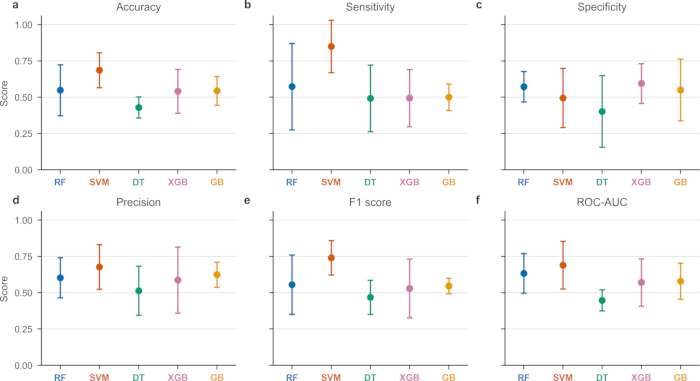
Figure 3. Mean ± SD of accuracy, sensitivity, specificity, precision, F1-score, and ROC-AUC across five patient-grouped validation folds. Abbreviations: SD = standard deviation; ROC-AUC = Receiver Operating Characteristic-Area Under Curve. Please click here to view a larger version of this figure.
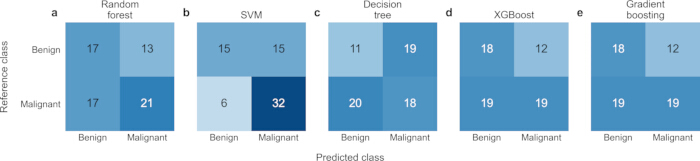
Figure 4. Patient-grouped OOF confusion matrices. Rows show the reference class and columns the predicted class. Each nodule was predicted by a model trained without any nodules from the same patient. Abbreviation: OOF = Out-of-fold. Please click here to view a larger version of this figure.
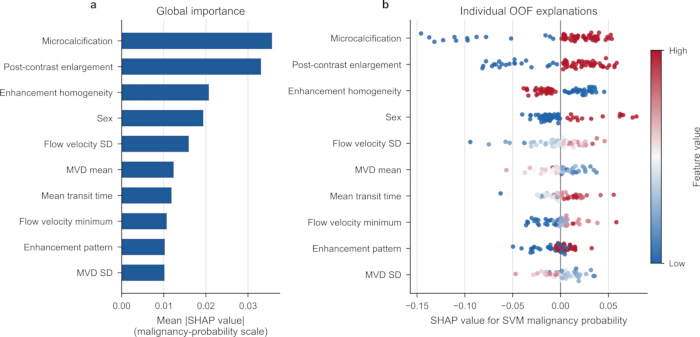
Figure 5. OOF SHAP analysis of the SVM using a permutation-based explainer. (A) The ten largest mean absolute SHAP values are ranked. (B) Signed SHAP values for the same variables across 68 held-out predictions. Abbreviations: OOF = Out-of-fold; SHAP = SHapley Additive exPlanations; SVM = Support Vector Machine; MVD = Microvascular density. Please click here to view a larger version of this figure.
| Acquisition source | Predictors | Model handling |
| Demographics | Age; sex | Numeric worksheet variables; both retained as prespecified model inputs. |
| B-mode ultrasound | Microcalcification | Numeric worksheet variable; no global scaling. |
| Color Doppler | Intranodular vascularity (blood flow) | Classified as a Color Doppler rather than B-mode predictor. |
| Qualitative CEUS | Post-contrast enlargement; enhancement pattern; enhancement homogeneity | Numeric worksheet variables; retained as prespecified inputs. |
| Quantitative CEUS | AUC, peak intensity, time to peak, arrival time, rise time, mean transit time, time to half-peak intensity | Seven time-intensity-curve variables; no imputation or global scaling. |
| SRUS microvascular | Vessel ratio, complexity, MVD maximum/minimum/mean/SD, perfusion index, flow-velocity maximum/minimum/mean/SD | Eleven microvascular variables; no a priori feature selection. |
Table 1: Quantitative variables and preprocessing. The 25 prespecified predictors are grouped by acquisition source: age and sex; B-mode microcalcification; Color Doppler intranodular vascularity; qualitative and quantitative CEUS measurements; and SRUS microvascular measurements. Names, registration IDs, and lesion-size fields were excluded. No values were missing in the 25-variable matrix. Patient identity was used only for grouping. StandardScaler was fitted only within the SVM training folds. Abbreviations: CEUS = contrast-enhanced ultrasound; SRUS = Super-resolution ultrasound; SVM = Support Vector Machine.
| Acquisition source | Characteristic | Benign Nodules | Malignant Nodules | P Value |
| (n = 30) | (n = 38) | |||
| Demographics | Age, years | 48 (42, 55) | 48 (41, 52) | 0.551 |
| Demographics | Sex, n (%) | 0.012 | ||
| Demographics | Female | 26 (86.7%) | 27 (71.1%) | |
| Demographics | Male | 4 (13.3%) | 11 (28.9%) | |
| B-mode Ultrasound | ||||
| B-mode Ultrasound | Microcalcification, n (%) | 0.001 | ||
| B-mode Ultrasound | Absent | 12 (40.0%) | 2 (5.3%) | |
| B-mode Ultrasound | Present | 18 (60.0%) | 36 (94.7%) | |
| Color Doppler | Blood Flow, n (%) | 0.1 | ||
| Color Doppler | Absent | 7 (23.3%) | 8 (21.1%) | |
| Color Doppler | Present | 23 (76.7%) | 30 (78.9%) | |
| Qualitative CEUS | Post-contrast Enlargement, n (%) | 0.001 | ||
| Qualitative CEUS | No | 16 (53.3%) | 5 (13.2%) | |
| Qualitative CEUS | Yes | 14 (46.7%) | 33 (86.8%) | |
| Qualitative CEUS | Homogeneity of Enhancement, n(%) | 0.087 | ||
| Qualitative CEUS | Heterogeneous | 11 (36.7%) | 23 (60.5%) | |
| Qualitative CEUS | Homogeneous | 19 (63.3%) | 15 (39.5%) | |
| Qualitative CEUS | Enhancement Pattern, n (%) | |||
| Qualitative CEUS | Hypoenhancement | 18 (60.0%) | 20 (52.6%) | |
| Qualitative CEUS | Isoenhancement | 3 (10.0%) | 0 (0.0%) | |
| Qualitative CEUS | Hyperenhancement | 9 (30.0%) | 18 (47.4%) | |
| Quantitative CEUS | ||||
| Quantitative CEUS | Area Under Curve (AUC), dB·s | 3255.49 (2457.15, 4048.94) | 3620.76 (3096.36, 4066.75) | 0.201 |
| Quantitative CEUS | Peak Intensity (PI), dB | 48.93 (40.93, 55.78) | 50.22 (42.49, 56.82) | 0.621 |
| Quantitative CEUS | Time to Peak (TTP), s | 17.78 (16.47, 19.30) | 20.42 (17.53, 23.47) | 0.045 |
| Quantitative CEUS | Arrival Time (AT), s | 9.88 (8.23, 11.53) | 9.88 (8.64, 11.53) | 0.1 |
| Quantitative CEUS | Rise Time (RT), s | 8.43 (6.92, 9.55) | 9.55 (7.00, 12.11) | 0.164 |
| Quantitative CEUS | Mean Transit Time (MTT), s | 69.38 (60.17, 87.84) | 82.82 (64.22, 99.15) | 0.102 |
| Quantitative CEUS | Time to Half Peak Intensity (THP), s | 81.62 (70.53, 99.93) | 95.34 (73.60, 109.44) | 0.157 |
| SRUS Microvascular | ||||
| SRUS Microvascular | Vessel Ratio, % | 56.29 (43.34, 71.44) | 57.81 (41.49, 70.24) | 0.772 |
| SRUS Microvascular | Complexity Level | 1.68 (1.59, 1.73) | 1.62 (1.57, 1.69) | 0.083 |
| SRUS Microvascular | Microvascular Density—Maximum | 15.24 (10.59, 17.88) | 13.28 (9.60, 15.92) | 0.142 |
| SRUS Microvascular | Microvascular Density—Minimum | 0.07 (0.05, 0.07) | 0.06 (0.04, 0.07) | 0.385 |
| SRUS Microvascular | Microvascular Density—Mean | 6.20 (3.46, 7.45) | 4.71 (3.74, 6.78) | 0.161 |
| SRUS Microvascular | Microvascular Density—SD | 3.15 (2.12, 3.64) | 2.56 (1.94, 3.04) | 0.085 |
| SRUS Microvascular | Perfusion Index | 6.81 (4.53, 9.05) | 7.12 (4.52, 9.90) | 0.666 |
| SRUS Microvascular | Maximum flow velocity, mm/s | 25.13 (22.24, 26.43) | 26.32 (23.86, 28.00) | 0.152 |
Table 2: Baseline characteristics of 30 benign and 38 malignant thyroid nodules. Baseline demographic and imaging characteristics for benign (n = 30) and malignant (n = 38) nodules. Values are n (%) or median (interquartile range). Reference labels were assigned according to ultrasound-guided FNAC; postoperative histopathology was not available. Abbreviations: EUS = contrast-enhanced ultrasound; SRUS = Super-resolution ultrasound.
| Classifier | Accuracy | Sensitivity | Specificity | Precision | F1-score | ROC-AUC | |
| Random Forest | StratifiedGroupKFold validation | 0.548 ± 0.176 | 0.573 ± 0.297 | 0.572 ± 0.105 | 0.603 ± 0.139 | 0.555 ± 0.204 | 0.633 ± 0.137 |
| pooled OOF | 0.559 | 0.553 | 0.567 | 0.618 | 0.583 | 0.579 | |
| SVM | StratifiedGroupKFold validation | 0.686 ± 0.120 | 0.850 ± 0.180 | 0.495 ± 0.204 | 0.678 ± 0.154 | 0.740 ± 0.118 | 0.690 ± 0.164 |
| pooled OOF | 0.691 | 0.842 | 0.5 | 0.681 | 0.753 | 0.655 | |
| Decision Tree | StratifiedGroupKFold validation | 0.429 ± 0.073 | 0.492 ± 0.229 | 0.402 ± 0.247 | 0.514 ± 0.169 | 0.468 ± 0.117 | 0.447 ± 0.073 |
| pooled OOF | 0.426 | 0.474 | 0.367 | 0.486 | 0.48 | 0.42 | |
| XGBoost | StratifiedGroupKFold validation | 0.541 ± 0.151 | 0.494 ± 0.197 | 0.595 ± 0.137 | 0.587 ± 0.228 | 0.530 ± 0.202 | 0.571 ± 0.163 |
| pooled OOF | 0.544 | 0.5 | 0.6 | 0.613 | 0.551 | 0.594 | |
| Gradient Boosting | StratifiedGroupKFold validation | 0.544 ± 0.099 | 0.500 ± 0.091 | 0.550 ± 0.213 | 0.624 ± 0.087 | 0.546 ± 0.053 | 0.579 ± 0.124 |
| pooled OOF | 0.544 | 0.5 | 0.6 | 0.613 | 0.551 | 0.555 |
Table 3: Five-fold patient-grouped cross-validation performance and pooled OOF performance. All nodules from the same patient were assigned to the same fold. Values are mean ± SD across five StratifiedGroupKFold validation folds. The 68 nodules were drawn from 63 patient groups; each fold held out 12–5 nodules from 12–13 patient groups. Each pooled OOF value uses one prediction per nodule made in the validation fold that excluded all nodules from that patient. Figure 3 reports the corresponding pooled OOF confusion matrices. Abbreviations: OOF = out-of-fold; SVM = Support Vector Machine.
| Rank | Feature | Mean |SHAP| | Fold SD of mean |SHAP| |
| 1 | Microcalcification | 0.0357 | 0.023 |
| 2 | Post-contrast enlargement | 0.0331 | 0.0165 |
| 3 | Enhancement homogeneity | 0.0207 | 0.008 |
| 4 | Sex | 0.0194 | 0.0109 |
| 5 | Flow velocity SD | 0.0159 | 0.01 |
| 6 | MVD mean | 0.0124 | 0.0086 |
| 7 | Mean transit time | 0.0118 | 0.0069 |
| 8 | Flow velocity minimum | 0.0107 | 0.0061 |
| 9 | Enhancement pattern | 0.0103 | 0.0112 |
| 10 | MVD SD | 0.0102 | 0.0077 |
Table 4: Global OOF SHAP feature ranking for the SVM. SHAP values quantify contributions to the SVM malignancy probability. Each nodule was explained once in its held-out patient-grouped validation fold. Global values are mean absolute SHAP values across 68 OOF explanations; fold SD is the SD of the fold-specific mean absolute values across five folds. Rankings are model-specific exploratory summaries and are not causal effects, independent biomarkers, or clinical thresholds. Abbreviations: OOF = out-of-fold; SVM = Support Vector Machine; MVD = microvascular density; SHAP = SHapley Additive exPlanations.
Discussion
Current diagnostic approaches for thyroid nodules rely primarily on conventional ultrasound, which remains inherently operator-dependent and subject to inter-observer variability5 and the inability to visualize microvasculature below the diffraction limit. To our knowledge, our study is the first comprehensive evaluation of multiple machine learning algorithms applied to super-resolution ultrasound (SRUS) microvascular imaging data, achieving an objective quantitative assessment of the risk of PTC in thyroid nodules in a research setting.
The principal contribution of this study is a patient-level analytical framework that integrates localization-based, contrast-microbubble SRUS measurements with B-mode ultrasound, Color Doppler, qualitative and quantitative CEUS, and clinical variables to classify thyroid nodules. The novelty lies in incorporating experimentally measured microvascular information into a prespecified 25-variable multimodal feature set and evaluating it using leakage-resistant patient grouping, rather than in a new classifier architecture. All nodules from the same patient were kept in a single fold; the SVM scaler was fitted only to each training fold; and model assessment used five-fold patient-grouped validation, pooled OOF predictions, and a focused OOF SHAP analysis. Within this framework, SVM had the highest mean accuracy (0.686 ± 0.120) and mean ROC-AUC (0.690 ± 0.164), but its pooled OOF specificity was only 0.500, and performance varied across folds. Taken together, these findings establish a reproducible approach for evaluating combined microvascular and conventional ultrasound data at the patient level, while also highlighting areas that require further refinement before clinical implementation.
Prior thyroid work established the feasibility of contrast-microbubble SRUS and reported group-level differences in microvascular flow in a 24 nodule pilot cohort26. Our study extends that proof of imaging feasibility in three specific respects. First, SRUS-derived vessel density, flow velocity, and perfusion measurements were analyzed alongside B-mode microcalcification, Color Doppler intranodular vascularity, qualitative and quantitative CEUS, and age and sex, rather than as an isolated SRUS comparison. Second, the patient was treated as the unit of separation throughout preprocessing and validation, preventing nodules from the same patient from appearing in both training and validation data. Third, the same patient-grouped framework linked model performance to pooled OOF predictions and a focused OOF SHAP analysis. Together, these elements connect acquisition, quantitative microvascular characterization, model evaluation, and explanation into a single reproducible workflow, providing a foundation on which future studies can build.
We have identified a number of recent studies on the application of AI and deep learning to the diagnosis of malignant thyroid nodules. It is helpful to differentiate our approach from those. Feng et al. developed a multicenter, multimodal model for preoperative papillary thyroid carcinoma risk stratification27, while Gatta et al. synthesized externally evaluated machine-learning models for benign-versus-malignant diagnosis based on conventional thyroid ultrasound images28. Li et al. applied computational single-image super-resolution to conventional ultrasound for nodule localization29, and He et al. used GAN-enhanced B-mode radiomics to predict a nondiagnostic (Bethesda I) FNA result30. Geometry-aware, transfer-learning, and Transformer-based approaches further illustrate the algorithmic diversity of thyroid-ultrasound research31. Those studies use conventional ultrasound images, multimodal clinical or imaging variables, or computationally enhanced image representations; they do not localize injected contrast microbubbles or directly quantify lesion-level microvascular density and flow. Habchi et al. applied a VGG19-based transfer learning framework to conventional thyroid ultrasound images and reported high classification accuracy on a public dataset32. Although their work demonstrated the potential of deep learning in this field, it relied solely on B-mode image features.
By comparison, the specific contribution here is the use of localization-based SRUS to obtain experimentally measured microvascular variables, their integration with conventional ultrasound and CEUS features, and their patient-grouped evaluation. The cited studies remain complementary rather than direct performance comparators because their inputs, endpoints, reference standards, and validation designs differ, and we view this complementarity as a strength, as it suggests multiple independent avenues toward improved risk stratification. Notably, our findings also complement deep learning-based approaches such as Habchi et al.'s geometry-aware Bandelet Transform framework31 and Xu et al.'s transfer learning benchmarks, which focus on conventional B-mode image classification rather than quantitative hemodynamic biomarkers33—fundamentally different input modalities that capture distinct aspects of tumor biology.
Our results indicate significant differences in the performance of the five evaluation classifiers. SVM performs best in terms of average accuracy (0.686 ± 0.120) and ROC-AUC (0.690 ± 0.164), and has the lowest standard deviation in cross-validation, demonstrating its robust performance on small-sample tasks. Pooled OOF validation further confirmed that the SVM's sensitivity was 84.2% (32 out of 38 malignant nodules were correctly identified), and its F1 score was 0.753, the highest among all models. This powerful detection capability has significant value in clinical practice, as a missed diagnosis can lead to serious consequences. However, the specificity was only 50.0% (15 out of 30 benign nodules were misclassified), a pattern that warrants careful interpretation. This modest specificity likely reflects the high-dimensional nature of our dataset (25 predictors vs. 30 benign samples). In such a sparse feature space, the SVM's decision boundary becomes disproportionately influenced by a few benign nodules with malignant-like microvascular features, forcing the classifier to adopt a conservative strategy—labeling ambiguous cases as malignant—to minimize false negatives. From a clinical perspective, this trade-off is acceptable in screening scenarios - the consequences of a missed diagnosis of PTC can be much more serious than those of an unnecessary FNAC. In future research, it is best to prioritize a larger sample cohort, especially by adding more benign samples, and to try cost-sensitive learning or dimensionality reduction methods again to maintain sensitivity while improving specificity.
RF exhibits a mean accuracy (0.548 ± 0.176), which is lower than SVM. However, RF showed balanced pooled OOF performance (accuracy 55.9%, sensitivity 55.3%, specificity 56.7%), which is valuable for clinical decision support systems. Its impurity-based importance ranked mean MVD, mean flow-velocity, and perfusion index among leading variables, indicating a meaningful SRUS signal. XGBoost and Gradient Boosting performed intermediately; neither outperformed RF, likely due to hyperparameter sensitivity given the limited sample size (n = 68) and conservative regularization. DT performed poorly (accuracy 0.429, ROC-AUC 0.447), approaching random guessing—expected given single-tree overfitting. In summary, SVM is preferred when maximizing sensitivity is a priority, while RF offers advantages for balanced performance and interpretability; both need further investigation.
The focused SHAP analysis identified microcalcification, post contrast enlargement, and enhancement homogeneity as the top three predictive factors, followed by sex and SRUS parameters, including blood flow velocity standard deviation, mean MVD, and mean transmit time. Conventional features dominate, but SRUS parameters provide independent incremental information. The importance of SRUS indicators is consistent with their physical advantages. SRUS can achieve a resolution of ~10 µm, while the resolution of traditional Doppler is limited to ~200–300µm. Zhang et al. confirmed malignant nodules have lower flow velocity (9.86 vs.16.76 mm/s, p < 0.01) and MVD19, reflecting PTC's fibrotic and lymphatic-dominant biology. Our SHAP findings are biologically plausible, and concordance with TI-RADS criteria supports clinically meaningful pattern learning8.
Accurate risk stratification has significant implications for patients’ care and clinical decision-making. If high-risk nodules can be identified through ML analysis of SRUS imaging, patients could receive more timely FNAC, reducing anxiety and preventing cancer progression. Selected, low-risk nodules may instead be monitored by ultrasound. Quantitative microvascular measurements may eventually complement conventional observations in that process. However, the present study did not test whether the classifier output improves doctors’ performance, reduces unnecessary FNAC procedures, or changes patient outcomes. The model outputs should therefore not yet guide clinical decisions. Rather, they should be viewed as research-grade tools that demonstrate proof of principle and provide a foundation for prospective evaluation. During analysis, all nodules from a single patient must remain in the same fold, and preprocessing must be fitted using only the training portion of that fold.
Several limitations should be considered. First, this was a retrospective, single-center study of 68 nodules from 63 patients, without external validation; the small sample size may increase the risk of overfitting. Nevertheless, patient-grouped cross-validation provides some reassurance. Second, all reference labels were derived from ultrasound-guided FNAC rather than postoperative histopathology. FNAC provides cytologic evidence but is not equivalent to postoperative histologic confirmation and may introduce classification error, particularly among nodules labeled benign, even though we have restricted the scope of benign nodules and performed BRAFV600E gene testing on all nodules. Third, the malignant group was limited to nodules reported as PTC on FNAC, limiting generalizability to other thyroid malignancies. Fourth, additional clinical factors (thyroid function, family history) were not systematically captured. Finally, no systematic hyperparameter optimization, calibration analysis, or independent image-based deep-learning comparison was performed. Despite these limitations, the consistency of our findings with biological plausibility and the existing literature provides confidence in their validity. Future research should prioritize: (1)prospective multi-center validation in larger cohorts with postoperative histopathology; (2)multimodal fusion integrating SRUS with elastography, conventional ultrasound, (3)serum biomarkers, standardized acquisition protocols, and quality control criteria34, and feature engineering optimization.
In conclusion, this study demonstrates the feasibility of applying conventional machine learning algorithms to quantitative SRUS microvascular measurements to support exploratory classification of thyroid nodules. SVM demonstrated high sensitivity but limited specificity, supporting its potential role as a screening aid rather than a diagnostic replacement. While preliminary, our findings establish a reproducible, leakage-resistant evaluation pipeline and warrant prospective validation in larger cohorts.
Disclosures
The authors have no conflicts of interest to declare.
Acknowledgements
The authors thank the staff of the Department of Ultrasound of Beijing Friendship Hospital, Capital Medical University, for their assistance in patient data collection.
Materials
| Name | Company | Catalog Number | Comments |
|---|---|---|---|
| Decision Tree classifier | scikit-learn | Version 1.5.2 | Machine learning classifier |
| Fine-needle aspiration biopsy needle | Used for ultrasound-guided FNAC | ||
| Gradient Boosting classifier | scikit-learn | Version 1.5.2 | Machine learning classifier |
| Intravenous catheter | Used for contrast administration | ||
| Python | Python Software Foundation | Version 3.11.9 | Programming language used for the machine-learning analysis |
| Random Forest classifier | scikit-learn | Version 1.5.2 | Machine learning classifier |
| SHAP (permutation explainer) | SHAP Developers | Version 0.46.0 | Model explainability analysis |
| SonoVue contrast agent | Bracco | Ultrasound contrast agent for CEUS/SRUS imaging | |
| StandardScaler | scikit-learn | Version 1.5.2 | Feature standardization for the SVM pipeline |
| Sterile normal saline | Used for intravenous flush following contrast injection | ||
| StratifiedGroupKFold | scikit-learn | Version 1.5.2 | Patient-grouped cross-validation |
| Support Vector Machine (SVM) classifier | scikit-learn | Version 1.5.2 | Radial-basis-function kernel classifier |
| U5-15LE linear-array transducer | VINNO Technology | U5-15LE | Linear ultrasound probe |
| ULTIMUS 9E ultrasound system | VINNO Technology | ULTIMUS 9E | Ultrasound imaging system used for B-mode, Color Doppler, CEUS, and SRUS imaging |
| XGBoost | XGBoost Developers | Version 2.1.1 | Gradient boosting framework |
References
- Mu C, et al. Mapping global epidemiology of thyroid nodules among general population: a systematic review and meta-analysis. Front Oncol. 2022;12:1029926.
- Moon JH, et al. Prevalence of thyroid nodules and their associated clinical parameters: a large-scale, multicenter-based health checkup study. Korean J Intern Med. 2018;33(4):753-62.
- Dean DS, Gharib H. Epidemiology of thyroid nodules. Best Pract Res Clin Endocrinol Metab. 2008;22(6):901-11.
- Uppal N, Collins R, James B. Thyroid nodules: global, economic, and personal burdens. Front Endocrinol (Lausanne). 2023;14:1113977.
- Durante C, et al. The diagnosis and management of thyroid nodules: a review. JAMA. 2018;319(9):914-24.
- Lim H, Devesa SS, Sosa JA, Check D, Kitahara CM. Trends in thyroid cancer incidence and mortality in the United States, 1974-2013. JAMA. 2017;317(13):1338-48.
- Gharib H, et al. American Association of Clinical Endocrinologists, American College of Endocrinology, and Associazione Medici Endocrinologi medical guidelines for clinical practice for the diagnosis and management of thyroid nodules—2016 update. Endocr Pract. 2016;22(5):622-39.
- Tessler FN, et al. ACR Thyroid Imaging, Reporting and Data System (TI-RADS): white paper of the ACR TI-RADS Committee. J Am Coll Radiol. 2017;14(5):587-95.
- Petranović Ovčariček P, et al. The 2025 ATA guidelines for differentiated thyroid cancer—ten years of professional debate and measured progress. Eur J Nucl Med Mol Imaging. 2026;53(4):2213-6.
- Christensen-Jeffries K, et al. Super-resolution ultrasound imaging. Ultrasound Med Biol. 2020;46(4):865-91.
- Carmeliet P. Angiogenesis in health and disease. Nat Med. 2003;9(6):653-60.
- Zhang B, et al. Utility of contrast-enhanced ultrasound for evaluation of thyroid nodules. Thyroid. 2010;20(1):51-7.
- Rago T, Vitti P. Role of thyroid ultrasound in the diagnostic evaluation of thyroid nodules. Best Pract Res Clin Endocrinol Metab. 2008;22(6):913-28.
- Xia S, et al. Super-resolution ultrasound and microvasculomics: a consensus statement. Eur Radiol. 2024;34(11):7503-13.
- Song P, Rubin JM, Lowerison MR. Super-resolution ultrasound microvascular imaging: is it ready for clinical use? Z Med Phys. 2023;33(3):309-23.
- Errico C, et al. Ultrafast ultrasound localization microscopy for deep super-resolution vascular imaging. Nature. 2015;527(7579):499-502.
- Couture O, Hingot V, Heiles B, Muleki-Seya P, Tanter M. Ultrasound localization microscopy and super-resolution: a state of the art. IEEE Trans Ultrason Ferroelectr Freq Control. 2018;65(8):1304-20.
- Gao JY, Hou C. Progresses and clinical application of super-resolution ultrasound imaging: a narrative review. Ultrasound J. 2025;17(1):29.
- Zhang G, et al. Ultrasound super-resolution imaging for the differential diagnosis of thyroid nodules: a pilot study. Front Oncol. 2022;12:978164.
- Wildman-Tobriner B, et al. Using artificial intelligence to revise ACR TI-RADS risk stratification of thyroid nodules: diagnostic accuracy and utility. Radiology. 2019;292(1):112-9.
- Toro-Tobon D, et al. Artificial intelligence in thyroidology: a narrative review of the current applications, associated challenges, and future directions. Thyroid. 2023;33(8):903-17.
- Peng S, et al. Deep learning-based artificial intelligence model to assist thyroid nodule diagnosis and management: a multicentre diagnostic study. Lancet Digit Health. 2021;3(4):e250-9.
- Chen C, et al. Deep learning to assist composition classification and thyroid solid nodule diagnosis: a multicenter diagnostic study. Eur Radiol. 2024;34(4):2323-33.
- Bini F, et al. Artificial intelligence in thyroid field: a comprehensive review. Cancers (Basel). 2021;13(19):4740.
- Habchi Y, Kheddar H, Himeur Y, Ghanem MC. Machine learning and transformers for thyroid carcinoma diagnosis. J Vis Commun Image Represent. 2026;115:104668.
- Zhang M, Wang X, Deng Y, Tang K. Multimodal ultrasound integration pathways and paradigm innovations in precision diagnosis and treatment of thyroid cancer. Acad Radiol. 2026. Epub ahead of print.
- Feng JW, et al. Development and validation of the multidimensional machine learning model for preoperative risk stratification in papillary thyroid carcinoma: a multicenter, retrospective cohort study. Cancer Imaging. 2025;25(1):98.
- Gatta E, et al. Machine learning for diagnosis of malignant thyroid nodules based on thyroid ultrasound: systematic review and meta-analysis of studies with external datasets. Eur J Radiol Open. 2026;16:100716.
- Li J, Guo Q, Peng S, Tan X. Super-resolution based nodule localization in thyroid ultrasound images through deep learning. Curr Med Imaging. 2024;20(1):e15734056269264.
- He S, et al. Super-resolution ultrasound radiomics for pre-FNA prediction of nondiagnostic (Bethesda I) thyroid nodules. Front Endocrinol (Lausanne). 2026;17:1710097.
- Habchi Y, Kheddar H, Ghanem MC, Hwaidi J. Adaptive bandelet transform and transfer learning for geometry-aware thyroid cancer ultrasound classification. Diagnostics (Basel). 2026;16(4):554.
- Habchi Y, Kheddar H, Himeur Y. Adaptive bandelet transform and transfer learning for geometry-aware thyroid cancer ultrasound classification [conference paper]. In: 2024 International Conference on Telecommunications and Intelligent Systems (ICTIS). IEEE; 2024. p. 1-6.
- Xu Y, Xu M, Geng Z, Liu J, Meng B. Thyroid nodule classification in ultrasound imaging using deep transfer learning. BMC Cancer. 2025;25(1):544.
- Gou TH, et al. Application value of super-resolution ultrasound imaging in the diagnosis of American College of Radiology Thyroid Imaging Reporting and Data System category 4 and 5 thyroid nodules. Zhongguo Yi Xue Ke Xue Yuan Xue Bao. 2026. doi:10.3881/j.issn.1000-503X.16808.