This in silico study investigated whether restoring HNF4α binding at the F7 promoter could improve modeled F7 transcription in hereditary FVII deficiency. Computational analyses identified key regulatory motifs and strong gene-expression correlations. Simulations predicted CRISPRa targeting may restore F7 transcription to ~87% of normal levels, warranting experimental validation.
Research Article
In Silico CRISPR Restoration of F7 Promoter Activity in Hereditary Factor VII Deficiency
In This Article
Summary
Abstract
Hereditary Factor VII (FVII) deficiency is associated with reduced F7 gene expression and impaired coagulation, and regulatory mechanisms controlling F7 transcription remain incompletely characterized. This study aimed to computationally explore whether restoration of predicted HNF4α binding at the F7 promoter, through transcription factor modulation, promoter motif correction, or CRISPR activation (CRISPRa)-mediated epigenetic regulation, could theoretically enhance predicted F7 transcription in hereditary FVII deficiency. An entirely in silico pipeline was developed to characterize the F7 promoter regulatory landscape by identifying conserved transcription factor binding motifs using JASPAR, FIMO, and UCSC Genome Browser datasets. Liver expression correlations were evaluated using GTEx transcriptomic data, while chromatin accessibility and regulatory context were assessed using ENCODE ChIP-seq, ATAC-seq, and ChromHMM/Segway annotations. A hepatic regulatory network was constructed in CellDesigner to simulate the predicted effects of HNF4α loss on F7 transcription over a 24-h period. Six high-confidence HNF4α binding motifs were identified within the proximal F7 promoter, including three regions overlapping known disease-associated variants. Liver expression analyses demonstrated positive correlations between F7 and HNF4A (r = 0.68) and HNF1A (r = 0.61). Computational modeling predicted that CRISPRa targeting of HNF4α-associated regulatory regions could increase simulated F7 transcription toward approximately 87% of wild-type levels under the modeled conditions, with predicted target specificity. Overall, this purely computational study presents an integrated multi-omic framework for prioritizing promoter-targeted regulatory strategies in hereditary FVII deficiency. By combining transcription factor motif analysis, chromatin annotation, transcriptomic correlation, regulatory network modeling, and CRISPR guide prioritization within a unified pipeline, the study generates experimentally testable hypotheses while providing a systematic approach that extends beyond previous single-variant or isolated experimental analyses.
Introduction
Factor VII (FVII) is a vitamin K–dependent serine protease that initiates the coagulation cascade through the extrinsic pathway. Following vascular injury, activated FVII (FVIIa) complexes with tissue factor to trigger thrombin generation and fibrin clot formation. The F7 gene, located on chromosome 13q34, encodes FVII and is expressed predominantly in hepatocytes1. Pathogenic variants in F7 cause hereditary Factor VII deficiency, a rare autosomal recessive bleeding disorder with an estimated incidence of approximately 1 in 500,000 individuals worldwide2. Clinical manifestations vary widely and generally correlate with residual circulating FVII activity3.
Although most cases are attributed to missense, nonsense, or splice-site mutations within the F7 coding region, promoter variants have also been reported to reduce gene expression without altering protein structure4. For example, the c.-94C>G promoter variant disrupts a critical Sp1 binding site within the proximal F7 promoter, impairing transcription factor binding and markedly reducing F7 transcription. In addition, promoter mutations affecting HNF-4 binding sites have also been shown to decrease promoter activity, highlighting the importance of intact transcription factor binding for normal F7 expression5. The c.-61T>G variant has been reported to disrupt an HNF4 binding site, illustrating that distinct promoter variants can impair F7 transcription through different transcription-factor-dependent mechanisms6.
Expression of F7 is tightly controlled by hepatocyte-enriched transcription factors, particularly Hepatocyte Nuclear Factor 4 alpha (HNF4α) and Liver Factor A1 (HNF1α)7,8,9. HNF4α is a nuclear receptor that binds DNA as a homodimer and regulates numerous hepatic genes involved in metabolism and coagulation10. HNF4α is a nuclear transcription factor that activates liver-specific genes through interactions with coactivators and chromatin remodeling complexes11. Experimental studies, including mouse knockout models, indicate that loss of HNF4α leads to broad hepatic dysfunction and reduced expression of multiple coagulation factors, including FVII12. In addition, cooperative activity of HNF4α has been reported to enhance promoter activity in several liver-expressed genes13. Together, these observations suggest that impaired transcription factor binding may contribute to reduced F7 expression in promoter-variant carriers.
Epigenome-modulating approaches such as CRISPR activation (CRISPRa) have emerged as potential tools for upregulating endogenous gene expression without altering DNA sequence. CRISPRa employs sequence-specific guide RNAs (gRNAs) that direct catalytically inactive Cas9 (dCas9) to selected genomic loci. The dCas9 protein is fused to transcriptional activation domains such as VP64, a tetrameric herpes simplex virus VP16 activation domain, or p300, a histone acetyltransferase that promotes transcription through chromatin remodeling14. Recent work, including that of Belali et al., further supports the central regulatory role of HNF4α in coagulation-related gene networks, reinforcing interest in transcription factor–guided modulation strategies15. Previous studies have demonstrated that Transcription Activator-Like Effector (TALE)-based and CRISPRa-mediated rescue of impaired F7 promoter activity16,17,18. However, these studies evaluated individual promoter-targeting strategies, whereas the present work integrates motif prediction, chromatin annotation, transcriptomic correlation, regulatory network analysis, and gRNA prioritization within a single hypothesis-generating computational framework. Nevertheless, the therapeutic relevance of HNF4α in F7 promoter regulation remains incompletely characterized, particularly from an integrative systems perspective.
Unlike previous studies that focused on individual promoter variants or isolated experimental observations, the present framework integrates transcription factor motif prediction, transcriptomic correlation, chromatin accessibility, regulatory network analysis, CRISPR guide design, and genome-wide specificity assessment within a single computational workflow. This integrated strategy enables systematic prioritization of candidate regulatory interventions before experimental validation, thereby providing a more comprehensive platform for hypothesis generation than analyses based on any single data type alone.
Protocol
The databases used are listed in the Table of Materials.
Promoter sequence retrieval and computational annotation
The human F7 promoter region (GenBank accession: NG_009262.1) was retrieved from NCBI using the GRCh38/hg38 reference genome assembly. All analyses were performed in silico within a reproducible computational framework. The promoter was defined as −1000 to +100 bp relative to the annotated transcription start site (TSS) obtained from the UCSC Genome Browser (RefSeq annotation). Sequence extraction was performed in FASTA format and cross-validated against Ensembl release 109 for coordinate consistency. The promoter sequence was computationally annotated for transcription factor binding sites (TFBS), known variants, CpG content, and GC composition using custom Python scripts (v3.10) and Biopython (v1.81). All annotations represent computational predictions and were not experimentally validated.
Transcription factor binding site (TFBS) analysis
Predicted HNF4α and HNF1α binding motifs were identified using the JASPAR 2022 CORE vertebrate database with position weight matrices MA0114.4 (HNF4A) and MA0046.2 (HNF1A). Motif scanning was performed using FIMO (MEME Suite v5.5.0). The workflow included promoter FASTA upload, PWM selection, promoter-specific nucleotide background modeling, and scanning of both DNA strands. Motif significance was assessed using a threshold of p ≤ 1 × 10⁻4, followed by Benjamini–Hochberg correction. FIMO outputs were exported as TSV files, and predicted motifs with adjusted q values <0.05 were retained. Predicted TFBS coordinates were intersected with disease-associated variants from dbSNP build 155 and HGMD Professional (2023.2) using BEDTools (v2.30). The disease-associated c.-61T>G promoter variant was evaluated in the context of its reported proximity to an HNF4α binding site, suggesting a potential regulatory role in F7 promoter activity. Computational motif overlap was interpreted as a prediction and was not considered evidence of experimentally confirmed TF disruption. Identified motifs represent predicted transcription factor binding potential rather than experimentally confirmed occupancy.
Evolutionary conservation and epigenetic annotation
Evolutionary conservation of predicted regulatory regions was assessed using PhyloP and PhastCons scores from the UCSC 100-vertebrate alignment (hg38). Regions with PhastCons scores ≥0.7 were prioritized as conserved regulatory elements.
Regulatory chromatin context was evaluated using the UCSC Genome Browser and ENCODE datasets. The hg38 assembly was used with relevant track groups enabled, including ENCODE transcription factor ChIP-seq, H3K27ac, H3K4me3, DNase I hypersensitivity, ATAC-seq, ChromHMM, and Segway annotations. Signal tracks were exported as BED and bigWig files where applicable. ENCODE bigWig datasets were processed using deepTools (v3.5.1), and replicate signals were averaged before downstream analysis. Predicted TF binding sites were compared with available HNF4α/HNF1α ChIP-seq peaks using a ±50 bp overlap window. These analyses were used to infer regulatory potential and do not demonstrate functional binding in vivo.
Gene expression correlation analysis
Liver RNA-seq expression data were obtained from GTEx v8 (226 liver samples). TPM-normalized expression values for F7, HNF4A, and HNF1A were log2(TPM+1) transformed. Pearson correlation analysis was performed in R (v4.3.1) using the cor.test function with two-tailed testing. Multiple comparisons were corrected using the Benjamini–Hochberg method where applicable. Correlations were interpreted as associative relationships and not evidence of direct regulatory causality.
Regulatory network construction
Protein interaction and regulatory network information were retrieved from STRING v11.5 using a minimum interaction confidence score of 0.7. STRING-generated TSV interaction files were imported into Cytoscape v3.9.1 for network construction and visualization. Network modules were identified using the MCODE plugin using the following parameters: Degree cutoff = 2; Node score cutoff = 0.2; K-core = 2; Maximum depth = 100.
Significant clusters were exported for downstream interpretation. Functional enrichment was performed using STRING enrichment analysis with a false discovery rate (FDR) <0.05. Network analyses represent predicted and curated biological relationships and were used for hypothesis generation.
Computational modeling of transcriptional activation
A dynamic regulatory model was constructed using CellDesigner v4.4 to simulate predicted effects of HNF4α modulation on F7 transcription. The model was represented in SBML format and simulated using a deterministic ordinary differential equation (ODE)-based solver. Model inputs included: (1) Normalized HNF4A, HNF1A, and F7 expression values derived from GTEx liver data; (2) Relative transcription factor binding affinities derived from FIMO motif scores (scaled 0–1); (3) Chromatin accessibility weights derived from ENCODE ATAC-seq and DNase-seq signal intensity; (4) Active chromatin parameters incorporating H3K27ac and H3K4me3 profiles.
Simulations were performed over 24 h using adaptive numerical integration, with outputs recorded at predefined intervals. Knockout conditions were modeled by setting transcription factor activity to 0%. Output variables included normalized F7 transcript abundance, relative promoter activation state, and transcription factor activity. All expression outputs were normalized relative to the unperturbed baseline model (100%). Parameters unavailable from public datasets were estimated using sensitivity-guided tuning and are provided in Supplementary Table 1. All model outputs represent computational predictions under defined assumptions and do not represent experimentally measured biological responses.
CRISPRa gRNA design for HNF4α motifs
CRISPR activation (CRISPRa) targets were designed entirely computationally using Benchling (2024 build) and CRISPOR. The F7 promoter region (−500 to +100 bp relative to TSS) was scanned for SpCas9 NGG PAM sites within ±200 bp of high-confidence HNF4α motifs. Candidate guides were filtered according to: (1) Doench 2016 on-target score ≥50; (2) CFD off-target score ≥70; (3) GC content 40%–60%; (4) Absence of poly-T sequences ≥4 bp.
Predicted chromatin accessibility from ATAC-seq and nucleosome occupancy estimates from NuPoP were incorporated to prioritize accessible regulatory regions. Potential CRISPRa responses using dCas9-VP64 and dCas9-p300 architectures were computationally modeled and interpreted as predicted activation potential only.
CRISPR-Cas9 editing design for motif restoration
To evaluate the theoretical feasibility of correcting a promoter variant associated with disrupted HNF4α recognition, the c.-61T>G variant was selected as the representative HNF4α-associated regulatory variant. Two SpCas9 guide RNAs, designated gRNA-L and gRNA-R, were designed to flank the c.-61T>G variant and were evaluated independently and as a combined dual-guide configuration. Single-stranded HDR repair templates containing the reference promoter sequence at the variant position were modeled with 100-bp homology arms. Candidate guides were evaluated computationally using CRISPOR and Cas-OFFinder for predicted specificity, while CRISPRscan was used to estimate predicted cleavage activity. ICE-based modeling was subsequently used to estimate theoretical editing outcomes for the individual and combined guide configurations. The combined gRNA-L/gRNA-R configuration was treated as a dual-guide strategy and not as a third independent guide. All predicted editing efficiencies and outcomes represent computational estimates and do not establish experimental HDR efficiency, restoration of HNF4α binding, correction of the promoter sequence in cells, or recovery of F7 transcription.
Epigenetic editing simulation and chromatin accessibility modeling
Chromatin accessibility surrounding candidate CRISPRa sites was evaluated using ENCODE ATAC-seq and DNase-seq datasets from HepG2 cells. Signal intensity was quantified within 100 bp windows centered on each candidate guide sequence. ChromHMM (15-state model) and Segway annotations were used to classify local regulatory chromatin states.
A composite activation score integrating (1) motif proximity, (2) ATAC-seq accessibility, (3) DNase I hypersensitivity, (4) H3K27ac enrichment, and (5) H3K4me3 enrichment was calculated to rank candidate CRISPRa targets. Predicted transcriptional responses were simulated under modeled chromatin conditions and interpreted as theoretical estimates.
Off-target risk evaluation for CRISPRa and HDR strategies
Genome-wide specificity assessment was performed using CRISPOR CFD scoring, Cas-OFFinder enumeration, and CRISPRscan predictions. Candidate guides were filtered to minimize predicted off-target interactions, particularly within transcriptionally active regions.
Additional exclusion criteria included: (1) predicted off-target sites within ±1 kb of annotated TSS regions, (2) overlap with shared promoter regions, (3) overlap with enhancer elements, (4) regulatory regions associated with neighboring liver-expressed genes based on ChromHMM and Segway annotations.
Composite specificity scores integrating guide efficiency, predicted off-target burden, and chromatin context were calculated to prioritize candidate designs. This multilayer computational screening strategy estimates theoretical specificity and does not replace experimental genome-wide off-target validation. A summary of the computational workflow, including input datasets, analytical tools, filtering criteria, and output checkpoints, is provided in Supplementary Table 2.
Critical computational parameters
Reliable performance of the computational pipeline depended on several predefined parameter settings. Motif detection was optimized using FIMO (p < 1 × 10⁻4; q < 0.05) with JASPAR HNF4A and HNF1A position weight matrices. Chromatin integration required consistent hg38 coordinates and concordant evidence from ENCODE ATAC-seq, DNase-seq, H3K27ac, and H3K4me3 datasets. Regulatory networks were generated using STRING interactions (confidence ≥0.70) and MCODE clustering in Cytoscape. Dynamic simulations were performed in CellDesigner using a deterministic ODE solver with GTEx-derived expression values, FIMO motif scores, and ENCODE chromatin accessibility weights. Candidate CRISPRa guide RNAs (gRNAs) were prioritized based on Doench 2016 on-target score (≥50), CFD specificity score (≥70), GC content (40%–60%), minimal predicted off-targets, and localization within accessible chromatin. Workflow completion was verified by successful motif identification, network generation, chromatin annotation, gRNA selection, and stable simulation outputs.
Results
Prediction of functional HNF4α and HNF1α binding motifs in the F7 promoter
Computational motif scanning using FIMO and the JASPAR 2022 database predicted three high-confidence HNF4α and three HNF1α binding motifs within the 1 kb upstream promoter region of the F7 gene. The predicted motifs were located within conserved promoter regions and corresponded to hepatocyte nuclear factor recognition sequences (p < 1 × 10⁻4). Notably, two of these predicted motifs were located in proximity to previously reported mutations associated with hereditary Factor VII deficiency. The HNF4α-associated motif was located near the c.-61T>G promoter variant. ChIP-seq tracks from ENCODE (HepG2) demonstrated enrichment of HNF4α and HNF1α binding signals at these promoter regions, supporting their putative regulatory relevance within this computational framework (Figure 1).
Correlation between F7 and hepatic transcription factor expression
Transcriptomic data from GTEx liver tissue samples (n = 226) revealed a significant positive correlation between F7 and HNF4A expression (Pearson’s r = 0.68, p < 0.001), and between F7 and HNF1A expression (r = 0.61, p < 0.01). These correlations recapitulate known regulatory relationships between F7, HNF4α, and HNF1A17,18. Within the computational framework, they serve as an internal validation step, supporting that the pipeline reflects established biology before extending it to promoter variant contexts (Figure 2).
Regulatory network and chromatin landscape analysis
Network modeling with STRING and Cytoscape predicted that HNF4α and HNF1α act as central nodes within a hepatic transcriptional network enriched for coagulation genes. Epigenomic data from ENCODE confirmed that the F7 promoter in HepG2 and primary liver samples overlaps regions marked by active histone modifications (H3K4me3, H3K27ac) and open chromatin (Supplementary Table 3 and Figure 1). Comparative transcriptomic datasets showed that F7, HNF4A, and HNF1A are co-expressed in HepG2, Huh7, and Hep3B, although with variable expression levels across lines. Where available, promoter accessibility and histone profiles in Huh7 and Hep3B were broadly concordant with HepG2, supporting the consistency of the active promoter chromatin landscape across hepatocyte-derived cell lines (Supplementary Figure 1), whereas non-hepatic cell lines (e.g., K562, HeLa) showed substantially reduced chromatin accessibility. These findings support the liver-specific regulation of F7 while highlighting variability among hepatic models (Figure 3).
CRISPRa gRNA design and simulated transcriptional reactivation
Four gRNAs were designed to target the proximal F7 promoter near high-scoring HNF4α motifs (Supplementary Table 4). All met the predefined criteria for high on-target activity (>60) and minimal predicted off-target effects. Simulations predicted that dCas9-VP64 and dCas9-p300 individually increased predicted F7 expression to 68% and 76% of the wild-type reference, respectively, while combined dCas9-VP64+p300 activation increased predicted expression to 87% of wild-type levels (Figure 4B; Supplementary Table 5). Here, wild-type promoter activity was defined as 100% (1.0), and all simulated values were normalized to this reference. These results indicate that combined CRISPRa activation could potentially compensate for transcriptional repression caused by promoter mutations, although the values represent computational predictions rather than experimentally measured expression. Importantly, the dependency of CRISPRa-mediated F7 restoration on endogenous HNF4A activity was explicitly evaluated through dynamic regulatory simulations. CRISPRa enhanced F7 transcription but remained dependent on functional HNF4A; therefore, the predicted restoration was substantially diminished under conditions of impaired HNF4A availability or function (Figure 4).
In silico CRISPR-Cas9 HDR strategy for motif restoration
For promoter variants reported to affect HNF4α recognition, the c.-61T>G variant was selected as the representative HNF4α-associated variant, whereas c.-94C>G was treated separately as a known Sp1-site variant rather than as an established HNF4α-disrupting mutation. CRISPR-Cas9 HDR correction strategies were modeled in silico for the HNF4α-associated variant. Two gRNAs, designated gRNA-L and gRNA-R, were selected to flank the variant site and were evaluated individually and in combination. The corresponding single-stranded HDR repair template incorporated the reference promoter sequence containing the canonical HNF4α binding site, with 100-bp homology arms. In silico assessment using Cas-OFFinder and CRISPRscan was used to evaluate predicted guide specificity and cleavage activity, while ICE-based modeling was used to estimate theoretical editing outcomes. The predicted editing efficiencies varied according to guide configuration, with the combined gRNA-L/gRNA-R design evaluated as a dual-guide strategy rather than as a third independent gRNA. Although c.-94C>G was retained in the broader promoter analysis because of its established regulatory relevance, it was not interpreted as an HNF4α motif-disrupting variant in the HDR model. These results represent computational predictions of potential promoter sequence correction and do not establish experimental HDR efficiency, restoration of HNF4α binding, or recovery of wild-type F7 promoter activity (Figure 5).
Chromatin accessibility and epigenetic activation potential
Analysis of ATAC-seq and DNase I hypersensitivity data in HepG2 cells predicted that all CRISPRa target sites resided within regions of high chromatin accessibility. Integration of these findings with HNF4α ChIP-seq and H3K27ac enrichment further supported the activation potential of these sites. Simulated epigenetic editing predicted favorable chromatin remodeling outcomes and projected enhanced transcription factor recruitment upon CRISPRa-mediated activation (Figure 6).
Assessment of genome-wide specificity of gRNA designs
In silico CRISPRa gRNA screening revealed high sequence specificity across both CRISPRa and HDR approaches (Supplementary Table 6). CRISPOR and Benchling analysis excluded any gRNAs with high-likelihood off-targets within transcriptionally active promoter regions. For CRISPRa designs, ENCODE-derived ATAC-seq and H3K27ac data indicated that all selected target sites were located within F7-specific open chromatin. No candidate gRNAs overlapped with enhancer regions or shared promoter elements. ChromHMM and Segway chromatin state annotations further supported the classification of these regions as active promoters specific to hepatocytes, with no overlap with neighboring co-regulated gene promoters. Composite computational specificity scoring integrating off-target sequence similarity, chromatin accessibility, and regulatory annotation predicted a low probability of unintended transactivation (0.4%–0.6%) for the selected CRISPRa guides (Figure 7). Common computational workflow issues, their likely causes, and recommended corrective actions are summarized in Supplementary Table 7 to facilitate reproducibility and consistent implementation.
DATA AVAILABILITY:
The authors confirm that all data supporting the findings of this study are provided within the article and are available in the Zenodo: https://doi.org/10.5281/zenodo.21735831
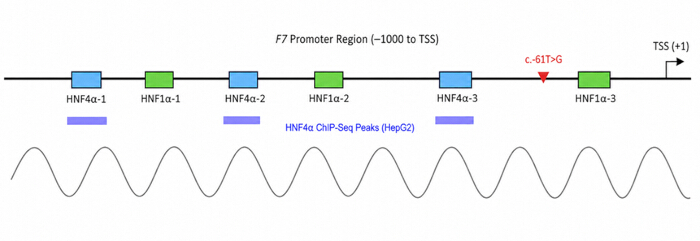
Figure 1: Predicted HNF4α and HNF1α binding motifs in the F7 promoter. Schematic representation of the 1 kb upstream promoter region of the F7 gene, displaying six predicted binding motifs for HNF4α and HNF1α (colored boxes). These are overlaid with vertebrate conservation scores (PhyloP) and annotated with known disease-associated variants (red mark), including the pathogenic c.-61T>G mutation. HNF4α ChIP-seq peaks from HepG2 cells indicate enrichment. Please click here to view a larger version of this figure.
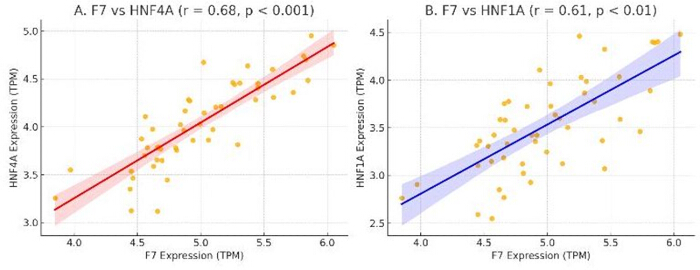
Figure 2: Correlation between F7 and hepatic transcription factors. (A) F7 expression exhibits a strong positive correlation with HNF4A (r = 0.68, p < 0.001). (B) F7 expression also correlates positively with HNF1A (r = 0.61, p < 0.01). Each dot represents a liver sample from the GTEx dataset. Regression lines with 95% confidence intervals are shown. Correlations are associative and do not establish direct regulatory causality. Please click here to view a larger version of this figure.
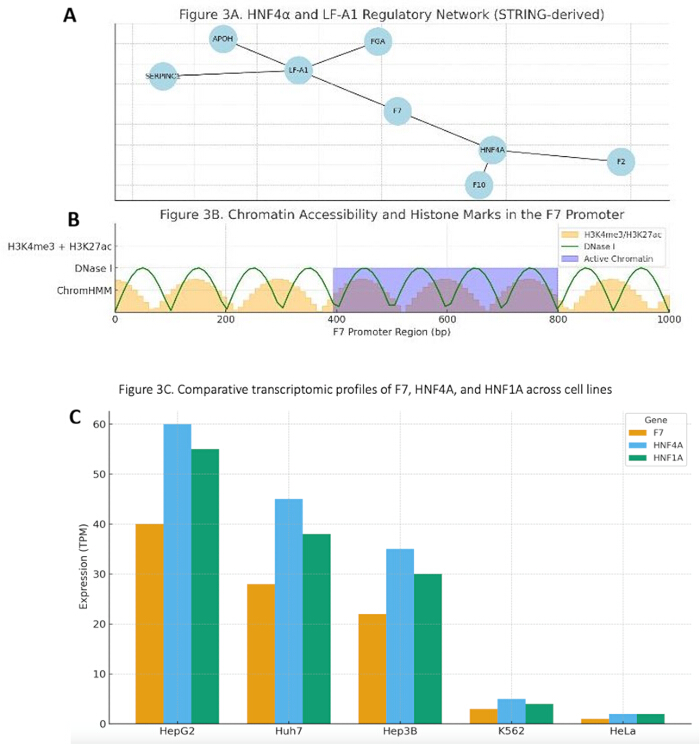
Figure 3: Hepatic regulatory network enrichment and chromatin landscape. (A) STRING-derived transcriptional network centered on HNF4α shows predicted regulatory associations with F7 and other coagulation-related genes. (B) UCSC-style browser tracks illustrate open chromatin (DNase I), histone modifications (H3K4me3/H3K27ac), and chromatin state segmentation (ChromHMM) around the F7 promoter in HepG2 cells, consistent with a transcriptionally active region. (C) Comparative transcriptomics show co-expression of F7, HNF4A, and HNF1A in hepatic cell lines (HepG2, Huh7, Hep3B) with variable levels, while non-hepatic lines (K562, HeLa) display reduced expression. Promoter accessibility and histone profiles in Huh7 and Hep3B were broadly concordant with HepG2. Please click here to view a larger version of this figure.
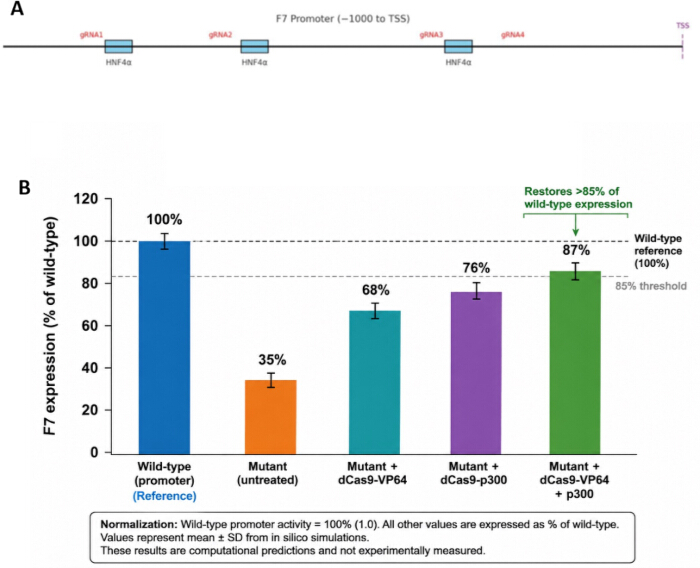
Figure 4: CRISPRa gRNA design and transcriptional activation simulation. (A) Diagram showing predicted locations of CRISPRa guide RNAs (gRNA1–gRNA4) relative to HNF4α binding motifs and the F7 transcription start site (TSS). (B) Simulated transcriptional output of F7 under different CRISPRa strategies in wild-type and mutant promoter contexts. F7 expression was normalized to the wild-type promoter, defined as 100% (1.0). In the mutant promoter model, predicted expression was 35% of wild-type, increasing to 68% with dCas9-VP64, 76% with dCas9-p300, and 87% with combined dCas9-VP64+p300 activation, thereby exceeding the 85% threshold. The in silico simulations incorporated epigenomic and transcriptomic inputs from HepG2 cells and represent computational predictions rather than experimentally measured expression. Please click here to view a larger version of this figure.
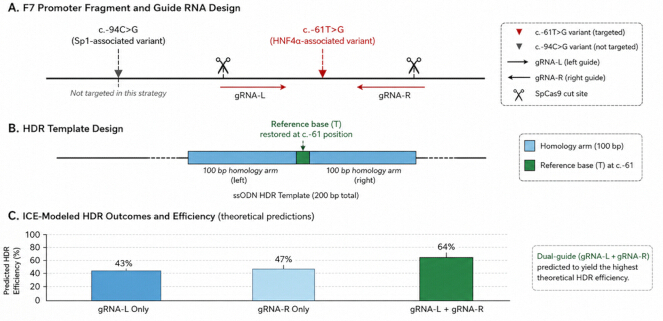
Figure 5: CRISPR-Cas9 HDR strategy for motif correction. (A) Schematic of the F7 promoter region showing the c.-61T>G variant (HNFa-associated) targeted for correction. The c.-94C>G variant (Sp1-associated) is indicated for the referee, as it was not targeted in this strategy. Two SpCas9 guide RNAs (gRNA-L and gRNA-R) were designed to flank the c.-61T>G site. (B) Single-stranded HDR (sODN) repair template containing the reference base (T) at the c.-61 position, flanked by 100-bp homology arms. (C) ICE-modeled predictions of editing efficiency for individual guides and the dual-guide (gRNA-L + gRNA-R) configuration. The dual-guide strategy is predicted to yield the highest theoretical HDR efficiency. All outcomes represent computational predictions and do not demonstrate successful HDR, restoration of HNF4a binding, or recovery of F7 transcription. Please click here to view a larger version of this figure.
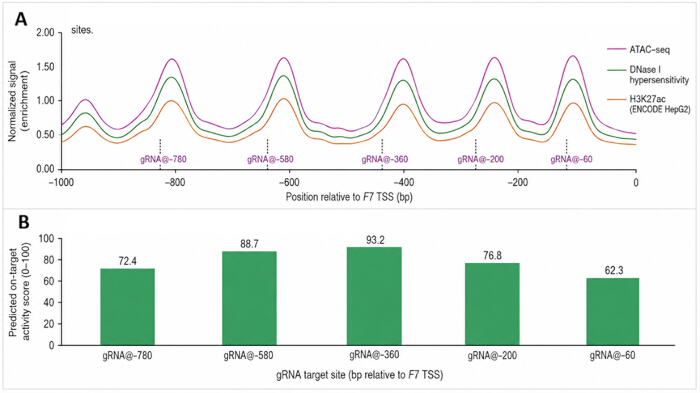
Figure 6: Chromatin accessibility and CRISPRa target site activation potential. (A) ATAC-seq, DNase I hypersensitivity, and H3K27ac enrichment tracks across the 1-kb upstream region of the F7 promoter illustrate regions of increased chromatin accessibility and active regulatory chromatin. Vertical dashed lines indicate the positions of the five CRISPRa gRNA target sites (gRNA@−780, gRNA@−740, gRNA@−580, gRNA@−360, and gRNA@−200). (B) Predicted transcriptional activation scores for each gRNA indicate that targeting accessible and H3K27ac-enriched regions may produce greater F7 activation, with the highest predicted activity at gRNA@−580. Please click here to view a larger version of this figure.
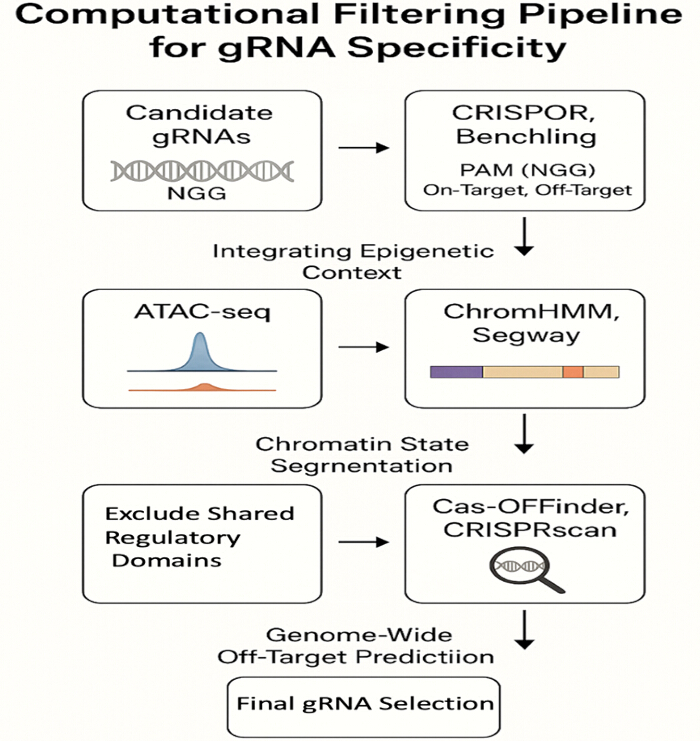
Figure 7: Computational filtering pipeline for gRNA specificity. A schematic overview of the in silico pipeline used to identify high-specificity CRISPRa and HDR gRNAs. The process integrates sequence-based filtering (CRISPOR, Benchling), epigenetic context (ATAC-seq, H3K27ac), chromatin state segmentation (ChromHMM, Segway), and genome-wide off-target prediction tools (Cas-OFFinder, CRISPRscan) to minimize predicted transactivation and cleavage risks. Please click here to view a larger version of this figure.
Supplementary Figure 1: Comparative chromatin accessibility and promoter-associated histone modification profiles at the F7 promoter in HepG2, Huh7, and Hep3B cells. Normalized ATAC-seq (A) accessibility together with H3K27ac (B) and H3K4me3 (C) enrichment demonstrates broadly consistent active promoter chromatin across the three hepatocyte-derived cell lines (D), supporting their use as computational models for F7 regulatory analyses.Please click here to download this file.
Supplementary Table 1: Parameters used in the computational transcriptional model. Summary of parameter values used in the CellDesigner-based simulation of F7 transcriptional regulation. Parameters include transcription factor activity coefficients for HNF4α and HNF1α, promoter accessibility modifiers derived from ENCODE chromatin datasets, transcription rate constants, and mRNA degradation parameters.Please click here to download this file.
Supplementary Table 2: Computational workflow checkpoints. Summary of the in silico analysis pipeline, including the computational tools, input datasets, key filtering criteria, and expected outputs at each stage of promoter annotation, transcription factor binding site prediction, CRISPRa guide selection, chromatin accessibility assessment, off-target evaluation, and simulated genome editing analyses. Please click here to download this file.
Supplementary Table 3: Comparative ENCODE-derived chromatin accessibility and promoter-associated histone modification profiles at the F7 promoter in HepG2, Huh7, and Hep3B cells. Normalized ATAC-seq accessibility, H3K27ac and H3K4me3 enrichment, and ChromHMM promoter-state annotations demonstrate broadly consistent active promoter architecture across the three hepatocyte-derived cell lines. Values represent computationally derived summaries used to support comparative in silico analyses.Please click here to download this file.
Supplementary Table 4: Complete specificity and off-target analysis of candidate CRISPRa guide RNAs targeting the F7 promoter. The table summarizes guide sequences, predicted on-target efficiency, specificity scores, off-target predictions, chromatin accessibility, regulatory annotations, and composite ranking used for computational guide selection. All values represent in silico predictions.Please click here to download this file.
Supplementary Table 5: Predicted regulatory scores were generated using the computational framework integrating promoter accessibility, transcription factor occupancy, and CRISPRa activation parameters. Values represent normalized in silico estimates relative to the wild-type F7 promoter (set as 1.0; 100% expression). These simulations are hypothesis-generating and do not represent experimentally measured F7 transcriptional activity.Please click here to download this file.
Supplementary Table 6: Genome-wide off-target analysis and composite specificity scoring for selected CRISPRa and HDR guide RNAs targeting the F7 promoter. The table summarizes predicted on-target performance, specificity metrics, off-target profiles, chromatin context, and composite risk scores used to evaluate guide specificity and estimate genome-wide transactivation risk in silico.Please click here to download this file.
Supplementary Table 7: Summary of common computational workflow issues encountered during F7 promoter analysis and recommended corrective actions to ensure reproducibility, data consistency, and reliable in silico modeling outcomes.Please click here to download this file.
Discussion
This study presents a purely computational, hypothesis-generating framework for examining transcriptional regulation of the F7 gene and for prioritizing candidate promoter-targeting strategies in hereditary FVII deficiency. By integrating motif analysis, transcriptomic correlations, chromatin annotations, and gRNA prioritization, the pipeline predicts regulatory relationships and intervention feasibility rather than demonstrating functional restoration. The primary contribution of this work is the systematic narrowing of experimentally testable targets within the F7 promoter.
Mechanistically, the findings support a model in which hepatocyte-enriched transcription factors HNF4α and HNF1α cooperate to maintain basal F7 transcription. The identification of conserved, high-affinity HNF4α motifs overlapping pathogenic promoter variants suggests that loss of cis-regulatory binding capacity is a plausible mechanistic contributor to reduced F7 transcription4,5,10. In hepatic gene networks, HNF4α functions as a pioneer-like nuclear receptor that stabilizes promoter accessibility and recruits coactivator complexes, while HNF1α often acts synergistically to reinforce transcriptional output7,11,12. Within the constraints of the in silico model, reduced motif affinity or simulated TF depletion led to decreased predicted F7 transcription, consistent with this cooperative regulatory architecture.
The strong liver-specific correlation observed between F7, HNF4A, and HNF1A expression further supports, though does not prove, a shared regulatory program. Importantly, these correlations are associative and cannot establish direct transcriptional control. Nonetheless, the network topology placing HNF4α/HNF1α at central nodes of coagulation-related modules is mechanistically consistent with prior experimental literature and supports their prioritization for further study19,20.
Epigenomic integration provides an additional mechanistic layer. The overlap between predicted HNF4α motifs and active chromatin marks (H3K4me3, H3K27ac) suggests that the proximal F7 promoter resides in a permissive chromatin environment in hepatocyte-derived datasets21,22. In the computational context, this accessibility supports the theoretical premise that transcriptional upregulation strategies such as CRISPRa could engage the locus. However, chromatin state is highly cell-type– and context-dependent, and ENCODE-derived signals may not fully represent patient hepatocytes or disease states23,24.
The modeling of CRISPRa and HDR strategies offers predictive insight into potential regulatory leverage points. Simulations suggest that targeting high-affinity HNF4α motifs could increase modeled F7 transcription under certain parameter conditions, whereas HDR-based motif correction could theoretically restore canonical binding architecture. Mechanistically, CRISPRa is expected to function through local recruitment of transcriptional coactivators (e.g., VP64 or p300), which may synergize with endogenous hepatic transcription factors when present10,12,16.
The model predicted reduced CRISPRa responsiveness when HNF4α activity was diminished, indicating dependence on intact endogenous regulatory circuitry. CRISPRa efficacy is predicted to depend on intact hepatic transcriptional machinery. Patients with pathogenic HNF4A variants may respond poorly to CRISPRa because it enhances, rather than replaces, endogenous transcription. Accordingly, this framework is most applicable to patients with F7 promoter variants and intact HNF4A activity.
Motif predictions do not confirm in vivo transcription factor binding, and chromatin annotations derived from public datasets may not reflect the regulatory state in patients with F7 promoter variants. Similarly, correlation analyses cannot distinguish direct from indirect regulatory relationships.
The dynamic transcriptional model relies on parameter estimation and simplifying assumptions regarding TF cooperativity, chromatin weighting, and transcriptional kinetics. While sensitivity-guided tuning was applied, the model remains an abstraction of hepatic gene regulation and may not capture nonlinear or context-specific regulatory behaviors. Small changes in parameterization could alter predicted rescue magnitudes. To improve model robustness, estimated transcription factor activity coefficients and chromatin accessibility weights were, whenever possible, selected from publicly available biological datasets and refined via sensitivity-guided parameter tuning. Although qualitative ranking of candidate regulatory strategies remained stable across biologically plausible parameter ranges, quantitative predictions of transcriptional rescue should be interpreted with caution because they still depend on model assumptions. Accordingly, the predicted rescue percentages are intended primarily for comparative prioritization rather than as precise estimates of biological efficacy.
CRISPR guide prioritization was based on in silico scoring algorithms that incompletely predict real-world editing or activation efficiency. Off-target risk assessment, although multilayered, cannot substitute for empirical genome-wide assays such as GUIDE-seq or Digenome-seq25,26. Furthermore, computational off-target prediction alone is insufficient to establish biosafety for clinical genome editing. Although multiple prediction tools were integrated to prioritize guide RNAs, definitive biosafety requires genome-wide off-target assays, transcriptomic profiling, and long-term functional validation. Future translational development should additionally incorporate transient CRISPR delivery systems, dose optimization, and comprehensive toxicological assessment to minimize unintended genomic or epigenomic effects. Likewise, HDR efficiency in hepatocytes is typically low in vivo, and the present simulations do not model DNA repair pathway competition or cell-cycle effects.
Translational feasibility remains uncertain. Efficient and safe hepatocyte delivery of CRISPR-based systems continues to be a major barrier. AAV vectors face cargo and immunogenicity constraints, whereas lipid nanoparticle systems require further optimization for liver specificity and durability27,28. These practical considerations were not explicitly modeled and may substantially affect real-world applicability. Similarly, the HDR-based promoter correction strategy should be viewed as a computational proof-of-concept rather than a clinically optimized therapeutic approach. Although predicted editing efficiencies of 45%–65% are encouraging within the computational framework, actual HDR efficiency in mature hepatocytes is generally limited because homology-directed repair is relatively inefficient in non-dividing cells. Consequently, emerging technologies such as prime editing or base editing may ultimately provide more clinically practical approaches for correcting promoter variants in vivo. Although HepG2-derived ENCODE datasets provide comprehensive hepatic annotations, they cannot fully recapitulate primary human hepatocytes. Therefore, the present analyses should be considered an initial computational prioritization framework that requires validation in primary hepatocytes, liver organoids, and appropriate animal models before clinical translation can be contemplated. The clinical relevance of partial F7 upregulation remains speculative in this context. Although prior clinical observations suggest that modest increases in plasma FVII can reduce bleeding risk, the present study does not demonstrate that the predicted transcriptional changes would translate into functional protein correction or clinical benefit16,17.
Notwithstanding these limitations, the framework has broader conceptual value. The integrative pipeline illustrates how promoter architecture, transcription factor dependency, and chromatin context can be jointly analyzed to prioritize regulatory interventions for liver-expressed genes affected by non-coding variants29,30,31.
In addition to HNF4α and HNF1α, SP1 represents an important transcriptional regulator that cooperates with hepatocyte-enriched factors to establish liver-specific chromatin accessibility and transcriptional activity. Therefore, the regulatory activity of the F7 promoter is likely mediated through a coordinated transcription factor network involving HNF4α, HNF1α, and SP1 rather than through individual factor binding events alone. While HNF4α-associated regulatory regions have been previously described, the present computational framework re-identifies these regulatory elements and evaluates their potential for targeted restoration using CRISPR-based approaches.
This framework guides therapeutic design by integrating transcription factor motif prediction with CRISPR-based targeting. Predicted HNF4α regulatory motifs were used as candidate regions for CRISPR activation (CRISPRa) gRNA design, aiming to enhance endogenous F7 transcription without altering the genomic sequence. Furthermore, disrupted or suboptimal regulatory motifs can be prioritized for CRISPR-Cas9-mediated sequence correction to restore their predicted transcription factor-binding potential. These applications highlight the utility of the model as a precision genome-regulatory screening platform, while experimental validation remains necessary to confirm regulatory activity and therapeutic feasibility. The pipeline is intended for F7 promoter variants predicted to disrupt HNF4α or HNF1α binding. The workflow integrates promoter sequences with public transcriptomic, epigenomic, and ChIP-seq datasets. Because the framework relies on liver-specific regulatory architecture, it is most applicable to hepatocytes or hepatocyte-derived experimental systems and should not be extrapolated to non-hepatic tissues. Furthermore, the predictive performance of the pipeline depends on the quality of available public datasets and, therefore, may not fully capture patient-specific epigenetic variation or disease-associated chromatin remodeling.
Future studies should include ChIP-qPCR or CUT&RUN to confirm HNF4α/HNF1α occupancy at prioritized motifs, CRISPRa functional assays in hepatocyte-derived cells, and protein-level measurements of FVII activity. In addition, allele-specific models of promoter variants such as c.-61T>G will be necessary to determine whether the predicted regulatory mechanisms operate in a mutation-dependent manner.
Compared with conventional gene replacement strategies, which rely on exogenous delivery of the F7 coding sequence, the proposed CRISPRa framework seeks to enhance transcription of the endogenous F7 locus while preserving native genomic regulation. Previous studies demonstrated TALE- and CRISPRa-mediated rescue of F7 promoter activity16,17. In contrast, the present study provides an integrated computational framework for prioritizing promoter-targeting strategies before experimental validation. HDR-mediated promoter correction theoretically restores the native DNA sequence but depends on relatively inefficient homology-directed repair, particularly in quiescent hepatocytes. Consequently, the present computational framework positions CRISPRa as a complementary regulatory strategy that may be advantageous for promoter variants predicted to impair transcription factor binding while avoiding permanent genomic sequence modification. These comparisons are intended to prioritize candidate approaches for future experimental evaluation rather than establish therapeutic superiority.
Despite these mechanistic insights, several important limitations must be emphasized. First and most critically, all findings are derived from computational analyses and simulated models; no experimental validation was performed. The absence of experimental validation represents the principal limitation of this study. All predicted transcription factor binding events, CRISPRa-mediated transcriptional activation, HDR efficiencies, and off-target assessments are computational predictions and should therefore be interpreted as testable hypotheses rather than experimentally verified biological phenomena. Future studies should validate these findings using luciferase promoter-reporter assays, ChIP-qPCR or CUT&RUN experiments to confirm HNF4α/HNF1α occupancy, CRISPRa activation studies in hepatocyte-derived cell lines or primary hepatocytes, quantitative PCR and western blot analyses of F7 expression, and coagulation assays to determine restoration of functional FVII activity.
In conclusion, this study provides a computationally derived, mechanistically informed framework suggesting that disruption of HNF4α/HNF1α regulatory architecture may contribute to reduced F7 transcription and that targeted promoter modulation could, in theory, enhance modeled gene activity. However, all conclusions remain predictive and contingent on experimental validation. The work is best interpreted as a systematic hypothesis-generation effort rather than evidence of therapeutic efficacy.
Disclosures
The authors declare no conflicts of interest.
Acknowledgements
The authors are thankful to the Deanship of Graduate Studies and Scientific Research at the University of Bisha for supporting this work through the Fast-Track Research Support Program. Moreover, this study is supported via funding from Prince Sattam bin Abdulaziz University project number (PSAU/2026/R/1448)
Materials
| Name | Company | Catalog Number | Comments |
|---|---|---|---|
| Benchling | Benchling Inc. | Web platform | Used for CRISPR guide RNA design and promoter sequence analysis. |
| Cas-OFFinder | Center for Genome Engineering | Current version | Used for genome-wide prediction of CRISPR-Cas9 off-target cleavage sites. |
| CellDesigner | Systems Biology Institute | v4.4 | Used for in silico modeling of transcriptional regulation and CRISPRa simulations. |
| ChromHMM | Broad Institute | Current version | Used for chromatin state segmentation and annotation. |
| CRISPOR | CRISPOR Team | Current web version | Used to evaluate guide RNA efficiency and predicted off-target activity. |
| CRISPRscan | CRISPRscan Development Team | Current version | Used to estimate predicted CRISPR-Cas9 cleavage efficiency. |
| Cytoscape | Cytoscape Consortium | v3.9.1 | Network visualization and analysis platform. |
| dbSNP Database | NCBI | Current release | Used to identify known single nucleotide polymorphisms within the F7 promoter. |
| dCas9-p300 CRISPRa System (computational model) | Not applicable | Not applicable | Computationally modeled epigenetic activator used for simulation only; no experimental reagent employed. |
| dCas9-VP64 CRISPRa System (computational model) | Not applicable | Not applicable | Computationally modeled transcriptional activator used for simulation only; no experimental reagent employed. |
| ENCODE Project Database | ENCODE Consortium | Current release | Source of ChIP-seq, ATAC-seq, DNase I hypersensitivity, and histone modification datasets. |
| F7 promoter sequence (GenBank) | National Center for Biotechnology Information (NCBI) | NG_009262.1 | Human F7 gene reference sequence used for promoter retrieval and annotation. |
| FIMO (Find Individual Motif Occurrences) | MEME Suite | v5.5.0 | Computational tool used to scan the F7 promoter for predicted transcription factor binding sites. |
| GTEx Portal | GTEx Consortium | Version 8 (v8) | Source of liver transcriptomic (TPM) data for correlation analyses. |
| Human Gene Mutation Database (HGMD) | HGMD Professional | Current release | Used to identify disease-associated promoter variants. |
| ICE (Inference of CRISPR Edits) | Synthego Corporation | Current web version | Used to computationally model predicted CRISPR editing outcomes. |
| JASPAR Database | JASPAR Consortium | 2022 Release | Database of transcription factor binding profiles used to identify HNF4α and HNF1A binding motifs. |
| MCODE Plugin | Cytoscape | Current version | Used to identify highly connected regulatory network modules. |
| MEME Suite | MEME Suite Development Team | v5.5.0 | Software package supporting motif discovery and motif occurrence analysis. |
| Pearson Correlation Analysis | Statistical algorithm | Not applicable | Used to evaluate associations between F7, HNF4A, and HNF1A expression. |
| PhastCons Conservation Track | UCSC Genome Browser | 100-Vertebrate Alignment | Used to evaluate conserved genomic elements. |
| PhyloP Conservation Track | UCSC Genome Browser | 100-Vertebrate Alignment | Used to assess nucleotide-level evolutionary conservation. |
| Segway | Hoffman Laboratory | Current version | Used for genome segmentation and regulatory annotation. |
| Single-stranded HDR Repair Template (computational design) | Not applicable | Not applicable | Designed in silico for promoter motif restoration; not experimentally synthesized. |
| SpCas9 (computational model) | Not applicable | Not applicable | Computational model used for HDR guide RNA design and editing simulations. |
| STRING Database | STRING Consortium | v11.5 | Used to construct protein–protein interaction and gene regulatory networks. |
| UCSC Genome Browser | University of California, Santa Cruz | Current release | Used to evaluate promoter conservation, genome annotation, and epigenomic tracks. |
References
- Peyvandi F, Duga S, Akhavan S, Mannucci PM. Rare coagulation deficiencies. Haemophilia. 2002;8(3):308-321.
- Mariani G, Bernardi F. Factor VII deficiency. Semin Thromb Hemost. 2009;35(4):400-6. doi:10.1055/s-0029-1225762.
- Napolitano M, Siragusa S, Mariani G. Factor VII deficiency: clinical phenotype, genotype and therapy. J Clin Med. 2017;6(4):38.
- Tourbih H, Harrach A, Bencharef H, Dehbi H, Oukkache B. Molecular aspects of rare coagulation factor deficiencies. Cureus. 2025;17(7):e89102.
- Carew JA, Pollak ES, High KA, Bauer KA. Severe factor VII deficiency due to a mutation disrupting an Sp1 binding site in the factor VII promoter. Blood. 1998;92(5):1639-1645.
- Shahbazi S, Mahdian R. Factor VII Gene Defects: Review of Functional Studies and Their Clinical Implications. Iran Biomed J 2019 May;23(3):165–174.
- Sladek FM. What are nuclear receptor ligands? Mol Cell Endocrinol. 2011;334(1-2):3-13.
- Garrison WD, Battle MA, Yang C, Kaestner KH, Sladek FM, Duncan SA. Hepatocyte nuclear factor 4 alpha is essential for embryonic development of the mouse colon. Gastroenterology. 2006;130(4):1207-1220.
- Bolotin E et al. Integrated approach for the identification of human hepatocyte nuclear factor 4alpha target genes using protein binding microarrays. Hepatology. 2010;51(2):642-653.
- Walesky C, Apte U. Role of hepatocyte nuclear factor 4α (HNF4α) in cell proliferation and cancer. Gene Expr. 2015;16(3):101-108.
- Parviz F, Matullo C, Garrison WD, Savatski L, Adamson JW, Ning G, et al. Hepatocyte nuclear factor 4alpha controls the development of a hepatic epithelium and liver morphogenesis. Nat Genet. 2003;34(3):292-296.
- Odom DT et al. Control of pancreas and liver gene expression by HNF transcription factors. Science. 2004;303(5662):1378-1381.
- Rowley CW, Staloch LJ, Divine JK, McCaul SP, Simon TC. Mechanisms of mutual functional interactions between HNF-4alpha and HNF-1alpha revealed by mutations that cause maturity onset diabetes of the young. Am J Physiol Gastrointest Liver Physiol. 2006;290(3):G466-475.
- Hirakawa MP, Krishnakumar R, Timlin JA, Carney JP, Butler KS. Gene editing and CRISPR in the clinic: current and future perspectives. Biosci Rep. 2020;40(4):BSR20200127.
- Belali T, Abomughaid M, Alhujaily M. The transcription factor HNF-4α: a key player in haematological disorders. Arch Med Sci. 2021;19(6):1646-1652.
- Barbon E, Pignani S, Branchini A, Bernardi F, Pinotti M, Bovolenta M. An engineered TALE-transcription factor rescues transcription of factor VII impaired by promoter mutations and enhances its endogenous expression in hepatocytes. Sci Rep. 2016;6:28304.
- Pignani S et al. Tailoring the CRISPR system to transactivate coagulation gene promoters in normal and mutated contexts. Biochim Biophys Acta Gene Regul Mech. 2019;1862(6):619-624.
- Arbini AA, Pollak ES, Bayleran JK, High KA, Bauer KA. Severe factor VII deficiency due to a mutation disrupting a hepatocyte nuclear factor 4 binding site in the factor VII promoter. Blood. 1997;89(1):176-182.
- Greenberg D, Miao CH, Ho WT, Chung DW, Davie EW. Liver-specific expression of the human factor VII gene. Proc Natl Acad Sci U S A. 1995;92(26):12347-12351.
- Andersson R, Sandelin A. Determinants of enhancer and promoter activities of regulatory elements. Nat Rev Genet. 2020;21(2):71-87.
- Birnbaum RY, Clowney EJ, Agamy O, Kim MJ, Zhao J, Yamanaka T, et al. Coding exons function as tissue-specific enhancers of nearby genes. Genome Res. 2012;22(6):1059-1068.
- Fulco CP et al. Activity-by-contact model of enhancer-promoter regulation from thousands of CRISPR perturbations. Nat Genet. 2019;51(12):1664-1669.
- Yin H et al. Therapeutic genome editing by combined viral and non-viral delivery of CRISPR system components in vivo. Nat Biotechnol. 2016;34(3):328-333.
- Chen Y et al. Chromatin accessibility: biological functions, molecular mechanisms and therapeutic application. Signal Transduct Target Ther. 2024;9(1):340.
- Deans JR et al. HNF4α isoforms regulate the circadian balance between carbohydrate and lipid metabolism in the liver. Front Endocrinol (Lausanne). 2023;14:1266527.
- Jones C, Avino M, Giroux V, Boudreau F. HNF4α acts as upstream functional regulator of intestinal Wnt3 and Paneth cell fate. Cell Mol Gastroenterol Hepatol. 2023;15(3):593-612.
- Taha EA, Lee J, Hotta A. Delivery of CRISPR-Cas tools for in vivo genome editing therapy: trends and challenges. J Control Release. 2022;342:345-361.
- Qiu S, Pan Y, Cui Y, et al. HNF4α improves hepatocyte regeneration by upregulating PXR. FASEB J. 2024;38(14):e23830.
- Avsec Ž et al. Effective gene expression prediction from sequence by integrating long-range interactions. Nat Methods. 2021;18(10):1196-1203.
- Zahraei M et al. CRISPR/dCas9-TET1-mediated epigenetic editing reactivates miR-200c in breast cancer cells. Sci Rep. 2025;15(1):31739.
- Mariani G, Herrmann FH, Bernardi F, Schved JF, Auerswald G, Ingerslev J. Clinical manifestations, management, and molecular genetics in congenital factor VII deficiency: the International Registry on Congenital Factor VII Deficiency (IRF7). Blood. 2000;96(1):374.