This protocol describes a multicenter 2 × 2 factorial evaluation of multicomponent adjustable-furniture and optimized indoor-environment packages in small workspaces. It integrates workstation commissioning, indoor environmental monitoring, repeated assessments of comfort and discomfort, standardized work-performance testing, and site-adjusted analysis to distinguish ergonomic, environmental, and combined effects.
Research Article
Human-Centered Workspace Optimization: A 2 × 2 Factorial Study of Adjustable Furniture and Indoor Environmental Quality
60 views
⸱
September 11th, 2026
In This Article
Summary
Abstract
Small workspaces function as integrated systems, yet ergonomic furniture and indoor environmental conditions are usually evaluated separately. A six-site, assessor-blinded, randomized 2 × 2 factorial controlled study was conducted of two multicomponent packages—adjustable furniture and optimized indoor environmental quality (IEQ)—among 240 office workers for four weeks. Each group included 60 participants. Overall comfort in week 4 was highest for both packages (5.62 ± 0.53 versus 3.99 ± 0.60 with fixed furniture and basic IEQ). In a site-adjusted factorial model with HC3 robust standard errors, the adjustable-furniture effect was 0.86 points (95% confidence interval [CI], 0.62–1.09), the optimized-IEQ effect was 0.34 points (95% CI, 0.12–0.55), and their interaction was 0.44 points (95% CI, 0.14–0.74). Adjustable furniture improved postural comfort and reduced neck and lower back discomfort; optimized IEQ improved environmental comfort; both packages improved perceived productivity, satisfaction, and fatigue. The task-accuracy interaction did not remain significant after false-discovery-rate adjustment, and exploratory mediation and spline analyses did not support indirect or nonlinear effects. These results support coordinated ergonomic and environmental implementation while preserving distinct outcome pathways.
Introduction
Computer-based work frequently involves prolonged sitting, limited posture variation, and repeated interaction with workstations that may not accommodate differences in body dimensions, task requirements, or working habits. Physical workplace interventions such as sit–stand desks can increase standing and movement during office work, although evidence that standing-focused interventions alone consistently reduce musculoskeletal symptoms remains limited1. Reviews of sit–stand workstations have nevertheless indicated that they may reduce discomfort without necessarily impairing work productivity, but the magnitude of benefit varies considerably across study designs and populations2. Shorter experimental studies further suggest that breaking prolonged sitting with intermittent standing can reduce fatigue and musculoskeletal discomfort3, while workstation interventions that increase postural variability may lower end-of-day discomfort without adversely affecting routine computer performance4. These findings support adjustable furniture as a potentially useful design component, but they also show that the presence of a sit–stand desk does not by itself guarantee appropriate posture, effective use, or improved comfort.
Furniture is only one part of the workspace the user experiences. Thermal conditions, ventilation, lighting, acoustics, air quality, layout, and furnishings jointly shape perceived comfort and satisfaction. Occupant-based IEQ assessment has therefore traditionally included office layout, furniture, thermal comfort, indoor air quality, lighting, and acoustic conditions rather than evaluating any single environmental parameter in isolation5. Ventilation research has also connected indoor environmental conditions with health, comfort, and work performance across non-industrial buildings6, while experimental evidence indicates that poor indoor air quality can reduce office performance and increase dissatisfaction7. Objective environmental measurements remain necessary, but they do not fully represent occupant experience because individuals working under similar measured conditions may report different levels of thermal, visual, acoustic, or air-quality comfort.
This distinction becomes particularly important in small workspaces. A restricted floor area can limit chair movement, sit-to-stand transitions, monitor placement, storage access, ventilation distribution, and separation from noise or glare sources. A furniture intervention may therefore be technically adjustable but functionally constrained by the surrounding layout. Similarly, an office may achieve acceptable average environmental measurements while individual workstations remain exposed to local heat, insufficient task lighting, direct glare, or disruptive noise. Field evaluation of university office buildings has shown that meaningful assessment of workspace quality requires both measured environmental conditions and occupant-reported responses8. User preferences are also heterogeneous; office workers can differ substantially in their preferred combinations of thermal, air-quality, lighting, acoustic, spatial, and psychosocial conditions9. A uniform environmental target or standardized workstation configuration may consequently improve average conditions without meeting every user's needs.
Existing research has largely examined sit–stand furniture and IEQ as separate intervention domains. Furniture studies commonly focus on sitting time, posture, discomfort, or immediate performance, whereas building-environment studies examine thermal comfort, ventilation, lighting, noise, satisfaction, or perceived productivity. This separation does not reflect how users experience a workspace. A worker interacts simultaneously with the chair, desk, monitor, available movement space, temperature, air quality, light, and sound. A poorly adjusted workstation may remain uncomfortable even in an otherwise favorable indoor environment, while an ergonomically suitable desk and chair may provide only partial benefit when the surrounding environment is thermally uncomfortable, poorly ventilated, visually inadequate, or noisy. Research on home and small-scale work settings has similarly identified variation in IEQ preferences and psychosocial comfort, highlighting the need for more individualized and integrated workspace design10.
A further limitation is that many studies evaluate only a direct relationship between a physical intervention and a final outcome. This approach provides limited insight into why an intervention works. Adjustable furniture is likely to influence overall comfort through anthropometric fit, posture variation, and posture comfort, whereas optimized IEQ may operate through measured environmental conditions and perceived thermal, air-quality, visual, and acoustic comfort. These pathways may remain partly independent while converging on overall workspace evaluation. The combination of the two interventions may also produce an interaction if physical and environmental discomfort constrain one another.
The present study, therefore, evaluated adjustable furniture and optimized IEQ in a multicenter 2 × 2 factorial design involving small computer-based workspaces. Its novelty lies in the concurrent factorial evaluation of two multicomponent intervention packages—individualized workstation configuration and occupied-condition IEQ optimization—rather than the isolated testing of a desk or a single environmental variable. This design was needed to distinguish complementary and interaction effects that separate-domain studies cannot identify. The primary objective was to estimate the independent and combined effects on week 4 overall comfort; secondary objectives covered posture comfort, environmental comfort, musculoskeletal discomfort, objective task performance, perceived productivity, workspace satisfaction, mental fatigue, and creativity.
Protocol
This study involving human participants was approved before recruitment by the Human Research Ethics Committee of Shanghai Material Engineering School (Approval no. 4701BC5746). All participants provided written informed consent before baseline assessment. Consent covered study participation, publication of aggregate results, and deposition of de-identified analytical data. Direct identifiers were stored separately from coded research records and were not deposited.
Study design, setting, and participants
This multicenter, assessor-blinded, randomized 2 × 2 factorial controlled study evaluated two multicomponent factors: a fixed versus individually adjustable furniture package and a basic versus optimized IEQ package. Their combination formed four parallel groups. The study was conducted at six office sites from September 8, 2025, to February 27, 2026; each participant completed four intervention weeks after baseline assessment and workstation/environmental commissioning. Eligible workspaces measured 3.2–8.5 m2 and were used primarily for computer-based work. Figure 1 summarizes the study flow, the factorial structure, and assessments.
Each site contributed 40 participant-workstations, with 10 assigned to each factorial group. To prevent cross-contamination between intervention groups, each of the six study sites used four strictly dedicated rooms or physically separated zones (one for each factorial condition), yielding a total of 24 independent zones, each containing 10 participant workstations. Contamination was systematically controlled by restricting adjustable furniture to assigned zones, applying tamper-evident labels to condition-specific IEQ devices, and explicitly instructing participants to use only their assigned workstations. Site intervention staff actively monitored spatial compliance and verified room-to-condition mapping weekly to ensure fidelity. Reported models adjust for site, and repeated-measures models cluster observations within participants.
Participants were recruited through workplace notices, institutional mailing lists, and staff briefings. Eligibility required age 20–55 years, at least 28 working hours per week, at least four hours of daily computer work, use of the same workspace for at least three months, and expected availability during follow-up. Exclusion criteria were pregnancy, recent spinal or limb surgery, acute injury requiring work restriction, a neurological or vestibular condition affecting standing balance, a clinically prescribed workstation, planned absence exceeding five workdays, inability to complete the computer tasks, pain above 8/10, or progressive neurological symptoms. Participant flow was documented using verified screening logs. A total of 265 employees were assessed for eligibility; 25 were excluded before randomization (18 did not meet the inclusion criteria, and 7 declined to participate). The remaining 240 eligible employees provided informed consent and were randomized, with 60 participants allocated to each of the four factorial groups. Overall comfort for week 4 was successfully captured for all 240 allocated participants. A standardized CONSORT flow diagram detailing the enrollment, allocation, follow-up, and analysis phases is presented in Figure 1.
Sample size, allocation, and masking
The target sample of 240 allowed approximately 12% attrition above the calculated minimum of 212 for the primary outcome (two-sided α = 0.05, 90% power, Cohen’s f = 0.20 for the interaction, and a baseline-to-follow-up correlation of 0.50). An independent statistician generated the allocation sequence using variable block sizes of 8 and 12, stratified by study site and baseline overall comfort. To ensure strict allocation concealment, the sequence was secured within a centralized, password-protected electronic database. Designated site research staff sequentially enrolled participants and conducted baseline assessments. Group allocation was automatically unblinded to the site intervention team via the electronic system only after the respective participant's baseline assessment was fully locked. Outcome assessors and data analysts remained blinded to group allocation until completion of the primary analysis. This study was not prospectively registered in a public clinical trial registry because the interventions focused on occupational ergonomics and indoor environmental engineering among healthy office workers, rather than therapeutic medical treatments. Nevertheless, to ensure methodological transparency, the comprehensive study protocol and statistical analysis plan (SAP) were approved by the institution and formally locked prior to participant enrollment and any data decoding.
Furniture and indoor environmental interventions
The furniture factor was a multicomponent package rather than a desk-only intervention (Figure 2 and Table 1). To guarantee consistent implementation across all six study sites, standardized operating procedures (SOPs) were established, and centralized training was mandated for all site research and installation personnel prior to study commencement. The fixed package comprised the existing 720–750 mm desk, chair, and standard monitor/input device arrangement. The adjustable package comprised a 650–1250 mm electric sit–stand desk, an adjustable chair, a monitor arm or stable riser when required, input-device repositioning, clearance for sit-to-stand movement, a 25-minute individualized adjustment session, and posture-change training. Participants were encouraged to gradually alternate between sitting and standing; desk height was recorded every minute. A desk-height episode was defined as five or more consecutive minutes with the desk ≥150 mm above that participant’s seated reference height. Because height does not establish body posture, this measure is reported as above-threshold time rather than standing exposure.
The IEQ factor was also multicomponent. The basic package retained existing ventilation, lighting, thermal, acoustic, and filtration operations, with safety corrections as required. The optimized package targeted 23.0–25.0°C, 45%–60% relative humidity, carbon dioxide (CO₂) below 800 ppm, task illuminance of 400–500 lux, equivalent continuous noise no greater than 45 dBA, and fine particulate matter (PM2.5) no greater than 15 µg/m3 using coordinated ventilation, temperature control, blinds/task lighting, equipment or barrier changes, and filtration/housekeeping measures. A five-variable daily-mean composite was met only when temperature, humidity, CO₂, illuminance, and noise were all within target on that valid workday; PM2.5 was reported separately. Variable-specific and composite daily-mean attainment rates were systematically calculated by group and site for subsequent analysis. Room-level attainment cannot be calculated without the missing room map.
Environmental and furniture-use monitoring
Place environmental monitors 0.8–1.2 m above the floor and 0.5–1.0 m from the usual seated position, away from direct sunlight, windows, supply outlets, computers, and other local sources. Record temperature, relative humidity, and CO₂ each minute and PM2.5 every five minutes. Measure illuminance and noise during standardized tasks and three scheduled 30-minute periods on two ordinary workdays per week. Cross-check instruments before deployment; exclude the first 10 minutes after placement and periods of movement, disconnection, covering, handling, or out-of-range operation. Define a valid day as having at least six occupied hours between 08:30 and 17:30.
Outcome measures and assessment schedule
Complete baseline assessment before allocation and week 4 assessment on intervention days 26–32, preferably within the same two-hour time window. The primary item asks: “Considering your workstation and the surrounding indoor environment together, how comfortable was your workspace during the previous 5 working days?” (1 = extremely uncomfortable; 7 = extremely comfortable). Study-specific items 1–7 assess posture, thermal, air-quality, visual, and acoustic comfort; environmental comfort is the arithmetic mean when at least 3 of the 4 environmental items are available. Neck and lower back discomfort: use 0–10 ratings for the preceding five workdays. Productivity, satisfaction, fatigue, and performance tasks are defined in Table 2, which provides every prompt, scoring rule, schedule, measurement-property limitation, and practical interpretation. Because these study-specific items lack externally validated reliability coefficients and minimal important differences, continuous effects and 95% CIs—not invented cutoffs—are emphasized.
Standardized work-performance assessment
Administer a 35-minute computer battery covering proofreading, data entry, visual search, and rule-based classification. Calculate accuracy as correct items divided by attempted items × 100 and speed as correct units per 35 minutes. Provide a 10-minute practice, counterbalance parallel baseline/week 4 forms, pause interruptions shorter than two minutes, and repeat within three workdays after longer technical interruptions. Score the exploratory divergent-thinking task from 0–100 using fluency, flexibility, and originality.
Intervention fidelity, protocol deviations, and safety
Define adherence to adjustable furniture as at least 30 minutes of above-threshold desk use on at least 3 workdays per week during at least 3 intervention weeks. Define optimized-IEQ adherence as meeting the five-variable daily-mean composite on at least 75% of valid monitored workdays. Retain all allocated participants in the primary analysis. Record incorrect condition for at least five consecutive workdays, relocation for more than 25% of the intervention, fewer than 10 valid workdays, or missing week 4 primary outcome as major deviations. At weekly checks, document new/worsening discomfort, dizziness, instability, lower-limb fatigue, work interruption, any suspension, reassessment, and adverse effect; suspend standing-desk use and reassess after a ≥3-point discomfort increase, dizziness while standing, or symptoms affecting walking or normal work.
Data management and missing-data handling
Store all records under coded participant identifiers and keep direct identifiers in a separately access-controlled file. Before locking, check ranges, consistency, duplication, allocation, sensor summaries, and outcomes against source files and site logs. Retain plausible extremes; correct only verified transcription, unit-conversion, or device errors. Summarize missingness by variable, group, site, and assessment. Do not impute wholly absent monitoring days. The deposited files contain de-identified participant-level, weekly, and workday summaries; direct identifiers, item-level keystroke logs, room maps, screening logs, and separate safety logs were not included in the public deposit.
Statistical analysis
Analyses used generic statistical programming software and libraries listed in the separate Table of Materials. Continuous variables are reported as mean ± standard deviation, and categorical variables as n (%); baseline significance tests were not used. All statistical analyses were executed in accordance with the prespecified SAP, with one transparently reported post-audit deviation. According to the prespecified SAP, the primary analysis modeled week 4 overall comfort, testing the main effects of adjustable furniture, optimized IEQ, and their interaction, while adjusting for baseline overall comfort, baseline lower-back discomfort, and workspace area. The interaction term was retained irrespective of statistical significance. However, as a post-audit deviation aimed at ensuring exact computational reproducibility and robust variance estimation given the small number of macro-clusters (k = 6 sites), the originally planned random-intercept specification was replaced with fixed site indicators utilizing HC3 heteroscedasticity-robust standard errors.
Apply analogous site-adjusted factorial models to secondary outcomes, including the corresponding baseline value when available, and control the false discovery rate within prespecified outcome families using the Benjamini–Hochberg method. Model weekly trajectories using generalized estimating equations with participant clustering and site indicators. Conduct per-protocol and major-deviation-exclusion analyses. Label bootstrap mediation (5,000 resamples) exploratory, and report both direct and indirect effects; examine temperature, CO2, illuminance, and noise nonlinearity with restricted cubic splines. Use two-sided tests and 95% CIs. Table 3 maps outcomes to models and clearly distinguishes primary, secondary, sensitivity, and exploratory analyses.
Results
Participant characteristics and data availability
All 240 participants from six sites completed baseline assessment and were allocated equally to four groups (n = 60 each). Every site contributed 10 participants to each group. Overall comfort for week 4 was available for all participants, who therefore entered the allocated-condition primary analysis. Mean age was 31.5 ± 7.4 years, 125 participants (52.1%) were women, mean body mass index was 23.0 ± 3.2 kg/m2, and mean weekly work duration was 41.5 ± 5.9 h. Table 4 presents baseline characteristics without post-randomization significance testing. The primary outcome was complete for all 240 participants. Available case sample sizes for week 4 secondary outcomes ranged from 235 to 240; detailed group-specific sample sizes for these measures are provided in the respective efficacy summaries below.
Intervention delivery and exposure separation
The adjustable-furniture package separated the groups in adjustability, anthropometric fit, and desk-height behavior. Mean anthropometric fit was 4.95 ± 0.70 with adjustable furniture and 2.46 ± 0.73 with fixed furniture. Adjustable groups recorded 5.27 ± 1.13 desk-height transitions/day and 75.84 ± 20.38 min/day above the participant-specific seated threshold; fixed groups recorded 2.07 ± 0.99 transitions/day and 19.78 ± 18.86 min/day. The latter values can reflect device repositioning, reference-height variation, or other desk-height records and are not interpreted as fixed-desk standing adherence. Raw height records, the seated-threshold definition, device allocation, and group codes were rechecked against the deposited data.
The optimized-IEQ package produced lower temperature (24.15 ± 0.75°C versus 26.30 ± 0.75°C), relative humidity (54.57% ± 4.99% versus 66.65% ± 6.11%), CO₂ (750.15 ± 120.47 ppm versus 1080.35 ± 123.98 ppm), noise (43.39 ± 3.92 dBA versus 50.94 ± 4.14 dBA), and PM2.5 (12.33 ± 4.84 µg/m3 versus 18.16 ± 4.49 µg/m3), and higher illuminance (439.30 ± 68.70 lux versus 293.03 ± 72.82 lux), than basic IEQ. Table 5 reports these measures along with adherence, deviations, per-protocol counts, and daily mean target attainment.
Thus, furniture assignment primarily changed workstation fit and desk-height behavior, whereas IEQ assignment changed the monitored thermal, ventilation-related, lighting, acoustic, and particulate conditions. These are package-level contrasts and do not isolate any single component.
Overall comfort
Week 4 overall comfort was 3.99 ± 0.60, 4.84 ± 0.65, 4.33 ± 0.55, and 5.62 ± 0.53 in the fixed-basic, adjustable-basic, fixed-optimized, and adjustable-optimized groups, respectively. Adjustable furniture increased comfort by 0.86 points (95% CI, 0.62–1.09; P < 0.001), optimized IEQ increased it by 0.34 points (95% CI, 0.12–0.55; P = 0.002), and their interaction was 0.44 points (95% CI, 0.14–0.74; P = 0.005) in the site-adjusted HC3 model. Figure 3 shows the four groups and allocated-condition population, raw week 4 comfort distributions, baseline-to-week 4 group means with 95% CIs, and the site-adjusted factorial effects.
Posture comfort and musculoskeletal outcomes
Week 4 posture comfort scores were 2.72 ± 0.92, 4.33 ± 0.93, 2.82 ± 0.92, and 4.99 ± 0.85 across the four groups. The adjustable-furniture effect was 1.61 points (95% CI, 1.28–1.95; P < 0.001; q < 0.001), the optimized-IEQ effect was 0.11 points (95% CI, −0.23 to 0.44; P = 0.534; q = 0.712), and the interaction effect was 0.55 points (95% CI, 0.09–1.01; P = 0.020; q = 0.044).
Week 4 neck discomfort scores were 4.51 ± 1.66, 3.27 ± 1.71, 4.75 ± 1.66, and 2.57 ± 1.32 across the four groups. The adjustable-furniture effect was −1.24 points (95% CI, −1.85 to −0.62; P < 0.001; q < 0.001), the optimized-IEQ effect was 0.26 points (95% CI, −0.34 to 0.87; P = 0.391; q = 0.712), and the interaction effect was −0.97 points (95% CI, −1.80 to −0.14; P = 0.022; q = 0.044).
Week 4 lower-back discomfort scores were 5.16 ± 1.78, 3.46 ± 1.83, 5.04 ± 1.59, and 3.02 ± 1.55 across the four groups. Adjustable furniture reduced discomfort by 1.70 points (effect estimate, −1.70; 95% CI, −2.36 to −1.04; P < 0.001; q < 0.001). Neither the optimized-IEQ effect (−0.12; 95% CI, −0.74 to 0.51) nor the interaction effect (−0.32; 95% CI, −1.19 to 0.56) was significant. Figure 4 presents the raw distributions of anthropometric fit and posture comfort, mean desk-height transitions per day, and above-threshold time per day with 95% CIs, and mean neck and lower-back discomfort scores with 95% CIs.
Environmental comfort and work-related outcomes
Environmental comfort scores were 5.28 ± 0.57, 5.29 ± 0.60, 5.83 ± 0.49, and 5.88 ± 0.54 across the four groups. Optimized IEQ increased environmental comfort by 0.55 points (95% CI, 0.35–0.74; P < 0.001; q < 0.001). Neither the furniture effect (−0.00; 95% CI, −0.22 to 0.21) nor the interaction effect (0.04; 95% CI, −0.24 to 0.33) was significant.
Task accuracy was 83.49% ± 6.44%, 82.99% ± 6.75%, 82.15% ± 5.96%, and 85.24% ± 6.27% across the four groups. The furniture and optimized-IEQ main effects were not significant. The interaction effect was 3.72 percentage points (95% CI, 0.44–7.00; P = 0.026), but it did not remain significant after within-family false-discovery-rate correction (q = 0.078). It was therefore interpreted as exploratory rather than confirmatory.
Task-speed data were available for 235 participants. Neither furniture (0.10 correct units/35 min; 95% CI, −2.95 to 3.16), optimized IEQ (1.51 correct units/35 min; 95% CI, −1.43 to 4.44), nor their interaction (0.24 correct units/35 min; 95% CI, −4.02 to 4.51) had a significant effect. The earlier claim of a significantly optimized IEQ effect on task speed was not reproducible and was therefore removed.
Adjustable furniture and optimized IEQ increased perceived productivity by 0.70 points (95% CI, 0.40–1.00) and 0.78 points (95% CI, 0.47–1.10), respectively (both P < 0.001). Their interaction was not significant. The corresponding effects on workspace satisfaction were 0.88 points for adjustable furniture (95% CI, 0.60–1.15), 0.46 points for optimized IEQ (95% CI, 0.21–0.72), and 0.77 points for their interaction (95% CI, 0.40–1.14); all q values were < 0.001.
Mental fatigue decreased with adjustable furniture (−0.56 points; 95% CI, −0.97 to −0.16; P = 0.006; q = 0.006) and optimized IEQ (−0.81 points; 95% CI, −1.23 to −0.39; P < 0.001; q < 0.001). The interaction effect was not significant. No significant furniture, optimized-IEQ, or interaction effects were detected for creativity. Table 6 presents group-specific week 4 values, site-adjusted HC3 factorial effects, false discovery rate q values, and the results of the per-protocol and major-deviation-exclusion analyses.
Figure 5 presents mean objective IEQ conditions, perceived environmental comfort, task accuracy and speed, perceived productivity, workspace satisfaction, mental fatigue, and creativity. All error bars represent 95% CIs, and available sample sizes are shown for outcomes with incomplete data.
Sensitivity analyses
Furniture-package adherence was 59/60 participants (98.3%) in each adjustable-furniture group. IEQ-package adherence was 57/60 participants (95.0%) in the fixed-furniture plus optimized-IEQ group and 54/60 participants (90.0%) in the adjustable-furniture plus optimized-IEQ group. Ten major deviations were recorded: two in the fixed-furniture plus basic-IEQ group, two in the adjustable-furniture plus basic-IEQ group, four in the fixed-furniture plus optimized-IEQ group, and two in the adjustable-furniture plus optimized-IEQ group.
The per-protocol population included 221 participants. The corresponding overall-comfort estimates—0.79 points for furniture (95% CI, 0.56–1.02), 0.32 points for optimized IEQ (95% CI, 0.09–0.55), and 0.50 points for the interaction (95% CI, 0.18–0.81)—were consistent with the allocated-condition analysis. Estimates from the major-deviation-exclusion analysis, which included 230 participants, were also consistent with the primary findings. Based on the verified safety and protocol deviation logs compiled from all participating sites, there were no intervention suspensions, safety-triggered workstation reassessments, intervention-related adverse events, or discontinuations due to harm during the four-week period.
Participant-clustered repeated-measures models showed furniture-by-week and IEQ-by-week changes in overall comfort (P < 0.001 and P = 0.009, respectively), with no significant three-way interaction (P = 0.274). Furniture-by-week changes were also detected for posture comfort (P < 0.001), neck discomfort (P = 0.032), lower-back discomfort (P = 0.002), and mental fatigue (P = 0.023). An IEQ-by-week change was detected for mental fatigue (P = 0.001).
Exploratory mediation analyses did not support either an ergonomic indirect effect (0.06; bootstrap 95% CI, −0.08 to 0.19) or an environmental indirect effect (0.04; bootstrap 95% CI, −0.03 to 0.12). Restricted cubic-spline analyses showed no evidence of nonlinearity for temperature (P = 0.187), CO₂ (P = 0.947), illuminance (P = 0.852), or noise (P = 0.142).
In summary, the reproducible analyses support distinct but complementary package effects. Adjustable furniture most consistently improved overall comfort and posture comfort and reduced musculoskeletal discomfort, whereas optimized IEQ improved overall comfort and environmental comfort. Their combination provided additional benefits for overall comfort and selected posture-comfort and workspace-satisfaction outcomes. Objective task speed and creativity did not differ significantly among groups, and the task-accuracy interaction was not retained after correction for multiple comparisons.
DATA AVAILABILITY:
De-identified participant-level, weekly-assessment, and workday-exposure datasets are publicly available from Zenodo (doi: https://zenodo.org/records/20657821).
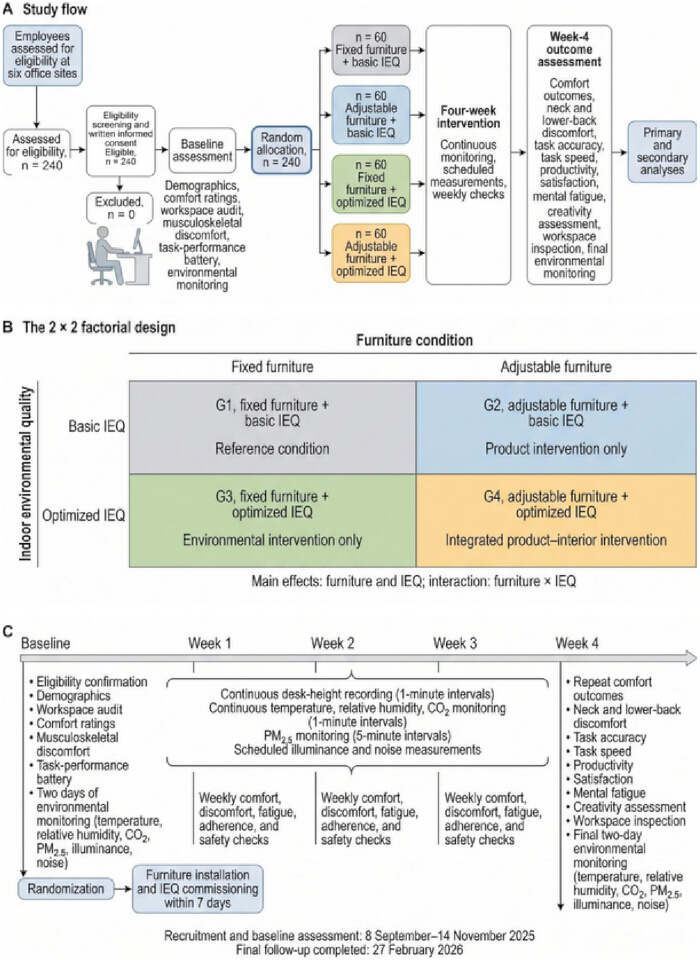
Figure 1: Study flow, factorial structure, and assessment schedule. (A) Provisional screening flow inferred from the randomized dataset: employees assessed for eligibility (n = 240), eligible and consented (n = 240), excluded (n = 0), randomly allocated (n = 240), assigned to four groups (n = 60 per group), and included in the allocated-condition primary-outcome analysis at week 4. (B) The 2 × 2 furniture-by-IEQ factorial structure. (C) Baseline assessment, installation and commissioning, continuous monitoring, weekly checks, and week 4 assessment. Abbreviations: IEQ = indoor environmental quality. Please click here to view a larger version of this figure.
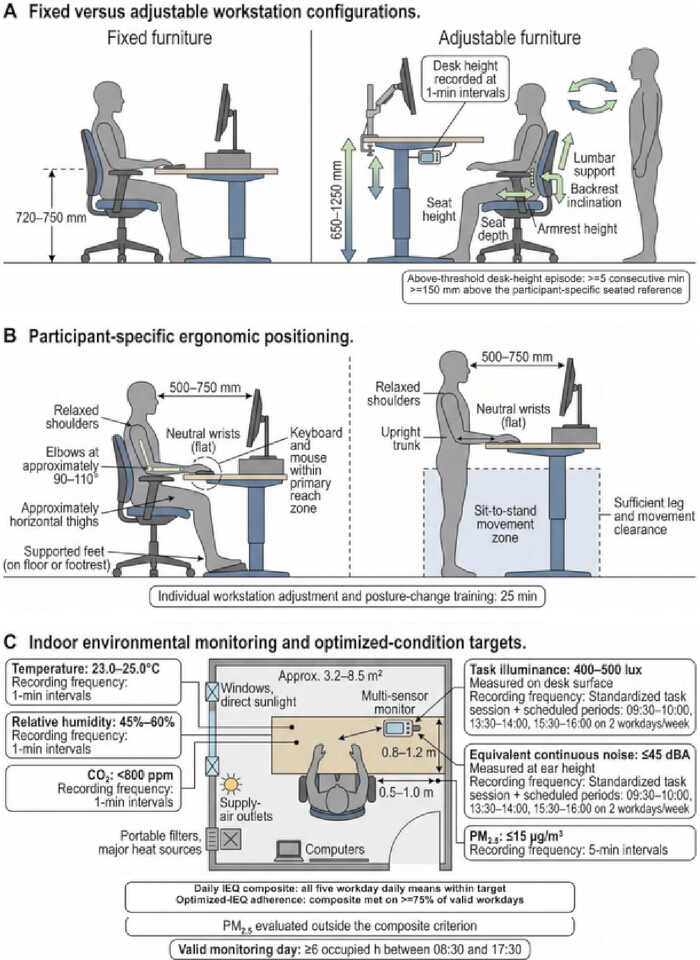
Figure 2: Multicomponent furniture and IEQ intervention packages. (A) Fixed and adjustable workstation configurations and desk-height ranges. (B) Participant-specific targets for chair, desk, monitor, keyboard, mouse, reach, wrist position, viewing distance, and sit-to-stand clearance. (C) Monitor placement, sampling intervals, operational targets, and the five-variable IEQ composite; PM2.5 was assessed separately. Abbreviations: IEQ = indoor environmental quality; PM2.5 = particulate matter ≤2.5 µm in aerodynamic diameter. Please click here to view a larger version of this figure.
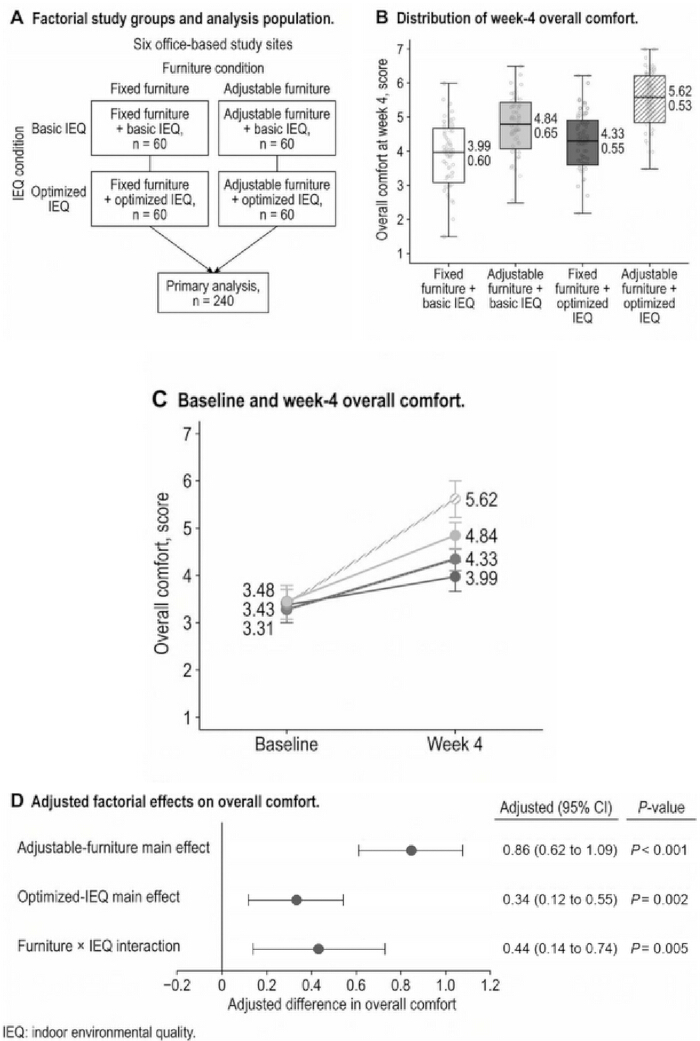
Figure 3: Week 4 overall comfort and site-adjusted factorial effects. (A) Allocated-condition groups (n = 60 per group; total n = 240). (B) Participant-level observations, box plots showing the median, interquartile range, and whiskers extending to 1.5 × the interquartile range, and group means. (C) Baseline and week 4 means; error bars represent 95% CIs. (D) Site-adjusted HC3 factorial effects with 95% CIs. Abbreviations: CI = confidence interval; IEQ = indoor environmental quality. Please click here to view a larger version of this figure.
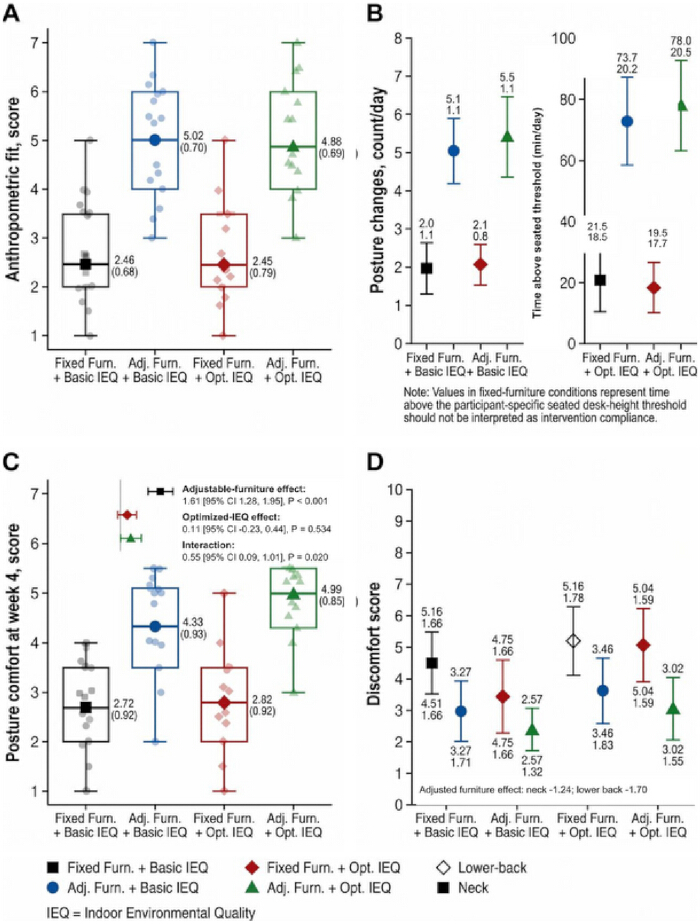
Figure 4: Furniture fit, desk-height behavior, posture comfort, and musculoskeletal discomfort.
(A) Week 4 anthropometric-fit scores. Participant-level observations are overlaid on box plots showing the median, interquartile range, and whiskers extending to 1.5 × the interquartile range. Group means and 95% confidence intervals (CIs) are also shown. (B) Mean desk-height transitions per day and above-threshold time per day. Error bars represent 95% CIs. Above-threshold time is defined as the number of minutes per day during which desk height exceeded the participant-specific seated reference height and does not confirm standing posture. (C) Week 4 posture-comfort scores. Participant-level observations are overlaid on box plots showing the median, interquartile range, and whiskers extending to 1.5 × the interquartile range. Group means, 95% CIs, and site-adjusted factorial effect estimates are shown. (D) Week 4 neck and lower-back discomfort scores. Group means and 95% CIs are shown together with the adjusted furniture effects for both outcomes. Abbreviations: AB = adjustable furniture plus basic IEQ; AO = adjustable furniture plus optimized IEQ; FB = fixed furniture plus basic IEQ; FO = fixed furniture plus optimized IEQ; CI = confidence interval; IEQ = indoor environmental quality. Please click here to view a larger version of this figure.
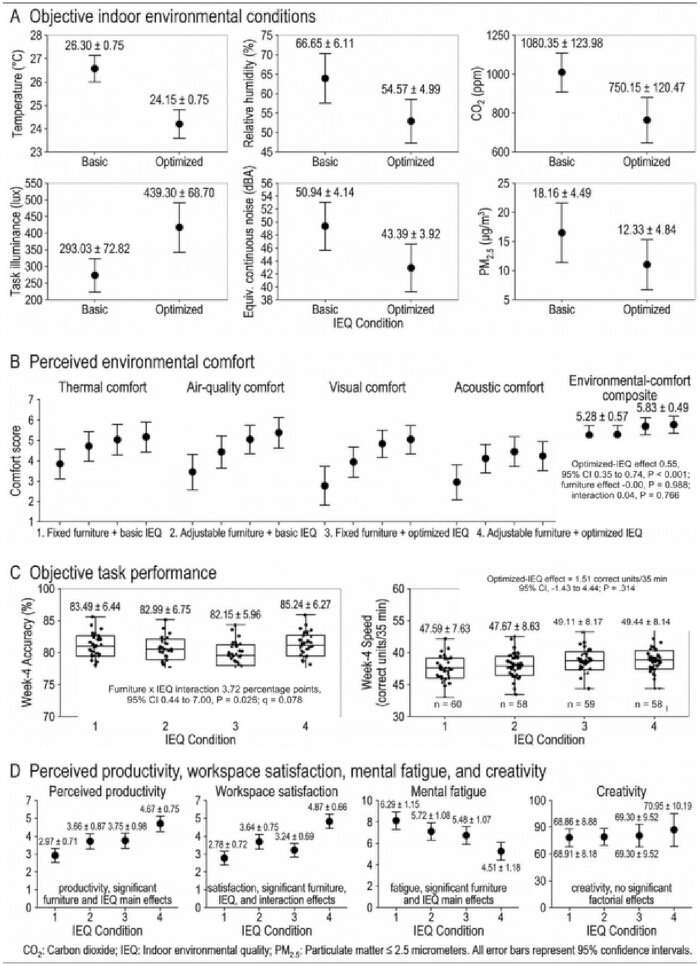
Figure 5: Objective IEQ conditions, environmental comfort, and work-related outcomes. (A) Mean objective indoor environmental quality (IEQ) conditions under the basic and optimized IEQ packages for temperature, relative humidity, carbon dioxide (CO₂), task illuminance, equivalent continuous noise level, and particulate matter ≤2.5 µm in aerodynamic diameter (PM2.5). Error bars represent 95% confidence intervals (CIs). (B) Group means and 95% CIs for thermal comfort, air-quality comfort, visual comfort, acoustic comfort, and the environmental-comfort composite. (C) Week 4 objective task performance, including task accuracy (%) and task speed (correct units per 35 min). Box plots show the median, interquartile range, and whiskers extending to 1.5 × the interquartile range; points represent participant observations, and available sample sizes are shown for outcomes with incomplete data. (D) Week 4 perceived productivity, workspace satisfaction, mental fatigue, and creativity. Points indicate group means, and error bars represent 95% CIs. Available sample sizes are shown where outcomes are incomplete. Abbreviations: CO₂ = carbon dioxide; CI = confidence interval; IEQ = indoor environmental quality; PM2.5 = particulate matter ≤2.5 µm in aerodynamic diameter. Please click here to view a larger version of this figure.
Table 1: Multicomponent intervention packages, operational targets, delivery procedures, and adherence criteria. Abbreviations: CO₂ = carbon dioxide; IEQ = indoor environmental quality; PM2.5 = particulate matter ≤2.5 µm in aerodynamic diameter. Please click here to download this file.
Table 2: Study questions and tasks, scoring and derivation rules, measurement-property limitations, practical interpretation, and assessment schedule. Abbreviations: CO₂ = carbon dioxide; IEQ = indoor environmental quality; PM2.5 = particulate matter ≤2.5 µm in aerodynamic diameter. Please click here to download this file.
Table 3: Statistical analysis framework, including primary, secondary, repeated-measures, sensitivity, and explicitly labeled exploratory analyses. Abbreviations: CI = confidence interval; CO₂ = carbon dioxide; IEQ = indoor environmental quality; PM2.5 = particulate matter ≤2.5 µm in aerodynamic diameter. Please click here to download this file.
Table 4: Baseline participant, occupational, workspace, and outcome characteristics, with site-by-group counts. Values are presented as mean ± standard deviation unless otherwise indicated. No significance testing of baseline characteristics was performed. Abbreviation: IEQ = indoor environmental quality. Please click here to download this file.
Table 5: Furniture fit and desk-height behavior, objective IEQ conditions, perceived environmental comfort, adherence, protocol deviations, per-protocol counts, and target attainment. Environmental-comfort values and objective conditions are descriptive. Target-attainment percentages represent the proportion of workday daily means within the prespecified range rather than the proportion of all one-minute intervals. PM2.5 was assessed separately from the five-variable composite. The second worksheet reports target attainment by site. Abbreviations: CO₂ = carbon dioxide; dBA = A-weighted decibels; IEQ = indoor environmental quality; PM2.5 = particulate matter ≤2.5 µm in aerodynamic diameter. Please click here to download this file.
Table 6: Week 4 outcomes, site-adjusted factorial effects, and sensitivity analyses. Group values are presented as mean ± standard deviation with the available n. Effects were estimated using factorial linear models with six site indicators, HC3 robust standard errors, and baseline adjustment when the corresponding baseline variable was available. Positive estimates indicate higher scores, whereas negative estimates for discomfort and fatigue indicate improvement. The primary outcome was not adjusted for multiplicity. For secondary outcomes, q values were calculated using the Benjamini–Hochberg procedure within outcome families. The second worksheet reports the per-protocol and major-deviation-exclusion analyses. Abbreviations: CI = confidence interval; IEQ = indoor environmental quality. Please click here to download this file.
Discussion
This six-site factorial study demonstrates that adjustable furniture and optimized indoor environmental quality (IEQ) provided distinct but complementary benefits for the workspace experience. Adjustable furniture improved overall comfort and posture while reducing neck and lower-back discomfort, whereas optimized IEQ primarily improved overall and environmental comfort. Their combination produced the greatest improvement in overall comfort, supporting the value of integrating ergonomic and environmental interventions. Although an interaction was observed for task accuracy, it did not remain significant after false-discovery-rate correction, and neither task speed nor creativity differed between groups.
These findings are consistent with recent evidence while addressing a different research question. A six-month sit-to-stand workstation trial reported sustained ergonomic and behavioral benefits, and a recent study demonstrated that adjustable workstations reduced occupational sedentary time. Similarly, studies of teleworkers have shown that workstation usability depends not only on adjustability but also on appropriate implementation and user support11,12,13. Recent reviews have also emphasized that thermal, air-quality, lighting, and acoustic conditions interact to influence occupant comfort rather than acting as isolated environmental factors14. The present study extends this literature by evaluating furniture and IEQ intervention packages simultaneously within a factorial design, demonstrating that these domains contribute to different aspects of user experience and together provide greater overall comfort than either intervention alone.
The findings also have practical implications for workplace design and management. Designers should consider sit-to-stand clearance, neutral reach, monitor adjustability, and chair support as integrated components of ergonomic workstation design rather than independent features. Employers should complement adjustable furniture with individualized workstation setups, user training, and progressive adoption rather than encouraging prolonged standing without guidance. Likewise, facility managers should routinely monitor thermal, ventilation-related, lighting, acoustic, and particulate conditions in occupied workspaces to ensure that environmental targets are maintained. These results suggest that ergonomic and environmental improvements should be implemented together, as neither can substitute for the other.
Several limitations should be considered when interpreting these findings. The four-week intervention period does not permit conclusions regarding long-term health, productivity, absenteeism, or durability of the observed effects. Participants were computer-based office workers aged 20–55 years recruited from six sites, which may limit generalizability to other occupations, older populations, industrial workplaces, flexible work environments, or different climatic and building conditions. Participants and personnel responsible for workstation installation could not be blinded, and several study-specific rating scales have not yet been established to have minimal important differences. Furthermore, exploratory mediation analyses did not identify significant indirect effects, and the short follow-up period limits conclusions regarding causal pathways.
Future studies should evaluate these interventions over longer follow-up periods using prospectively registered protocols, validated outcome measures, objective posture-monitoring technologies, personal environmental exposure assessments, and economic evaluations. Adaptive or personalized IEQ control strategies combined with individualized workstation coaching may further optimize worker comfort and performance. Collectively, the present findings indicate that coordinated furniture and IEQ intervention packages improve complementary dimensions of short-term workplace comfort, with the combined intervention providing the greatest overall benefit.
Disclosures
The author has nothing to disclose.
Acknowledgements
The author gratefully acknowledges the administrative and technical support provided by the Shanghai Material Engineering School throughout the implementation of this study. Special thanks are also extended to the participants across the six office sites for their time and cooperation during the four-week environmental and ergonomic intervention.
Materials
| Name | Company | Catalog Number | Comments |
|---|---|---|---|
| Adjustable ergonomic office chair | Herman Miller | Aeron | Adjustable ergonomic chair used to provide standardized seated workstation conditions. |
| Adjustable monitor arm | Ergotron | LX Desk Monitor Arm | Adjustable arm used to position the computer monitor at the required height and viewing distance. |
| Aerosol / PM2.5 monitor | TSI Incorporated | DustTrak II 8530 | Instrument used to measure airborne particulate matter concentrations, including PM2.5, in the workplace environment. |
| Electric sit-stand desk | IKEA | IDÅSEN | Height-adjustable workstation desk used to support seated and standing work configurations. |
| Figure-generation libraries | Python Package Index | matplotlib 3.11.1; seaborn 0.13.2 | Python libraries used to generate figures and graphical visualizations. |
| Illuminance meter | Konica Minolta | T-10A | Instrument used to measure workplace illuminance levels. |
| Indoor air quality monitor | TSI Incorporated | Q-Trak 7565 | Instrument used to monitor indoor environmental conditions, including temperature, relative humidity, and carbon dioxide concentration. |
| Participant-level analysis, weekly assessments, and workday exposure records dataset | Zenodo | DOI: 10.5281/zenodo.20657821 | Repository dataset containing participant-level data, weekly assessments, and workday environmental exposure records used in the study analyses. |
| Sound level meter | Brüel & Kjær | Type 2250 | Instrument used to measure workplace sound pressure levels. |
| Statistical programming software | Python Software Foundation | Python 3.12.13 | Programming environment used for data processing, statistical analysis, and computational workflows. |
| Statistical software libraries | Python Package Index | pandas 3.0.5; NumPy 2.5.1; SciPy 1.18.0; statsmodels 0.14.6 | Python libraries used for data manipulation, numerical computation, statistical testing, and statistical modeling. |
References
- Parry SP, et al. Workplace interventions for increasing standing or walking for decreasing musculoskeletal symptoms in sedentary workers. Cochrane Database Syst Rev. 2019;11:CD012487.
- Karakolis T, Callaghan JP. The impact of sit-stand office workstations on worker discomfort and productivity: A review. Appl Ergon. 2014;45(3):799-806.
- Thorp AA, Kingwell BA, Owen N, Dunstan DW. Breaking up workplace sitting time with intermittent standing bouts improves fatigue and musculoskeletal discomfort in overweight/obese office workers. Occup Environ Med. 2014;71(11):765-71.
- Davis KG, Kotowski SE. Postural variability: An effective way to reduce musculoskeletal discomfort in office work. Hum Factors. 2014;56(7):1249-61.
- Zagreus L, Huizenga C, Arens E, Lehrer D. Listening to the occupants: A Web-based indoor environmental quality survey. Indoor Air. 2004;14(Suppl. 8):65-74.
- Wargocki P, et al. Ventilation and health in non-industrial indoor environments: Report from a European multidisciplinary scientific consensus meeting. Indoor Air. 2002;12(2):113-28.
- Wyon DP. The effects of indoor air quality on performance and productivity. Indoor Air. 2004;14(Suppl. 7):92-101.
- Woo J, Rajagopalan P, Francis M, Garnawat P. An indoor environmental quality assessment of office spaces at an urban Australian university. Build Res Inf. 2022;50(6):647-64.
- Ortiz MA, Bluyssen PM. Profiling office workers based on their self-reported preferences of indoor environmental quality and psychosocial comfort at their workplace during COVID-19. Build Environ. 2022;211:108742.
- Awada M, Lucas G, Becerik-Gerber B, Roll S. Associations among home indoor environmental quality factors and worker health while working from home during the COVID-19 pandemic. J Eng Sustain Build Cities. 2021;2(4):041004.
- Júdice PB, Silva H, Teno SC, Hetherington-Rauth M. The effectiveness of a 6-month intervention with sit-stand workstation in office workers: Results from the SUFHA cluster randomized controlled trial. Work. 2024;79(2):879-90.
- Salzar TL, et al. Stand-capable workstations reduce occupational sedentary time among administrative workers. IISE Trans Occup Ergon Hum Factors. 2024;12(3):162-74.
- Koubaa N, et al. Usability of an intelligent sit-stand desk in office teleworkers. Int J Hum Comput Interact. 2024;40(22):7469-80.
- Fissore VI, Fasano S, Puglisi GE, Shtrepi L, Astolfi A. Indoor environmental quality and comfort in offices: A review. Buildings. 2023;13(10):2490.