This cross-sectional latent profile analysis of 1,420 Chinese college students identified four distinct sleep profiles using the PSQI. Healthier sleep profiles were significantly associated with higher moderate-to-vigorous physical activity levels, suggesting sleep-pattern-specific targets for campus health promotion.
Research Article
Latent Profile Analysis of Sleep Patterns and their Association with Physical Activity Levels Among Chinese College Students
* These authors contributed equally
In This Article
Summary
Abstract
This cross-sectional study aimed to identify latent profiles of sleep patterns among college students and examine their associations with physical activity (PA) levels, thereby providing empirical evidence for targeted health interventions in university settings. A total of 1,420 college students were recruited using multistage stratified cluster random sampling from three comprehensive universities in southern China. Sleep quality and PA were assessed using the Pittsburgh Sleep Quality Index (PSQI) and the International Physical Activity Questionnaire-Short Form (IPAQ-SF), respectively. Latent profile analysis (LPA), chi-square tests, and multinomial logistic regression analyses were performed using appropriate statistical software. Four latent sleep profiles were identified based on model-estimated class probabilities: healthy sleep (44.7%), insufficient sleep (24.8%), poor sleep quality (20.3%), and severe sleep disturbance (10.2%); the corresponding observed proportions based on most-likely class assignment were 45.0%, 25.0%, 20.0%, and 10.0% (n = 639, 355, 284, and 142, respectively). Gender and PA level differed significantly across the profiles. Compared with students in the severe sleep disturbance group, students in the healthy sleep group were more likely to report moderate PA (odds ratio (OR) = 4.69, 95% confidence interval (CI): 2.92–7.51) and high PA (OR = 7.55, 95% CI: 4.41–12.91). Students in the insufficient sleep group were also more likely to report moderate PA (OR = 2.98, 95% CI: 1.83–4.86) and high PA (OR = 5.02, 95% CI: 2.84–8.87). College students’ sleep patterns showed clear heterogeneity. Favorable sleep patterns were associated with higher PA levels. Because of the cross-sectional design, causal relationships cannot be inferred. Differentiated intervention strategies should be developed according to subgroup-specific sleep characteristics, and PA promotion may be considered a potential behavioral target for students with poor sleep.
Introduction
Sleep is essential not only for maintaining basic physiological functions but also for supporting physical and mental health, cognitive development, and emotional regulation1,2. In contemporary fast-paced societies, however, sleep disorders have become a global public health concern. Sleep problems are particularly prominent among college students, who often experience reduced parental supervision after entering university and face academic pressure, interpersonal adjustment, and excessive use of electronic devices3. Epidemiological studies have shown that approximately 25%–60% of college students worldwide report varying degrees of poor sleep quality or sleep deprivation4,5. Persistent sleep problems may impair central nervous system function, leading to inattention and memory decline; they may also increase the risk of internalizing mental health problems, such as depression and anxiety6,7, as well as the future risk of cardiovascular disease and metabolic syndrome8.
Previous sleep studies have primarily adopted a variable-centered analytical perspective, evaluating group-level sleep status using total scores from standardized scales such as the Pittsburgh Sleep Quality Index (PSQI) or the mean scores of specific dimensions9. Although this approach provides an intuitive estimate of overall sleep severity, it implicitly assumes that the study population is homogeneous. In reality, sleep is a multidimensional physiological process involving sleep duration, sleep latency, sleep efficiency, nocturnal awakenings, and daytime dysfunction10. Individuals with the same total PSQI score may exhibit substantially different symptom combinations; for example, one student may primarily have difficulty initiating sleep, whereas another may experience early awakening and daytime sleepiness. In recent years, person-centered approaches have received increasing attention. Latent profile analysis (LPA) can identify unobserved heterogeneous subgroups in the data by maximizing between-profile differences and minimizing within-profile differences11,12. Using LPA, researchers can more accurately characterize specific sleep profiles among college students13, thereby providing more precise targets for intervention.
Physical activity (PA) is widely recommended by the World Health Organization and other public health guidelines as a cornerstone of health promotion across the life course14,15. Empirical studies and meta-analyses have shown that regular moderate-to-vigorous physical activity can improve cardiorespiratory fitness and reduce mortality16,17, while also helping to relieve psychological stress and improve cognitive function18,19. Physical activity is also considered an effective non-pharmacological intervention for sleep problems20,21. Positive associations between physical activity and sleep quality have been reported in cohort studies using objective devices such as accelerometers22,23,24 and in cross-sectional studies based on self-reported questionnaires25,26. Moreover, exercise and sleep appear to have a bidirectional relationship: adequate sleep may enhance motivation and endurance for physical activity, whereas daytime energy expenditure may promote slow-wave sleep at night27,28.
Although there is broad agreement regarding the benefits of physical activity for overall sleep quality, the existing literature has several limitations. Most studies have treated physical activity as an independent variable predicting a single sleep score, thereby overlooking the possibility that different sleep patterns may correspond to distinct combinations of lifestyle characteristics29,30. Whether physical activity levels differ across latent sleep profiles among college students remains insufficiently understood.
Against this background, this study aimed to: (1) identify latent profiles based on multidimensional indicators of sleep quality among Chinese college students using LPA; and (2) examine the associations between sleep profiles and physical activity levels (low, moderate, and high) after controlling for demographic variables. We hypothesized that multiple heterogeneous sleep profiles would be present among college students and that students with a healthy sleep pattern would be more likely to achieve moderate-to-vigorous physical activity levels than those with severe sleep disturbance.
Protocol
This study was approved by the Biomedical Ethics Committee of Jishou University (Approval No. JSDX-2023-0034). All participants were full-time undergraduate students aged 18–25 years and provided written informed consent before participation. Permission was obtained from the participating universities. The survey data were used only for academic research and were analyzed anonymously. The study was carried out in compliance with the Declaration of Helsinki and local institutional requirements.
Participant recruitment and sampling design
A cross-sectional survey was conducted among undergraduates from three comprehensive universities in southern China between September and December 2025 using a multistage stratified cluster random sampling design. In the first stage, three comprehensive universities were selected from a list of public comprehensive universities in southern China using stratified random sampling, with strata defined by provincial administrative region to ensure geographic representation. In the second stage, within each selected university, two to three intact classes from each grade level (freshman through senior) were randomly selected as cluster sampling units using computer-generated random numbers, yielding a total of 28 classes across the three universities. All students in the selected classes were invited to participate, as shown in Figure 1. The inclusion criteria were as follows: (1) full-time undergraduate status; (2) age between 18 and 25 years; and (3) voluntary participation with written informed consent. The exclusion criteria were: (1) recent severe physical disease or contraindications to exercise, such as fracture or severe heart disease; (2) current psychiatric medication use, such as treatment for severe depression or schizophrenia; and (3) questionnaire completion time of less than 180 s or obvious logical inconsistencies, such as selecting the same option for all items. A total of 1,500 questionnaires were distributed. Of the 80 invalid questionnaires excluded during data cleaning, 24 were excluded due to completion time below 180 s, 20 due to logical inconsistencies (e.g., identical responses across all items or contradictory answers), 18 due to age outside the 18–25 year range, 11 due to excessive missing data (more than 20% of items), and 7 due to self-reported severe physical disease or current psychiatric medication use. This left 1,420 valid questionnaires for analysis, with an effective response rate of 94.67%.
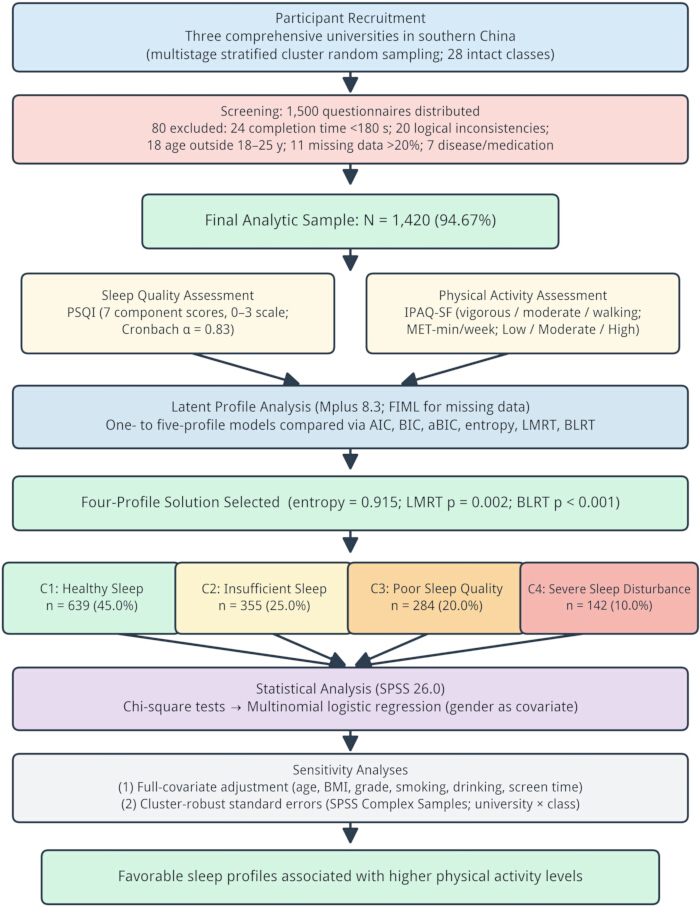
Figure 1: Study design and analytical workflow. Schematic overview of participant recruitment and screening (1,500 questionnaires distributed; 80 excluded; N = 1,420 included), assessment with the PSQI and IPAQ-SF, latent profile analysis (one- to five-profile models compared using AIC, BIC, aBIC, entropy, LMRT, and BLRT), assignment to four sleep profiles, bivariate chi-square tests, multinomial logistic regression with gender as a covariate, and sensitivity analyses (full-covariate adjustment and cluster-robust standard errors). Please click here to view a larger version of this figure.
Demographic and lifestyle assessment
A self-designed questionnaire was utilized to obtain demographic and sociological characteristics, including gender (male/female), age (in years), grade (freshman/sophomore/junior/senior), place of origin (urban/rural), body mass index (BMI), smoking history, drinking history, and average daily screen time. BMI was calculated as body weight in kilograms divided by the square of height in meters (BMI = weight [kg] / height [m]2). Self-reported height and weight were screened for implausible values prior to analysis; cases with height <140 cm or >200 cm, weight <30 kg or >150 kg, or BMI <12 kg/m2 or >40 kg/m2 were flagged and verified against original records, with confirmed outliers excluded. Smoking status was categorized as never, occasional (smoking on some days but not daily), or regular (daily smoking), based on self-reported smoking behavior over the previous month. Alcohol consumption was categorized as never, occasional (drinking less than once per week), or regular (drinking at least once per week), over the previous month. Average daily screen time was assessed by asking participants to report the total number of hours per day spent on smartphones, computers, tablets, and television over the previous month, recorded as a continuous variable. The questionnaire was pilot-tested among 30 undergraduate students before formal data collection to assess item clarity and completion time; minor wording adjustments were made based on pilot feedback. Previous studies have suggested that these variables may confound the association between sleep and physical activity30,31. All instruments, software, and materials used in this study are listed in the Table of Materials.
Sleep quality assessment
The PSQI, developed by Buysse et al.9, was used to assess participants’ sleep quality over the previous month. The scale includes 19 self-rated items that form seven components: subjective sleep quality, sleep onset latency, sleep duration, habitual sleep efficiency, sleep disturbances, use of hypnotic medication, and daytime dysfunction. Each component is scored from 0 (no difficulty) to 3 (severe difficulty). The scores of these seven continuous components were used as observed indicators for LPA. The PSQI has demonstrated good reliability and validity among college student populations in China and internationally30. In the present study, Cronbach’s alpha for the scale was 0.83.
Physical activity assessment
The IPAQ-SF, developed by Craig et al.32, was used to assess participants’ physical activity over the previous seven days. The questionnaire records the frequency (days/week) and duration (minutes/day) of vigorous physical activity, moderate-intensity physical activity, and walking. Metabolic equivalent of task (MET) values were calculated according to the IPAQ scoring protocol: walking MET-min/week = 3.3 × duration × frequency; moderate-intensity MET-min/week = 4.0 × duration × frequency; and vigorous-intensity MET-min/week = 8.0 × duration × frequency. The MET values for the three activity types were summed to obtain total physical activity. Participants were classified into high PA, moderate PA, and low PA according to the IPAQ-SF scoring criteria validated in college students33. High PA was defined as vigorous activity on at least three days with a total physical activity level of at least 1,500 MET-min/week, or any combination of walking, moderate-intensity, or vigorous-intensity activities on seven or more days with a total physical activity level of at least 3,000 MET-min/week. Moderate PA was defined as vigorous activity on at least three days for at least 20 minutes per day, or moderate-intensity activity and/or walking on at least five days for at least 30 minutes per day, or any combination of activities reaching at least 600 MET-min/week. Low PA was defined as not meeting the criteria for moderate or high PA. Data cleaning followed the official IPAQ scoring protocol: participants reporting more than 16 h of total activity per day were excluded; per-category daily durations were truncated at 180 min before MET-minute calculation; and cases with logically inconsistent responses were removed during data cleaning.
Statistical analysis
First, conduct LPA using latent profile modeling software (see Table of Materials)34. Of the 1,420 participants, 33 (2.3%) had partial missing data on the PSQI, with 69 of 9,940 component-level responses missing (0.69%; i.e., 1,420 participants × seven PSQI component scores). The full-information maximum likelihood (FIML) method was used to handle these missing values under the missing-at-random assumption. Models with one to five profiles were estimated sequentially. Model fit was evaluated using the Akaike information criterion (AIC), Bayesian information criterion (BIC), sample-size adjusted BIC (aBIC), entropy, the Lo-Mendell-Rubin likelihood ratio test (LMRT), and the bootstrap likelihood ratio test (BLRT). Lower AIC, BIC, and aBIC values indicate better relative fit, whereas entropy values closer to 1 indicate higher classification accuracy. The LMRT and BLRT were used to determine whether a model with k profiles fit significantly better than a model with k − 1 profiles. The optimal profile solution was selected by jointly considering statistical fit indices, entropy, class size (no profile containing less than 5% of the sample), and substantive interpretability, following established guidelines for latent profile analysis11,35. After the optimal profile solution was selected, individuals’ most likely class membership was exported to statistical analysis software (see Table of Materials) for subsequent analyses. Pearson chi-square tests were used to examine differences in demographic characteristics and physical activity levels across sleep profiles. Bivariate chi-square tests showed that only gender and physical activity level differed significantly across the four sleep profiles (both p < 0.001), whereas age, grade, BMI, smoking, drinking, and screen time did not (all p > 0.05; see Supplementary Table 1). Therefore, only gender was included as a covariate in the multinomial logistic regression model, consistent with the principle of parsimony. A sensitivity analysis adjusting for all collected covariates yielded the same pattern and significance of results (Supplementary Table 2). Multinomial logistic regression was performed with physical activity level as the dependent variable (low PA = 0, moderate PA = 1, high PA = 2) and sleep profile as the core independent variable. Odds ratios (ORs) and 95% confidence intervals (CIs) were calculated. All tests were two-sided, and statistical significance was set at p < 0.05. Because participants were recruited through intact classes nested within universities, we conducted a sensitivity analysis using the complex-samples module of the statistical software (see Table of Materials), specifying university and class as clustering variables, to obtain design-adjusted standard errors. The results were consistent with those from the standard multinomial logistic regression (Supplementary Table 3). The de-identified raw dataset with English variable labels and a codebook is provided as Supplementary File 1.
Results
Models with one to five latent profiles were extracted. As shown in Table 1, AIC, BIC, and aBIC decreased as the number of profiles increased. The four-profile model had the highest entropy value (0.915), and both the LMRT and BLRT were significant (p < 0.001). In contrast, the LMRT for the five-profile model was not significant (p = 0.085), and entropy decreased to 0.880. Therefore, although the five-profile model showed lower information criteria, the four-profile model was selected because it provided a better balance between classification accuracy, model parsimony, class size, and substantive interpretability. The profile labels were assigned based on the conditional means of the seven PSQI component scores across classes (Figure 2), consistent with recommended LPA reporting practices11.
Table 1: Model fit indices for latent profile analysis of college students’ sleep patterns. AIC, Akaike information criterion; BIC, Bayesian information criterion; aBIC, sample-size adjusted BIC; LMRT, Lo-Mendell-Rubin likelihood ratio test; BLRT, bootstrap likelihood ratio test. Please click here to download this Table.
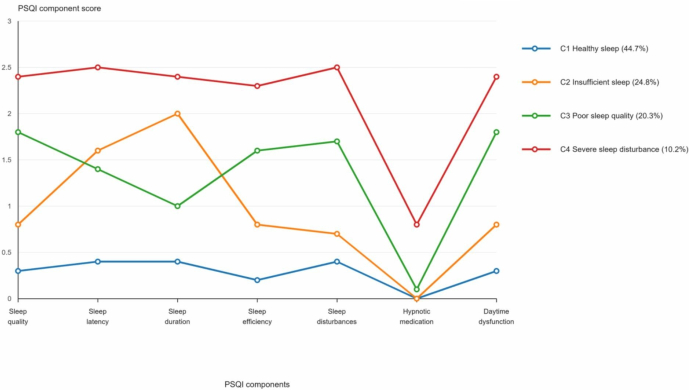
Figure 2: LPA of sleep patterns: four-profile solution. The line chart shows PSQI component scores across the four latent sleep profiles: healthy sleep, insufficient sleep, poor sleep quality, and severe sleep disturbance. Please click here to view a larger version of this figure.
Based on the characteristics of the PSQI component scores, the four profiles were labeled as the healthy sleep group (C1), insufficient sleep group (C2), poor sleep quality group (C3), and severe sleep disturbance group (C4). The model-estimated class probabilities were 0.447, 0.248, 0.203, and 0.102, respectively. Based on most-likely class assignment, the observed counts were 639 (45.0%), 355 (25.0%), 284 (20.0%), and 142 (10.0%) for C1–C4, respectively. Chi-square tests indicated significant differences in gender and physical activity levels across the profiles (p < 0.001; Table 2). The four-profile solution provided the best balance between model fit and theoretical interpretability, with high classification accuracy (entropy = 0.915).
Healthy sleep group (C1, 45.0%): Students in this group had low scores on all seven PSQI components, indicating relatively regular sleep and better sleep quality. Insufficient sleep group (C2, 25.0%): This group was characterized by relatively high scores for sleep duration and sleep latency, whereas daytime dysfunction was not prominent. Poor sleep quality group (C3, 20.0%): Students in this group had relatively high scores for subjective sleep quality, sleep disturbances, and daytime dysfunction, together with relatively low sleep efficiency. Severe sleep disturbance group (C4, 10.0%): This subgroup showed high scores across most PSQI components and reported higher hypnotic medication scores than the other profiles, suggesting elevated risk of clinically relevant sleep problems rather than a confirmed clinical diagnosis.
The exact conditional means and standard deviations of the seven PSQI component scores for each profile are reported in Supplementary Table 4.
Table 2: Distribution of demographic characteristics and physical activity levels across sleep profiles. C1, healthy sleep group; C2, insufficient sleep group; C3, poor sleep quality group; C4, severe sleep disturbance group. Please click here to download this Table.
Physical activity level was entered as the dependent variable, with low PA as the reference category. Sleep profile was entered as the independent variable, with the severe sleep disturbance group as the reference category, and gender was controlled. As shown in Table 3, students in the healthy sleep and insufficient sleep groups were significantly more likely to report moderate and high PA than those in the severe sleep disturbance group. These findings support an association between favorable sleep profiles and higher PA levels, but the cross-sectional design does not allow causal inference.
Table 3: Multinomial logistic regression of sleep profiles and physical activity levels among college students. Low physical activity was the reference category for the outcome, and the severe sleep disturbance group was the reference category for sleep profile. Please click here to download this Table.
DATA AVAILABILITY:
The de-identified raw data and analysis code supporting the findings of this study are openly available in Figshare at https://doi.org/10.6084/m9.figshare.33340908.
Supplementary File 1: De-identified raw dataset (Sleep_LPA_Raw_Data_N1420.xlsx) with English variable labels and codebook.Please click here to download this file.
Supplementary Table 1: Bivariate tests of covariate differences across sleep profiles.
Note: Categorical variables were tested with Pearson chi-square tests; continuous variables with one-way ANOVA. Only genders differed significantly across profiles (p < 0.001). Detailed category distributions for grade, origin, smoking, drinking, and major are omitted for brevity but are available from the raw data.Please click here to download this file.
Supplementary Table 2: Multinomial logistic regression adjusting for all covariates (sensitivity analysis).
Note: Reference category for PA: Low PA; reference category for sleep profile: C4 (Severe disturbance). Model adjusted for gender, age, BMI, screen time, grade, place of origin, smoking, drinking, and major. The direction and significance of all associations are consistent with the primary analysis (Table 3), which adjusted only for gender.Please click here to download this file.
Supplementary Table 3: Multinomial logistic regression with cluster-robust standard errors (SPSS Complex Samples).
Note: Standard errors adjusted for clustering by university and class (SPSS Complex Samples equivalent; N = 1,420, clusters = 3 universities × intact classes). B coefficients are identical to the primary analysis (Table 3); only standard errors and p-values differ. C1 and C2 remain significantly associated with both moderate and high PA; C3 remains non-significant.Please click here to download this file.
Supplementary Table 4: Means and standard deviations of PSQI component scores by sleep profile.
Note: Values are conditional means (standard deviations) based on most-likely class assignment. All seven PSQI components and the total score differed significantly across profiles (one-way ANOVA, all p < 0.001). C1 = healthy sleep; C2 = insufficient sleep; C3 = poor sleep quality; C4 = severe sleep disturbance.Please click here to download this file.
Discussion
Using a relatively large cross-sectional sample, this study applied a person-centered LPA approach to identify four heterogeneous sleep profiles among Chinese college students and further examined the associations between these profiles and different physical activity levels. The findings provide a useful perspective for understanding the clustering of sleep and exercise-related health behaviors among college students and offer more precise targets for public health interventions in university settings.
This study classified college students’ sleep patterns into four profiles: healthy sleep, insufficient sleep, poor sleep quality, and severe sleep disturbance. Although the healthy sleep group accounted for the largest proportion (45.0%), more than half of the students (55.0%) were classified into profiles characterized by poor sleep. This finding is consistent with international evidence indicating a high prevalence of sleep problems among adolescents and emerging adults3,4. In particular, the proportion of female students in the severe sleep disturbance group was substantially higher than that of male students (68.3% vs. 31.7%), which is consistent with previous findings on sex differences in sleep. Fluctuations in female hormone levels across the menstrual cycle, including cyclical changes in estrogen and progesterone, may increase vulnerability to sleep disturbances10. From a psychological perspective, female students may also be more sensitive to academic and interpersonal stress and more likely to internalize negative emotions. Such rumination may prolong sleep latency and reduce sleep depth7. In addition, 25.0% of students belonged to the insufficient sleep group. Based on previous literature, this profile may be partly attributable to prolonged pre-bedtime screen time and blue-light exposure from mobile devices, as well as relatively weak time-management skills30; however, these factors were not directly assessed in the present study and should be examined in future research.
This study found significant graded differences in physical activity levels across sleep profiles. Multinomial logistic regression showed that, compared with students in the severe sleep disturbance group, those in the healthy sleep group had substantially higher odds of achieving high PA (OR = 7.55). These findings are consistent with the concept of health behavior clustering in lifestyle medicine, suggesting that favorable sleep patterns and regular physical activity may co-occur within the same individuals.
The observed association between sleep profiles and PA may be explained by several possible physiological and psychological pathways, although these mechanisms were not directly tested in the present cross-sectional study. First, it is possible that regular physical activity facilitates sleep. Moderate-to-vigorous physical activity can induce an acute increase in body temperature, followed by a compensatory post-exercise decline that may facilitate sleep initiation and increase the proportion of slow-wave sleep17. Regular physical activity may also regulate the autonomic nervous system by enhancing vagal tone and reducing sympathetic overactivation. In addition, exercise-related endorphins and brain-derived neurotrophic factor may help alleviate depression and anxiety, thereby reducing psychological contributors to insomnia36,37. Outdoor activity during the day may further increase retinal light exposure, helping to calibrate circadian rhythms and stabilize melatonin secretion38. Second, it is also plausible that poor sleep constrains daytime PA. Students in the severe sleep disturbance group may experience daytime fatigue and sleepiness due to insufficient nocturnal recovery, as reflected by high daytime dysfunction scores on the PSQI. This depletion of energy may reduce self-efficacy and motivation for physical exertion20,28. Experimental and review evidence suggests that sleep and exercise may influence each other through recovery, fatigue, affective, and circadian pathways28,39. Therefore, students with severe sleep problems may be more likely to adopt sedentary lifestyles. These proposed bidirectional pathways remain speculative and should be verified through longitudinal cohort studies and randomized controlled trials.
This study has the strengths of a relatively large sample and a person-centered analytical approach; however, several limitations should be acknowledged. First, because the study used a cross-sectional design, causal relationships between sleep patterns and physical activity cannot be inferred. Future longitudinal studies or randomized controlled trials are needed to test the effects of exercise interventions on specific sleep profiles39. Second, both sleep and physical activity were assessed using self-report scales, which may be affected by recall bias and social desirability bias. Future research should incorporate polysomnography, accelerometers, or wearable devices to obtain more objective physiological and behavioral data22,24. Third, the sample was limited to college students from universities in southern China; therefore, cultural background and climatic conditions may limit the generalizability of the findings. Future studies should include participants from broader geographic regions and occupational groups. Fourth, although the complex-samples sensitivity analysis adjusting for clustering by university and class yielded consistent results, the chi-square tests did not explicitly account for the intraclass correlation introduced by cluster sampling. Future studies with a larger number of clusters should consider multilevel latent profile analysis or multilevel regression from the design stage. Fifth, the multinomial logistic regression used the most likely class membership exported from the latent profile model, which does not fully account for classification uncertainty. Although the high entropy (0.915) and average posterior probabilities above 0.80 for all classes suggest that classification accuracy was high, future studies should employ model-based approaches such as the Bolck-Croon-Hagenaars (BCH) three-step procedure to more appropriately propagate classification uncertainty into auxiliary analyses.
College students’ sleep patterns are not homogeneous but show clear group heterogeneity. In this study, they were classified into four latent profiles: healthy sleep, insufficient sleep, poor sleep quality, and severe sleep disturbance. Favorable sleep patterns were positively associated with moderate and high levels of physical activity. These findings suggest that college educators and public health policymakers should avoid one-size-fits-all approaches when promoting students’ mental health and physical fitness. For students in the insufficient sleep group, interventions may focus on time management and pre-bedtime behaviors. For students in the severe sleep disturbance group, professional psychological support, including cognitive behavioral therapy for insomnia (CBT-I), may be considered when clinically indicated40. Physical activity level may serve as a useful behavioral marker when identifying students at risk of poor sleep, but longitudinal and intervention studies are needed to determine whether increasing physical activity can improve specific sleep profiles.
Disclosures
The author(s) declare that this work was conducted in the absence of any commercial or financial relationships that could be construed as a potential conflict of interest.
Acknowledgements
We are grateful to the participating universities and all students who completed the survey. This work was supported by the Humanities and Social Sciences Research Project for Young Scholars of the Ministry of Education (Grant No. 23YJC890059); the Hunan Provincial Education and Teaching Reform Research Project (Grant No. 202502000069).
Materials
| Name | Company | Catalog Number | Comments |
|---|---|---|---|
| Demographic and lifestyle questionnaire | Self-designed by the study team | N/A | Used to collect gender, age, grade, place of origin, body mass index, smoking history, drinking history, and average daily screen time. |
| Pittsburgh Sleep Quality Index (PSQI) | Buysse et al., 1989 | DOI: 10.1016/0165-1781(89)90047-4 | Used to assess sleep quality over the previous month. Seven component scores were used as observed indicators for latent profile analysis. |
| International Physical Activity Questionnaire-Short Form (IPAQ-SF) | Craig et al., 2003 | DOI: 10.1249/01.MSS.0000078924.61453 .FB | Used to assess walking, moderate-intensity physical activity, and vigorous physical activity over the previous seven days. |
| Written informed consent form | Study team and participating universities | Ethics approval No. JSDX-2023-0034 | Used to document voluntary participation by undergraduate students aged 18-25 years. |
| Questionnaire data collection procedure | Participating universities in southern China | N/A | Used for multistage stratified cluster random sampling and questionnaire administration between September and December 2025. |
| Mplus | Muthen & Muthen | Version 8.3 | Used to perform latent profile analysis based on the seven PSQI component scores. |
| IBM SPSS Statistics | IBM | Version 26.0 | Used to conduct chi-square tests and multinomial logistic regression analyses. |
| Microsoft Excel | Microsoft | N/A | Used to prepare separate JoVE table files for upload. |
References
- Chaput JP, et al. Sleeping hours: What is the ideal number and how does age impact this? Nat Sci Sleep. 2018;10:421–430.
- Li J, et al. Sleep in normal aging. Sleep Med Clin. 2018;13(1):1–11.
- Becker SP, et al. Sleep in a large, multi-university sample of college students: Sleep problem prevalence, sex differences, and mental health correlates. Sleep Health. 2018;4(2):174–181.
- Lund HG, et al. Sleep patterns and predictors of disturbed sleep in a large population of college students. J Adolesc Health. 2010;46(2):124–132.
- Chen X, et al. Sleep characteristics and health-related quality of life among a national sample of American young adults. Sleep. 2014;37(4):793–799.
- Steptoe A, et al. Sleep duration and health in young adults. Arch Intern Med. 2006;166(16):1689–1692.
- Zhai L, et al. Sleep duration and depression among adults: A meta-analysis of prospective studies. Depress Anxiety. 2015;32(9):664–670.
- Grandner MA, et al. Sleep: Important considerations for the prevention of cardiovascular disease. Curr Opin Cardiol. 2016;31(5):551–565.
- Buysse DJ, et al. The Pittsburgh Sleep Quality Index: A new instrument for psychiatric practice and research. Psychiatry Res. 1989;28(2):193–213.
- Hirshkowitz M, et al. National Sleep Foundation’s sleep time duration recommendations: Methodology and results summary. Sleep Health. 2015;1(1):40–43.
- Nylund-Gibson K, et al. Ten frequently asked questions about latent class analysis. Transl Issues Psychol Sci. 2018;4(4):440–461.
- Nylund KL, et al. Deciding on the number of classes in latent class analysis and growth mixture modeling: A Monte Carlo simulation study. Struct Equ Modeling. 2007;14(4):535–569.
- Lanza ST, et al. Latent class analysis: An alternative perspective on subgroup analysis in prevention and treatment. Prev Sci. 2013;14(2):157–168.
- Bull FC, et al. World Health Organization 2020 guidelines on physical activity and sedentary behaviour. Br J Sports Med. 2020;54(24):1451–1462.
- U.S. Department of Health and Human Services. Physical Activity Guidelines for Americans. 2nd ed. U.S. Department of Health and Human Services; Washington, DC; 2018.
- Stamatakis E, et al. Sitting time, physical activity, and risk of mortality in adults. J Am Coll Cardiol. 2019;73(16):2062–2072.
- Nystoriak MA, et al. Cardiovascular effects and benefits of exercise. Front Cardiovasc Med. 2018;5:135.
- Biddle SJH, et al. A systematic review of physical activity and health in emerging adults. J Sci Med Sport. 2015;18(6):633–638.
- Lubans D, et al. Physical activity for cognitive and mental health in youth: A systematic review of mechanisms. Pediatrics. 2016;138(3):e20161642.
- Kredlow MA, et al. The effects of physical activity on sleep: A meta-analytic review. J Behav Med. 2015;38(3):427–449.
- Wang F, et al. The effect of physical activity on sleep quality: A systematic review. Eur J Physiother. 2021;23(1):11–18.
- Buman MP, et al. Objectively measured physical activity and sleep in older men. J Sleep Res. 2014;23(2):164–171.
- Loprinzi PD, et al. Association between objectively-measured physical activity and sleep, NHANES 2005–2006. Ment Health Phys Act. 2011;4(2):65–69.
- Vandelanotte C, et al. Associations between objective sleep characteristics and physical activity and sedentary behaviours. J Sci Med Sport. 2019;22(5):565–570.
- Pedisic Z, et al. State of health in Australian adults: Does physical activity mitigate the negative impact of poor sleep? J Sci Med Sport. 2014;17(1):60–65.
- Memon AR, et al. Sleep and physical activity in university students: A systematic review and meta-analysis. Sleep Med Rev. 2021;58:101482.
- Kline CE. The bidirectional relationship between exercise and sleep: Implications for exercise adherence and sleep improvement. Am J Lifestyle Med. 2014;8(6):375–379.
- Dolezal BA, et al. Interrelationship between sleep and exercise: A systematic review. Adv Prev Med. 2017;2017:1364387.
- Gerber M, et al. Fitness and exercise as correlates of sleep complaints: Is it all in our minds? Med Sci Sports Exerc. 2010;42(5):893–901.
- Wu X, et al. Low physical activity and high screen time can increase the risks of mental health problems and poor sleep quality among Chinese college students. PLoS One. 2015;10(3):e0119607.
- Carter B, et al. Association between portable screen-based media device access or use and sleep outcomes: A systematic review and meta-analysis. JAMA Pediatr. 2016;170(12):1202–1208.
- Craig CL, et al. International Physical Activity Questionnaire: 12-country reliability and validity. Med Sci Sports Exerc. 2003;35(8):1381–1395.
- Dinger MK, et al. Validity and reliability of the International Physical Activity Questionnaire in college students. Am J Health Educ. 2006;37(6):337–343.
- Muthén LK, Muthén BO. Mplus User’s Guide. 8th ed. Muthén & Muthén; Los Angeles, CA; 1998–2017.
- Spurk D, et al. Latent profile analysis: A review and “how to” guide of its application within vocational behavior research. J Vocat Behav. 2020;120:103445.
- Rebar AL, et al. A meta-meta-analysis of the effect of physical activity on depression and anxiety in non-clinical adult populations. Health Psychol Rev. 2015;9(3):366–378.
- Yang PY, et al. Exercise training improves sleep quality in middle-aged and older adults with sleep problems: A systematic review. J Physiother. 2012;58(3):157–163.
- Irish LA, et al. The role of sleep hygiene in promoting public health: A review of empirical evidence. Sleep Med Rev. 2015;22:23–36.
- Driver HS, et al. Exercise and sleep. Sleep Med Rev. 2000;4(4):387–402.
- Morin CM, et al. Chronic insomnia. Lancet. 2012;379(9821):1129–1141.