Using bulk, single-cell, and spatial transcriptomic analyses, together with machine-learning-based survival modeling and experimental validation, this study nominates PPARG as a candidate senescence-related prognostic gene in osteosarcoma and associates its reduced expression with adverse survival in TARGET-OS and vascular and microenvironmental features.
Research Article
Integrative Bulk, Single-Cell, and Spatial Transcriptomic Analyses Nominate PPARG as a Candidate Senescence-Related Prognostic Gene in Osteosarcoma
* These authors contributed equally
In This Article
Summary
Abstract
Osteosarcoma remains challenging in metastatic, recurrent, or therapy-resistant disease. This study aimed to identify senescence-related prognostic genes and characterize their spatial contexts. Paired differential expression analysis was performed in GSE99671 using DESeq2, followed by intersection with the CellAge senescence gene set. Transcriptomic data from the TARGET-OS cohort were obtained from UCSC Xena. Candidate genes were evaluated using univariate Cox regression, Kaplan-Meier analysis, time-dependent receiver operating characteristic analysis, LASSO Cox regression, repeated LASSO analysis, and random survival forest modeling, with clinical covariates incorporated into adjusted Cox models. Functional enrichment, immune microenvironment analysis, single-cell transcriptomics, SP_BS3 spatial transcriptomics, GSE36001 expression validation, and qRT-PCR and Western blot validation in osteosarcoma 143B cells and osteoblast cells were used to characterize it. In GSE99671, 2,248 genes were differentially expressed with adjusted P < 0.05, and their intersection with the 866 CellAge genes yielded 105 senescence-related differentially expressed genes. In TARGET-OS, lower PPARG expression was associated with a higher mortality risk (univariate HR = 0.603, 95% CI = 0.454–0.802, P = 0.000494; adjusted HR = 0.224, 95% CI = 0.085–0.589, P = 0.00241). Adding PPARG to the clinical model increased the C-index from 0.707 to 0.829. PPARG was downregulated in both GSE99671 and GSE36001, and qRT-PCR and Western blotting confirmed lower PPARG mRNA and protein expression in osteosarcoma 143B cells than in osteoblast cells. Single-cell analysis localized PPARG to endothelial cells, pericytes, macrophages/monocytes, and tumor-associated stromal cells. Spatial transcriptomic analysis showed weak but significant positive correlations between PPARG expression and the CellAge senescence, endothelial-related, and pericyte-related scores. These findings nominate PPARG as a candidate CellAge-derived prognostic biomarker associated with unfavorable survival and vascular microenvironmental features in osteosarcoma and support investigation of its potential relevance to risk stratification and the senescence-related tumor microenvironment. GSE36001 provided external expression validation only; independent survival validation was not performed.
Introduction
Osteosarcoma is the most common primary malignant bone tumor in children, adolescents, and young adults1. Although multi-agent chemotherapy combined with surgery has improved outcomes for localized disease2,3, patients with metastatic, recurrent, or therapy-resistant osteosarcoma continue to have poor long-term survival3,4. Emerging evidence indicates that oxidative stress-induced epigenetic remodeling can facilitate metastatic adaptation and tumor progression, highlighting the complex molecular plasticity underlying aggressive cancer phenotypes5. Robust biomarkers that are both clinically interpretable and biologically informative remain limited. Therefore, identifying molecular features that capture osteosarcoma heterogeneity and prognostic risk across multiple layers of data remains important.
Cellular senescence is a stable cell-cycle arrest program induced by telomere dysfunction, DNA damage, oxidative stress, oncogene activation, and therapeutic pressure6. Senescence can restrict aberrant proliferation; however, senescent cells can also reshape the tumor microenvironment through inflammatory, chemokine, growth factor, and extracellular matrix remodeling programs7,8. In osteosarcoma, senescence-related genes may reflect both tumor-cell-intrinsic stress states and non-malignant microenvironmental compartments, yet their prognostic relevance and spatial organization have not been systematically evaluated.
PPARG encodes peroxisome proliferator-activated receptor gamma, a ligand-activated nuclear receptor involved in lipid metabolism, inflammatory regulation, cellular differentiation, and immune modulation9. The role of PPARG in cancer is context-dependent10. In some settings, PPARG is associated with differentiation and anti-inflammatory states, whereas in others, it may support adaptive tumor or stromal programs. However, its expression pattern, prognostic value, and cellular and spatial localization in osteosarcoma remain incompletely characterized.
In the present study, differentially expressed genes in GSE99671 were identified and intersected with the CellAge senescence gene set, yielding 105 senescence-related differentially expressed genes. TARGET-OS survival data, multiple machine-learning and survival-modeling approaches, and clinical adjustment were then used to nominate PPARG as the core gene. PPARG was further characterized using bulk functional and immune microenvironment analyses, single-cell transcriptomics, spatial transcriptomics, external expression validation from GSE36001, and qRT-PCR and Western blot validation in the osteosarcoma cell line 143B and human osteoblasts.
Protocol
This study used public datasets and cell lines for analysis and validation and did not involve human participants or clinical tissue samples; therefore, ethics approval was not required.
Differential expression analysis in GSE99671 and CellAge intersection
Raw count data and sample grouping information for GSE99671 were obtained from GEO11,12. Eighteen pairs of osteosarcoma and matched normal samples were analyzed. Paired differential expression analysis was performed using DESeq2 with the design formula ~ pair_id + condition, where pair_id accounted for paired-individual effects and condition compared tumor tissue with normal tissue13. Genes with read counts of at least 10 in at least three samples were retained. Differential expression was defined as an adjusted P < 0.05, and a stricter threshold of adjusted P < 0.05 and |log2FC| ≥ 1 was applied for visualization. Differentially expressed genes were intersected with the 866 CellAge senescence genes after gene symbols were converted to uppercase14. Differential expression analysis was performed in R (version 4.3.2) using DESeq2 (version 1.40.2), and adjusted P values were calculated using the Benjamini-Hochberg method.
TARGET-OS cohort and prognostic modeling
TARGET-OS transcriptomic and clinical data were obtained from UCSC Xena15. Expression values for the 105 senescence-related differentially expressed genes were extracted. Eighty-five patients with complete survival time, survival status, and candidate gene expression data were included, with 27 death events. Standardized gene expression values were analyzed using univariate Cox regression16, Kaplan-Meier survival analysis, and time-dependent receiver operating characteristic (ROC) analysis17. LASSO Cox regression18, repeated LASSO stability analysis, and random survival forest modeling were used to assess selection stability and variable importance19. The integrated hub score and clinical-integrated ranking were calculated using the explicit binary criteria detailed below. Survival analyses were performed in R using the survival (version 3.5-7), timeROC (version 0.4), glmnet (version 4.1-8), and randomForestSRC (version 3.2.2) packages. For the univariate Cox screening of the 105 candidate genes, Benjamini-Hochberg false discovery rate (FDR) correction was applied, and genes with FDR < 0.05 were considered statistically significant.
Model preprocessing, PPARG grouping, and time-dependent ROC analysis
Among 85 patients with 27 deaths, genes with zero variance were excluded, missing candidate-gene expression values were median-imputed, and each candidate gene was z-score standardized. For Kaplan-Meier analysis, expression was dichotomized at the cohort median: values strictly above the median were assigned to the high-expression group and values at or below the median to the low-expression group (PPARG: n = 42 high and n = 43 low). Log-rank tests were two-sided. Time-dependent ROC analyses used timeROC with event cause = 1, marginal inverse-probability-of-censoring weighting, evaluation times of 365, 1,095, and 1,825 days, and iid = FALSE. To ensure larger marker values consistently indicate higher risk, standardized expression values were used for genes with positive Cox coefficients and multiplied by -1 for protective genes with negative coefficients.
LASSO and repeated LASSO
Cox LASSO was fitted with glmnet using family = "cox", alpha = 1, prior z-score standardization (therefore standardize = FALSE), five-fold cross-validation, type.measure = "deviance" and random seed 123. The primary coefficient solution used lambda.min. Stability analysis repeated the same five-fold cross-validation 300 times; repeat b used seed 1000 + b (b = 1,...,300). For each gene, selection frequency was the proportion of repeats with a nonzero coefficient at lambda.min; nonzero selection at lambda.1se was also recorded.
Random survival forest
A survival forest was fitted to all 105 standardized candidate genes with randomForestSRC (version 3.2.2), using seed 123, ntree = 1,000, importance = TRUE, and na.action = "na.impute". Package defaults were retained for survival data: log-rank splitting, mtry = 11 (the ceiling of the square root of 105 predictors), minimum terminal node size = 15, nsplit = 10 random split points, sampling without replacement with a 0.632 sampling fraction, and anti-split variable importance.
Integrated hub score
Each of the 105 CellAge-related differentially expressed candidate genes received one point for each of six binary criteria: (1) differential-expression/CellAge intersection membership (all candidates received this point because adjusted P < 0.05 was required before scoring); (2) nominal univariate Cox P < 0.05; (3) Kaplan-Meier log-rank P < 0.05; (4) mean 3- and 5-year time-dependent AUC ≥ 0.65; (5) lambda.min repeated-LASSO selection frequency at or above the 70th percentile across candidates and > 0; and (6) random-survival-forest importance at or above the 70th percentile across candidates and > 0. All criteria had equal unit weight, giving a hub score from 0 to 6; genes scoring ≥ 4 advanced to clinical adjustment (18 genes). Univariate Cox FDR values were also reported, and FDR < 0.05 was used to denote multiple-testing significance, but the prespecified scoring indicator used nominal P < 0.05.
Clinical-integrated ranking
After merging expression and clinical records, the adjusted analyses included 40 patients with complete covariate records and 13 deaths. The final score was the initial hub score plus one point for each of seven criteria: adjusted Cox P < 0.05, adjusted Cox P < 0.10, sensitivity Cox P < 0.05 after removing definitive surgery, sensitivity Cox P < 0.10, mean 3- and 5-year AUC ≥ 0.65, likelihood-ratio-test P < 0.10 for the clinical-plus-gene versus clinical-only model, and delta AIC < 0. Because the 0.05 and 0.10 thresholds were nested, a P < 0.05 contributed two points, thereby giving greater weight to clearly significant adjusted and sensitivity Cox evidence. The total range was 0 to 13; ties were resolved by the smaller adjusted Cox P value, followed by the larger mean 3-/5-year AUC. PPARG received all six initial points and all seven clinical integration points (13/13), ranking first. The C-index improvement was reported descriptively and was not assigned a score.
Clinical adjustment
Candidate hub genes were integrated with TARGET-OS clinical variables, including sex, age, disease status at diagnosis, primary tumor site, specific tumor region and definitive surgery. Forty patients with complete expression and clinical records, including 13 deaths, entered the clinical-adjusted analyses. Cox models containing only clinical variables were compared with models including clinical variables plus gene expression. C-index, Akaike information criterion (AIC), and likelihood ratio test P values were used to evaluate model improvement. Sensitivity analysis was performed after removing the surgery variable.
Functional enrichment and immune microenvironment analysis
TARGET-OS samples were stratified according to PPARG expression. Differential expression between the PPARG-high and PPARG-low groups was used to generate ranked gene lists for gene set enrichment analysis (GSEA)20. The pathways displayed were Nemeth Inflammatory Response LPS Up, Burton Adipogenesis 5, Burton Adipogenesis 6, Krieg KDM3A Targets Not Hypoxia, Reactome: Transcriptional Regulation By TP53, Fulcher Inflammatory Response Lectin Vs LPS Dn, Hollmann Apoptosis Via CD40 Dn, Zhou Inflammatory Response Live Dn, WP: Fatty Acids And Lipoproteins Transport In Hepatocytes, Sweet Lung Cancer KRAS Up, KEGG Medicus Pathogen HIV Tat To TLR2/4 NF-kB Signaling Pathway and Reactome: Fatty Acids. A bulk CellAge senescence score was calculated, and Spearman correlation analysis was used to assess associations between PPARG and senescence genes or immune microenvironment signatures21. Differences in microenvironment scores between PPARG-high and PPARG-low groups were evaluated using non-parametric tests with multiple-testing correction.
Single-cell transcriptomic analysis
A published human osteosarcoma single-cell transcriptomic dataset was analyzed using a preprocessed object for which quality control, dimensionality reduction, clustering, and manual annotation had already been completed22,23,24. A total of 68,336 cells and 32,297 genes were included. For main-text interpretation, annotations were simplified into 13 major cell types: B cells, CAFs, cycling cells, endothelial cells, erythroid cells, macrophages/monocytes, malignant osteosarcoma cells, myogenic cells, neutrophils, osteoclast-like cells, pericytes, T/NK cells, and tumor-associated stromal cells. Dimensionality reduction, feature expression, dot, and violin plots were used to visualize PPARG localization. PPARG-positive cells were defined as cells with expression greater than zero. Differences among cell types were assessed using Kruskal-Wallis and Wilcoxon rank-sum tests with Benjamini-Hochberg correction. Single-cell analyses were performed in R using Seurat (version 5.0.1).
Spatial transcriptomic analysis
The SP_BS3 spatial transcriptomic sample was used to construct a spatial expression object25,26. Quality control thresholds were nFeature_Spatial ≥ 200 and percent.mt ≤ 30, leaving 4,572 spots for analysis. Data were normalized, 3,000 highly variable genes were selected, and data scaling, principal component analysis, neighborhood graph construction, spatial spot clustering, and dimensionality reduction were performed. A spatial CellAge senescence score was calculated after removing PPARG from the gene set to avoid circular correlation. Endothelial, pericyte, macrophage/monocyte, tumor-associated stromal, malignant osteosarcoma, and osteoclast-like signatures were constructed and scored. Spearman correlation analysis was used to assess associations between PPARG expression and spatial scores. Label transfer was performed using the single-cell dataset as the reference and the spatial dataset as the query to infer predicted cell-type scores for each spot23,24. Spatial transcriptomic analyses were performed in R using Seurat (version 5.0.1), and Benjamini-Hochberg FDR correction was applied to all spatial correlation P values.
External expression validation in GSE36001
The GEO dataset GSE36001 was used exclusively as an independent expression validation cohort; because survival outcomes were unavailable, it was not used for prognostic validation11,27. The dataset included 19 osteosarcoma samples and six normal control samples. GPL6102 platform annotation was used to convert probe identifiers to gene symbols. When multiple probes mapped to the same gene, the probe with the highest average expression was retained. Differential expression between tumor and normal groups was assessed using limma28. Analyses were performed in R using limma (version 3.56.2), and adjusted P values were calculated using the Benjamini-Hochberg method.
qRT-PCR and Western blot validation
Experimental validation was performed using the human osteosarcoma cell line 143B and human osteoblast cells. Osteosarcoma cells were cultured in Dulbecco's modified Eagle's medium supplemented with 10% fetal bovine serum and 1% penicillin-streptomycin at 37 °C in a humidified atmosphere containing 5% CO₂, and passaged with 0.25% trypsin-EDTA at 80%–90% confluence. Human osteoblast cells were maintained under the recommended culture conditions. All cell lines were confirmed to be free of mycoplasma contamination. For qRT-PCR, total RNA was extracted using a phenol-guanidinium-based RNA extraction reagent, and RNA concentration and purity were assessed spectrophotometrically. One microgram of total RNA was reverse-transcribed using a reverse-transcription reagent according to the recommended protocol. qRT-PCR was performed using fluorescent DNA-binding dye-based chemistry under the following cycling conditions: initial denaturation at 95 °C for 30 s, followed by 40 cycles at 95 °C for 5 s and 60 °C for 30 s, with melt-curve analysis to confirm amplification specificity. Each reaction was performed in technical triplicate, and three independent biological experiments were conducted. GAPDH was used as the internal control, and relative PPARG expression was calculated using the 2-ΔΔCt method29. The PPARG forward primer was 5'-CGAAGACATTCCATTCACAAGAACAG-3', and the reverse primer was 5'-AGATGCAGGCTCCACTTTGATTG-3'.
Western blotting was performed to examine PPARG protein expression. Cells were lysed in radioimmunoprecipitation assay buffer supplemented with protease inhibitors, and protein concentrations were determined using a bicinchoninic acid assay. Equal amounts of protein (30 µg per lane) were separated by 10% sodium dodecyl sulfate-polyacrylamide gel electrophoresis and transferred onto polyvinylidene difluoride membranes. After blocking with 5% non-fat milk for 1 h at room temperature, membranes were incubated overnight at 4 °C with primary antibodies against PPARG (1:1,000) and GAPDH (1:5,000), followed by incubation with a horseradish peroxidase-conjugated secondary antibody (1:5,000) for 1 h at room temperature. Protein bands were visualized using chemiluminescence detection, and three independent experiments were performed. Band intensities were quantified using image-analysis software30. Between-group differences were analyzed using two-tailed unpaired Student's t tests. Data were presented as the mean ± standard deviation (SD) from three independent experiments, and P < 0.05 was considered statistically significant. Statistical analyses of experimental data were performed using statistical analysis software (version 9.0).
Statistical analysis
Unless otherwise specified, all bioinformatic analyses were performed in R (version 4.3.2). Two-sided P values < 0.05 were considered statistically significant. Correlations were assessed using Spearman's rank correlation coefficient (ρ). Multiple-testing correction was performed using the Benjamini-Hochberg FDR method where applicable. Experimental data were presented as the mean ± SD and were compared using two-tailed unpaired Student's t tests. Experimental statistical analyses were performed using statistical analysis software (version 9.0).
Results
GSE99671 identified 105 CellAge senescence-related differentially expressed genes
GSE99671 included 36 samples from 18 paired tissues. After low-count filtering, 16,683 genes were retained. At an adjusted P < 0.05, 2,248 genes were differentially expressed. Under the stricter threshold of adjusted P < 0.05 and |log2FC| ≥ 1, 594 genes were significant, including 102 upregulated and 492 downregulated genes in tumors (Figure 1A,B). Intersection of the 2,248 differentially expressed genes with 866 CellAge genes yielded 105 senescence-related differentially expressed genes (Figure 1C). PPARG was downregulated in GSE99671, with log2FC = -0.644, P = 0.00451, and adjusted P value = 0.0309. In 13 of 18 pairs, PPARG expression was higher in normal tissue than in tumor tissue, with a paired Wilcoxon P = 0.0294 (Figure 1D).
Multi-model prognostic screening nominated PPARG as the core candidate gene
In TARGET-OS, 85 patients with 27 death events were included. Integrated screening of the 105 senescence-related differentially expressed genes using univariate Cox regression, Kaplan-Meier analysis, survival ROC analysis, LASSO, repeated LASSO, and random survival forest modeling yielded 18 candidate hub genes before clinical adjustment (Figure 2A). PPARG was associated with overall survival in univariate Cox analysis (HR = 0.603, 95% CI = 0.454–0.802, P = 0.000494, FDR = 0.0447), indicating that higher PPARG expression was associated with a lower mortality risk. Kaplan-Meier analysis comparing the high- and low-expression groups yielded P = 0.00784 (Figure 2B). Time-dependent AUCs at 1, 3, and 5 years were 0.603, 0.760, and 0.776, respectively (Figure 2C). PPARG showed a repeated LASSO selection frequency of 0.920 and a random survival forest importance of 0.0398 (Figure 2D–F). PPARG's initial hub score was 6/6 because it satisfied all six prespecified screening criteria.
Clinical adjustment supported the prognostic association of PPARG
After clinical covariates were incorporated, PPARG remained significantly associated with overall survival (adjusted HR = 0.224, 95% CI = 0.085–0.589, P = 0.00241; Figure 2G). The clinical-only model had a C-index of 0.707 and an AIC of 89.921 (Supplementary Table 1). Addition of PPARG increased the C-index to 0.829, reduced the AIC to 78.466, and significantly improved model fit according to the likelihood ratio test (P = 0.000244; Supplementary Table 2, Figure 2H,I). Sensitivity analysis after removal of definitive surgery preserved the protective association of PPARG (HR = 0.249, P = 0.00185; Supplementary Table 3, Figure 2J). PPARG achieved the highest clinical-integrated score of 13 (initial hub score 6 plus seven clinical-integration points) and showed final 3- and 5-year AUCs of 0.770 and 0.813 (Figure 2K).
PPARG-associated functional and immune microenvironmental features
GSEA comparing PPARG-high and PPARG-low groups displayed Nemeth Inflammatory Response LPS Up, Burton Adipogenesis 5, Burton Adipogenesis 6, Krieg KDM3A Targets Not Hypoxia, Reactome: Transcriptional Regulation By TP53, Fulcher Inflammatory Response Lectin Vs LPS Dn, Hollmann Apoptosis Via CD40 Dn, Zhou Inflammatory Response Live Dn, WP: Fatty Acids And Lipoproteins Transport In Hepatocytes, Sweet Lung Cancer KRAS Up, KEGG Medicus Pathogen HIV Tat To TLR2/4 NF-kB Signaling Pathway, and Reactome: Fatty Acids (Figure 3A). In bulk TARGET-OS data, PPARG was not significantly correlated with the overall CellAge senescence score (Spearman ρ = 0.022, P = 0.837; Figure 3B), but it was correlated with several individual CellAge genes (Figure 3C). Immune microenvironment analysis showed positive correlations between PPARG and macrophages (ρ = 0.485, FDR = 2.7 × 10⁻⁵), CD8 T cells (ρ = 0.410, FDR = 5.88 × 10⁻⁴), the osteoclast-like signature (ρ = 0.383, FDR = 0.00120), neutrophils (ρ = 0.376, FDR = 0.00120), and dendritic cells (ρ = 0.370, FDR = 0.00123). PPARG-high tumors showed higher osteoclast-like, macrophage, CD8 T-cell, dendritic cell, monocyte, neutrophil, NK cell, and endothelial cell signatures after FDR correction (Supplementary Table 4, Figure 3D,E).
Single-cell transcriptomics localized PPARG to vascular and microenvironmental compartments
The single-cell dataset contained 68,336 cells and 32,297 genes. PPARG expression differed significantly among cell types (Figure 4A). The highest average expression was observed in endothelial cells (mean expression = 0.540; positive ratio = 44.33%), pericytes (mean expression = 0.439; positive ratio = 41.61%), macrophages/monocytes (mean expression = 0.363; positive ratio = 31.62%), and tumor-associated stromal cells (mean expression = 0.361; positive ratio = 44.10%; Figure 4B–E). A subset of malignant osteosarcoma cells expressed PPARG (mean expression = 0.163; positive ratio = 16.70%), but expression in malignant osteosarcoma cells was not significantly higher than that in other cells (FDR = 0.151). These findings suggested that PPARG expression in osteosarcoma predominantly reflected vascular, myeloid, and stromal microenvironmental states rather than being restricted to malignant cells (Figure 4F).
Spatial transcriptomics linked PPARG to senescence-related spatial states and vascular niches
After quality control, 4,572 SP_BS3 spatial spots were retained and grouped into seven spatial clusters (Figure 5A). Figure 5B shows the spatial distribution of nFeature_Spatial (detected genes per spot). Separately, of 866 CellAge genes, 845 were matched in the spatial expression matrix (97.58%). PPARG showed focal spatial expression (Figure 5C). The CellAge spatial senescence score, calculated after PPARG was removed, showed a weak but statistically significant positive correlation with PPARG expression (ρ = 0.0692, P = 3.0 × 10⁻⁶, FDR = 1.9 × 10⁻⁵; Figure 5D). Spatial niche scoring showed positive correlations between PPARG and the endothelial score (ρ = 0.0433, FDR = 0.00592) and pericyte score (ρ = 0.0367, FDR = 0.0181), whereas PPARG was negatively correlated with the malignant osteosarcoma score (ρ = -0.0592, FDR = 0.000219) and tumor stromal score (ρ = -0.0531, FDR = 0.000774; Supplementary Table 5, Figure 5E). Label transfer analysis similarly showed positive correlations with the endothelial prediction score (ρ = 0.0507, FDR = 0.00120) and pericyte prediction score (ρ = 0.0394, FDR = 0.0123), together with a negative correlation with the malignant osteosarcoma cell prediction score (ρ = -0.0699, FDR = 1.1 × 10⁻⁵; Figure 5F–H).
External expression and experimental validation supported PPARG downregulation
GSE36001 included 19 osteosarcoma samples and six normal controls. PPARG was significantly downregulated in osteosarcoma (logFC = -1.429, P = 0.00730, adjusted P value = 0.0435; Figure 6A). In cell-based validation, PPARG mRNA expression was significantly lower in osteosarcoma 143B cells than in human osteoblast cells by qRT-PCR (P < 0.001; Figure 6B). PPARG protein expression was also significantly reduced in 143B cells by Western blotting (P < 0.01; Figure 6C,D). These external cohort, mRNA, and protein-level findings consistently supported reduced PPARG expression in osteosarcoma. GSE36001 did not include survival outcomes and therefore provided only external expression validation, not independent prognostic validation.
DATA AVAILABILITY:
All datasets used in this study are publicly available. GSE99671 and GSE36001 were obtained from the Gene Expression Omnibus database (https://www.ncbi.nlm.nih.gov/geo/query/acc.cgi/acc=GSE99671; https://www.ncbi.nlm.nih.gov/geo/query/acc.cgi/acc=GSE36001). TARGET-OS transcriptomic and clinical data were downloaded from UCSC Xena (https://xena.ucsc.edu/). Senescence-related genes were obtained from CellAge: The Database of Cell Senescence Genes, part of the Human Ageing Genomic Resources (https://genomics.senescence.info/cells/). The human osteosarcoma single-cell and spatial transcriptomic datasets were obtained from the published atlas and its associated GitHub repository (https://github.com/zhengxj1/A-Single-Cell-and-Spatially-Resolved-Atlas-of-Human-Osteosarcomas). Gene sets for enrichment analysis were obtained from MSigDB (https://www.gsea-msigdb.org/gsea/msigdb/). The processed data generated in this study and the analysis scripts used to reproduce the reported results have been compiled and submitted as Supplementary File 1.
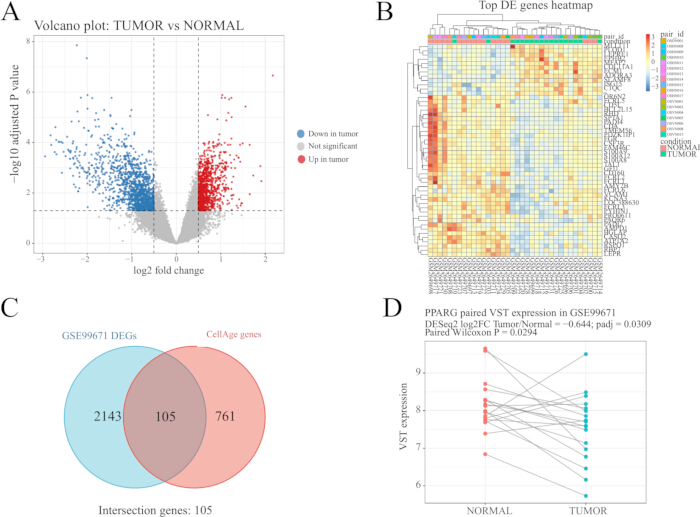
Figure 1: Identification of differentially expressed genes and CellAge-derived senescence-related candidate genes in osteosarcoma. (A) Volcano plot showing differentially expressed genes between osteosarcoma tissues and paired nontumoral control tissues in the GSE99671 dataset. Significantly upregulated and downregulated genes are highlighted according to the predefined cutoff criteria. (B) Heatmap showing the expression patterns of representative differentially expressed genes across osteosarcoma and paired control samples in GSE99671. (C) Venn diagram showing the intersection between GSE99671 differentially expressed genes and CellAge senescence-related genes. (D) Paired expression comparison of PPARG between osteosarcoma tissues and matched nontumoral control tissues in GSE99671. Please click here to view a larger version of this figure.
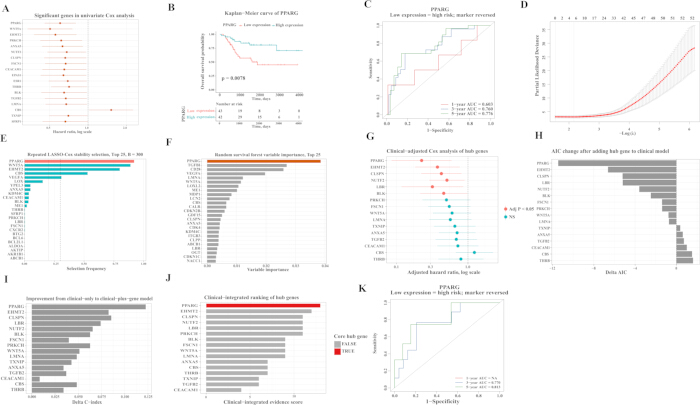
Figure 2: Machine-learning and clinically adjusted survival analyses identify PPARG as a core senescence-related prognostic hub gene in osteosarcoma. (A) Forest plot showing univariate Cox regression results for candidate senescence-related genes in the TARGET-OS cohort. (B) Kaplan–Meier survival curve comparing overall survival between PPARG-high and PPARG-low patients. (C) Time-dependent ROC curves evaluating the predictive performance of PPARG for overall survival. (D) Cross-validation curve of LASSO Cox regression for selection of prognostic candidate genes. (E) Repeated LASSO stability analysis showing lambda.min selection frequencies across 300 five-fold repetitions. (F) Random survival forest analysis showing variable importance scores from 1,000 trees. (G) Forest plot showing results from clinically adjusted Cox regression for candidate hub genes. (H) AIC changes after the addition of individual hub genes to the clinical model. (I) C-index improvement after the addition of individual hub genes to the clinical model. (J) Final clinical-integrated score (range 0–13) ranking of the candidate Hub gene. (K) Time-dependent ROC curves of PPARG in the 40-patient clinical-analysis subset, showing 3- and 5-year AUCs; the 1-year AUC was not estimable. Please click here to view a larger version of this figure.
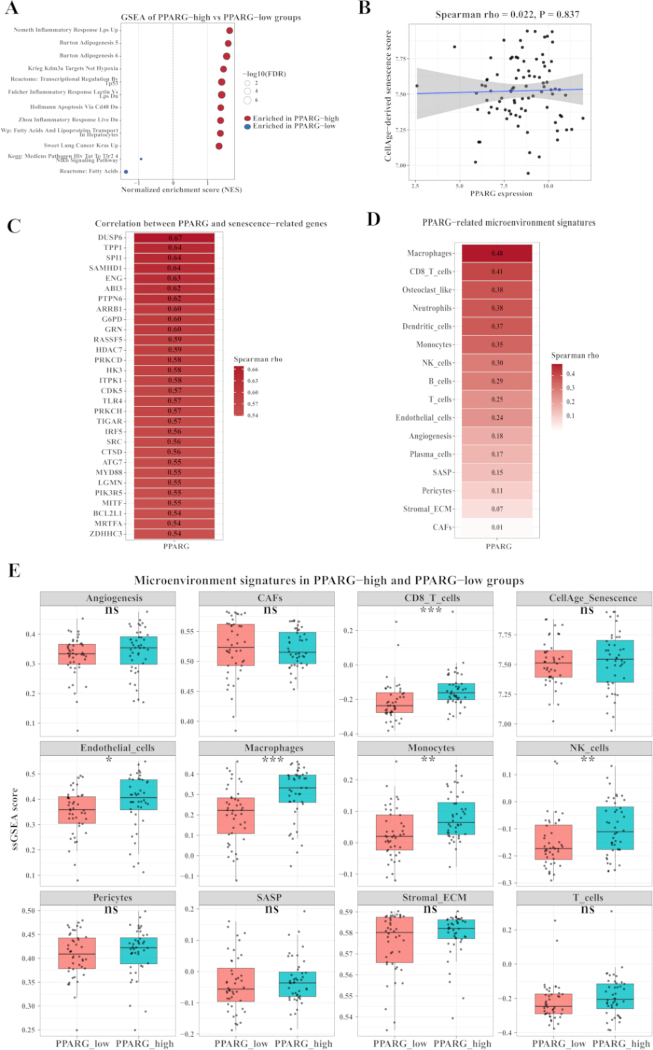
Figure 3: PPARG-associated functional enrichment and immune microenvironment analysis. (A) GSEA bubble plot comparing PPARG-high and PPARG-low groups and displaying Nemeth Inflammatory Response LPS Up, Burton Adipogenesis 5, Burton Adipogenesis 6, Krieg KDM3A Targets Not Hypoxia, Reactome: Transcriptional Regulation By TP53, Fulcher Inflammatory Response Lectin Vs LPS Dn, Hollmann Apoptosis Via CD40 Dn, Zhou Inflammatory Response Live Dn, WP: Fatty Acids And Lipoproteins Transport In Hepatocytes, Sweet Lung Cancer KRAS Up, KEGG Medicus Pathogen HIV Tat To TLR2/4 NF-kB Signaling Pathway, and Reactome: Fatty Acids. (B) Correlation between PPARG and the overall CellAge senescence score in bulk TARGET-OS data. (C) Correlations between PPARG and individual CellAge genes. (D) Correlations between PPARG and immune microenvironment signatures. (E) Differences in microenvironment scores between PPARG-high and PPARG-low groups. Correlations were assessed using Spearman’s rank correlation coefficient (ρ), and adjusted P values were calculated using the Benjamini-Hochberg method. Abbreviations: GSEA = gene set enrichment analysis; NF-κB = nuclear factor kappa-B; JAK-STAT = Janus kinase-signal transducer and activator of transcription; IL-12 = interleukin-12; FDR = false discovery rate. Please click here to view a larger version of this figure.
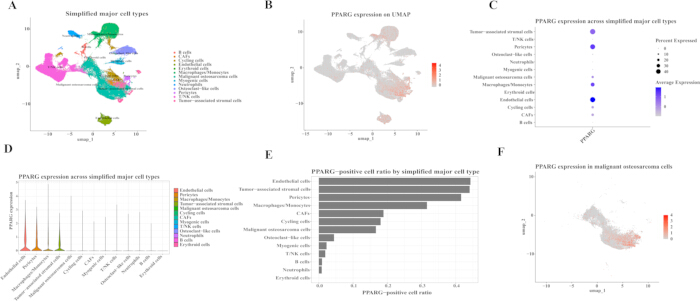
Figure 4: PPARG localization across cellular compartments in osteosarcoma single-cell transcriptomic data. (A) UMAP visualization of major cell types in the human osteosarcoma single-cell transcriptomic dataset after simplified manual annotation. (B) FeaturePlot showing the global distribution of PPARG expression across single cells. (C) DotPlot showing PPARG expression across major cell types. (D) Violin plot showing PPARG expression levels in different cell types. (E) Bar plot showing the proportion of PPARG-positive cells in each major cell type. (F) UMAP visualization showing PPARG expression in malignant osteosarcoma cells. Abbreviation: UMAP = uniform manifold approximation and projection. Please click here to view a larger version of this figure.
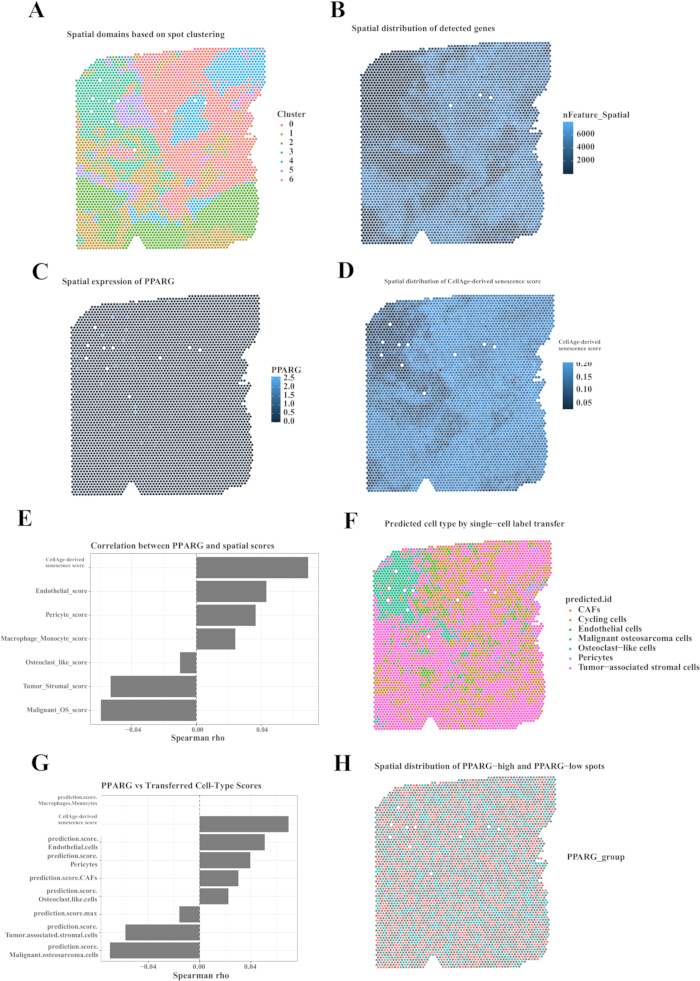
Figure 5: Spatial transcriptomic localization of PPARG and senescence-related spatial features in osteosarcoma. (A) Spatial distribution of transcriptome-defined clusters in the SP_BS3 osteosarcoma spatial transcriptomic section. (B) Spatial distribution of detected genes per spot, shown by nFeature_Spatial. (C) Spatial expression pattern of PPARG across SP_BS3 spots. (D) Spatial distribution of the CellAge-derived senescence score. (E) Correlation analysis between PPARG expression and the spatial CellAge-derived senescence score or cell ecological niche scores. (F) Label-transfer prediction map showing the dominant single-cell-derived cell type for each spatial spot. (G) Correlation analysis between PPARG expression, the CellAge-derived senescence score, and label transfer-derived cell type prediction scores. (H) Spatial distribution of PPARG-high and PPARG-low spots. Please click here to view a larger version of this figure.
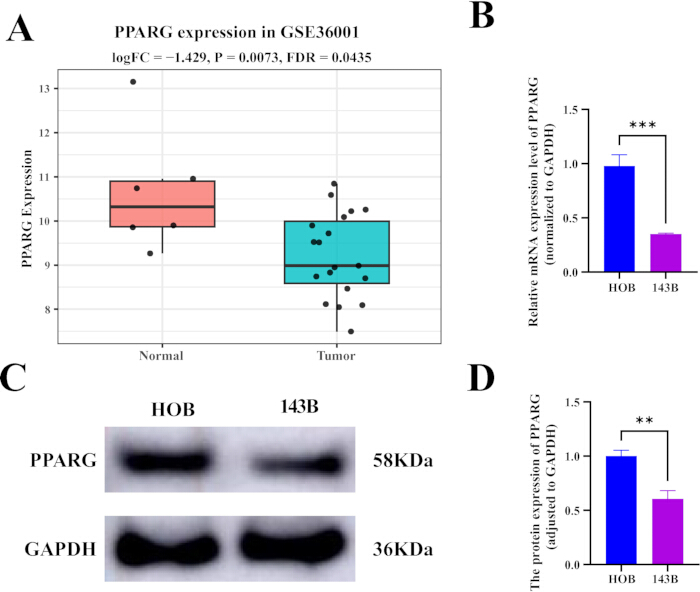
Figure 6: External expression and experimental validation of PPARG downregulation in osteosarcoma. (A) Boxplot showing PPARG expression levels in osteosarcoma samples (n = 19) and normal control samples (n = 6) in the GSE36001 dataset. (B) qRT-PCR analysis of PPARG mRNA expression in human osteosarcoma 143B cells and human osteoblast control cells. (C) Representative Western blot showing PPARG and GAPDH protein expression in human osteoblast control cells and osteosarcoma 143B cells. GAPDH was used as the loading control. (D) Densitometric quantification of Western blot bands showing relative PPARG protein levels normalized to GAPDH. In (B) and (D), data are presented as the mean ± SD from three independent experiments. P < 0.01 and P < 0.001 versus the human osteoblast control group, as determined using a two-tailed unpaired Student’s t-test. Abbreviations: qRT-PCR = quantitative reverse-transcription polymerase chain reaction; GAPDH = glyceraldehyde-3-phosphate dehydrogenase; SD = standard deviation. Please click here to view a larger version of this figure.
Supplementary Table 1: Performance of the clinical-only Cox model in the TARGET-OS cohort. C-index, AIC, and model summary of the Cox model constructed using clinical variables alone, including sex, age, disease status at diagnosis, primary tumor site, specific tumor region, and definitive surgery status. Abbreviation: AIC = Akaike information criterion. Please click here to download this file.
Supplementary Table 2: Comparison between clinical-only and clinical-plus-gene Cox models. Model-comparison results after addition of individual candidate hub genes to the clinical model, including C-index, AIC, likelihood ratio test statistics, and model-improvement metrics. Abbreviation: AIC = Akaike information criterion. Please click here to download this file.
Supplementary Table 3: Sensitivity analysis after removal of the definitive surgery variable. Sensitivity Cox regression results evaluating whether the prognostic associations of candidate hub genes, particularly PPARG, remained stable after the definitive surgery variable was excluded from the adjusted clinical model. Please click here to download this file.
Supplementary Table 4: PPARG-associated immune and stromal microenvironment signatures in TARGET-OS. Correlation and group-comparison results between PPARG expression and immune, stromal, vascular, inflammatory, and SASP-related ssGSEA signatures, including Spearman correlation coefficients, P values, adjusted P values, and PPARG-high versus PPARG-low comparisons. Abbreviations: SASP = senescence-associated secretory phenotype; ssGSEA = single-sample gene set enrichment analysis. Please click here to download this file.
Supplementary Table 5: Spatial transcriptomic correlation analysis of PPARG in SP_BS3. Correlation results between PPARG expression and the spatial CellAge-derived senescence score, cell ecological niche scores, and label-transfer-derived cell-type prediction scores in the SP_BS3 osteosarcoma spatial transcriptomic section. Please click here to download this file.
Discussion
This study nominated PPARG as a candidate senescence-related prognostic gene in osteosarcoma by integrating differential expression analysis, CellAge gene intersection, TARGET-OS survival modeling, clinical adjustment, multi-omic localization, and experimental validation. This analytical framework was consistent with the current emphasis on molecularly informed osteosarcoma research and curated senescence-gene resources for interpreting senescence-related biology14,31. PPARG was downregulated in osteosarcoma relative to normal tissue, and lower PPARG expression was associated with worse overall survival in TARGET-OS. These findings suggested that PPARG was not only transcriptionally altered in osteosarcoma but might also carry clinically relevant prognostic information. However, because candidate selection and model evaluation were performed in the same TARGET-OS cohort (85 patients, 27 death events), the observed improvement in model performance was susceptible to optimism and overfitting; therefore, the prognostic value of PPARG should be regarded as hypothesis-generating until validated in an independent osteosarcoma survival cohort. Nevertheless, PPARG biology should be interpreted in a context-dependent manner because experimental osteosarcoma studies have reported both antitumor effects of PPAR-gamma/nuclear-receptor modulation and PPARG-associated osteoclast programs that may support disease progression32,33,34.
An important nuance was that PPARG should not be interpreted as a simple surrogate for the overall CellAge score. In bulk TARGET-OS data, PPARG was not significantly correlated with the global CellAge senescence score, whereas in spatial transcriptomics, PPARG showed a weak but significant correlation with a CellAge score calculated after excluding PPARG. This difference may have reflected cell-composition effects in bulk data, the multifunctional nature of senescence gene sets, and local enrichment of microenvironmental niches in spatial spots. Consensus and transcriptomic studies have emphasized that cellular senescence is heterogeneous, dynamic, and dependent on cell type, stressor, and tissue context, while SASP programs can exert opposing effects during cancer progression25,35,36,37. PPARG was therefore conservatively defined as a CellAge-derived senescence-related prognostic gene rather than as a proven driver of senescence. Accordingly, the senescence-related designation of PPARG reflected CellAge gene-set membership rather than demonstrated mechanistic involvement in senescence, and PPARG should not be used as a quantitative surrogate for overall senescence activity.
More generally, these spatial results illustrated the distinction between statistical significance and biological relevance. With 4,572 spatial spots, even very weak correlations could exceed conventional significance thresholds; for example, the correlation between PPARG and the spatial CellAge senescence score (ρ = 0.0692) explained only approximately 0.48% of the variance, yet reached a P value of 3.0 × 10⁻⁶ because the large number of spots provided substantial statistical power. Such spot-level associations should therefore be regarded as statistically detectable but biologically modest, hypothesis-generating signals, and their effect sizes, rather than their P values alone, should guide biological interpretation. Statistical significance in large spot-level datasets should not be equated with strong biological effects.
Single-cell and spatial analyses provided a biological context for PPARG. PPARG was enriched in endothelial cells, pericytes, macrophages/monocytes, and tumor-associated stromal cells, and was spatially associated with endothelial and pericyte scores. These results suggested that the prognostic information carried by PPARG may be linked to vascular and microenvironmental compartments in osteosarcoma. This interpretation was compatible with recent osteosarcoma single-cell/spatial atlases and with broader evidence that immune, vascular, and stromal niches shape tumor heterogeneity, treatment response, and progression25,38,39. Because malignant osteosarcoma cells expressed PPARG only in a subset of cells and did not show significantly higher expression than other cells, a tumor-cell-only interpretation would have been incomplete. Conversely, the bulk-level downregulation of PPARG observed in GSE99671 and GSE36001 may have partly reflected differences in stromal, vascular, bone marrow, adipogenic, or immune cell composition between tumor and normal tissues rather than genuine downregulation in malignant osteosarcoma cells. Because tumor purity and cell-type abundance were not explicitly adjusted in the bulk analyses, this possibility could not be excluded and warranted targeted investigation.
Functional and immune microenvironment analyses were consistent with this interpretation. PPARG correlated with macrophage, CD8 T-cell, dendritic cell, neutrophil, NK cell, and endothelial signatures, and GSEA highlighted pathways related to inflammation, NF-κB, JAK-STAT/IL-12 signaling, TP53 regulation, and DNA damage checkpoints. Together, these results suggested that PPARG may mark a composite microenvironmental state involving senescence-associated stress, immune infiltration, and vascular and stromal compartments. This interpretation was biologically plausible because PPAR-gamma has established roles in suppressing macrophage/monocyte inflammatory activation, including effects on AP-1, STAT, and NF-κB-related transcriptional programs, and because the osteosarcoma immune microenvironment contains myeloid, lymphoid, and vascular elements with both tumor-promoting and tumor-suppressive functions38,40,41. These single-cell and spatial observations were descriptive and hypothesis-generating; they did not by themselves establish vascular niche mechanisms, senescence programs, or prognostic pathways.
Several limitations should be acknowledged. First, the main prognostic analysis was based on the retrospective TARGET-OS public cohort, with a limited sample size and number of events; therefore, the prognostic value of PPARG should be validated in independent cohorts in accordance with accepted tumor-marker reporting and validation principles42. In particular, candidate screening was performed in 85 TARGET-OS patients with 27 deaths, while the clinical-adjusted model evaluation used the overlapping 40-patient subset with 13 deaths. Because both analyses were derived from the same source cohort, the reported C-index improvement (0.707 to 0.829) and AIC reduction are likely to be optimistic. No independent survival cohort was available to externally validate the prognostic value of PPARG; GSE36001 was used only for tumor-versus-normal expression validation. In addition, the integrated hub score was an exploratory internal ranking heuristic rather than a validated prognostic instrument. Second, spatial transcriptomic analysis was based on a single SP_BS3 sample; although the correlations were statistically significant, the effect sizes were small and require validation across additional spatial samples. In particular, increasing the number of spatial transcriptomic samples from independent patients will be essential for obtaining more robust estimates of these weak associations, and studies based on larger spatial cohorts are warranted. Spatial transcriptomics provides a valuable in situ molecular context, but interpretation remains influenced by platform resolution, sampling strategy, tissue quality, and computational integration choices43. Moreover, the spatial analysis relied on a preprocessed public single-cell object with simplified annotations and on computational scoring and label transfer; given the minimal effect sizes, these data supported descriptive localization statements rather than mechanistic claims about vascular niches or senescence programs. Third, experimental validation was based on the osteosarcoma cell line 143B and human osteoblasts; additional osteosarcoma cell lines and clinical samples are needed, and validation in a single cell line cannot establish cell-type specificity, clinical prognostic relevance, or senescence biology. Fourth, this study demonstrated association rather than causality. Functional perturbation of PPARG in osteosarcoma cells and microenvironmental models will be needed to determine whether PPARG directly regulates senescence-related programs, vascular niches, or tumor progression. Fifth, senescence-relatedness was defined by overlap with the CellAge gene set, and PPARG was not correlated with the bulk CellAge senescence score in TARGET-OS. Moreover, bulk tumor-versus-normal comparisons were not adjusted for tumor purity or cell-type composition, so the observed downregulation may partly reflect differences in microenvironmental composition rather than malignant-cell-intrinsic changes.
PPARG is a CellAge-derived gene whose lower expression is associated with unfavorable overall survival in the TARGET-OS cohort. Its downregulation in bulk osteosarcoma comparisons, together with its enrichment in vascular, myeloid, and stromal compartments, suggests that bulk PPARG levels may partly reflect microenvironmental cell composition rather than malignant-cell-intrinsic expression. The single-cell and spatial findings are descriptive, and the prognostic association was not independently validated for survival and requires validation in an external cohort with survival outcomes. These findings nominate PPARG as a candidate biomarker for prognostic assessment in osteosarcoma and for research on senescence-related microenvironments, pending external validation and functional studies. In spatial transcriptomics, the correlations between PPARG and the senescence-related or vascular niche scores were weak in effect size, although statistically significant owing to the large number of spatial spots, and should therefore be interpreted with caution.
Disclosures
The authors declare no competing interests.
AUTHOR CONTRIBUTIONS:
Yongwen Li and Wentao Qin conceived and designed the study. Yongwen Li performed the bioinformatic and computational analyses. Tuo Liang performed the experimental validation. Rubiao Qiu and Zide Zhang contributed to figure preparation. Rubiao Qiu and Zide Zhang supervised the study and critically revised the manuscript. All authors reviewed and approved the final manuscript
Acknowledgements
The authors gratefully acknowledge the investigators and contributors of the GEO, TARGET-OS, UCSC Xena, CellAge, MSigDB, and human osteosarcoma single-cell and spatial transcriptomic atlas projects for providing publicly available datasets and resources that enabled this study. This work was supported by the Guangxi Natural Science Foundation (No. 2023GXNSFAA026111).
Materials
| Name | Company | Catalog Number | Comments |
|---|---|---|---|
| Anti-GAPDH primary antibody | Proteintech Group, Wuhan, China | 10494-1-AP | Primary antibody used to detect GAPDH as a loading control in western blotting; dilution 1:5,000. |
| Anti-PPARG primary antibody | Proteintech Group, Wuhan, China | 16643-1-AP | Primary antibody used for detection of PPARG protein by western blotting; dilution 1:1,000. |
| BCA protein assay kit | Beijing Solarbio Science & Technology Co., Ltd., Beijing, China | PC0020 | Colorimetric assay used to determine total protein concentration before electrophoresis. |
| DESeq2 | Bioconductor | Version 1.40.2 | R package used for differential gene-expression analysis of count-based transcriptomic data. |
| Dulbecco's modified Eagle's medium (DMEM) | Beijing Solarbio Science & Technology Co., Ltd., Beijing, China | 11995 | Basal culture medium used for maintenance of 143B osteosarcoma cells. |
| ECL detection reagent | Beijing Solarbio Science & Technology Co., Ltd., Beijing, China | PE0010 | Chemiluminescent substrate used for detection of HRP-conjugated antibodies in western blotting. |
| Fetal bovine serum (FBS) | Zhejiang Tianhang Biotechnology Co., Ltd. (Sijiqing), Huzhou, Zhejiang, China | 11011-8611 | Serum supplement added to culture medium to support cell growth and viability. |
| glmnet | CRAN | Version 4.1-8 | R package used for penalized regression analyses, including LASSO and elastic-net modeling. |
| GraphPad Prism | GraphPad Software, San Diego, CA, USA | Version 9.0 | Software used for statistical analysis, graph generation, and visualization of experimental data. |
| HRP-conjugated secondary antibody | Proteintech Group, Wuhan, China | SA00001-2 | Horseradish peroxidase-conjugated secondary antibody used for western blot detection; dilution 1:5,000. |
| Human osteoblast cells | Cell Applications, Inc., San Diego, CA, USA | 406-05A | Primary human osteoblast cells used as the nonmalignant comparison/control cell type. |
| Human osteosarcoma 143B cell line | American Type Culture Collection (ATCC), Manassas, VA, USA | CRL-8303 | Human osteosarcoma cell line used for in vitro validation experiments and molecular assays. |
| ImageJ | National Institutes of Health (NIH), USA | Version 1.53 | Image-analysis software used for quantitative analysis of experimental images. |
| limma | Bioconductor | Version 3.56.2 | R package used for differential expression analysis and linear-model-based statistical testing. |
| Penicillin-streptomycin | Beijing Solarbio Science & Technology Co., Ltd., Beijing, China | P1400 | Antibiotic supplement used in cell culture medium to reduce bacterial contamination. |
| PPARG and GAPDH primers | Sangon Biotech (Shanghai) Co., Ltd., Shanghai, China | Custom synthesis; sequences provided in the Methods | Custom oligonucleotide primers used for qPCR analysis of PPARG and GAPDH expression. |
| PVDF membranes, 0.45 µm | Beijing Solarbio Science & Technology Co., Ltd., Beijing, China | YA1701 | Membranes used for protein transfer during western blotting. |
| R statistical software | R Foundation for Statistical Computing, Vienna, Austria | Version 4.3.2 | Statistical computing environment used for bioinformatic analyses, model construction, and visualization. |
| randomForestSRC | CRAN | Version 3.2.2 | R package used for random survival forest modeling and feature importance analysis. |
| Reverse transcription kit | Beyotime Biotech Inc., Shanghai, China | D7168M | Used for synthesis of complementary DNA (cDNA) from isolated RNA before quantitative PCR. |
| RIPA lysis buffer | Beijing Solarbio Science & Technology Co., Ltd., Beijing, China | R0010 | Protein-extraction buffer used to lyse cells for western blot analysis. |
| Seurat | Satija Laboratory | Version 5.0.1 | R package used for single-cell RNA-sequencing data processing, integration, clustering, and visualization. |
| survival | CRAN | Version 3.5-7 | R package used for survival analysis, including Cox proportional hazards modeling. |
| SYBR Green qPCR master mix | Beijing Solarbio Science & Technology Co., Ltd., Beijing, China | SR1110 | Fluorescent master mix used for quantitative real-time PCR amplification. |
| timeROC | CRAN | Version 0.4 | R package used to generate time-dependent receiver operating characteristic curves and calculate predictive performance over time. |
| TRIzol reagent | Invitrogen, Thermo Fisher Scientific, Waltham, MA, USA | 15596026CN | Reagent used for extraction of total RNA from cultured cells. |
| Trypsin-EDTA, 0.25% | Beijing Solarbio Science & Technology Co., Ltd., Beijing, China | T1300 | Cell-dissociation reagent used for passaging and harvesting adherent cells. |
References
- Mirabello L, Troisi RJ, Savage SA. Osteosarcoma incidence and survival rates from 1973 to 2004: data from the Surveillance, Epidemiology, and End Results Program. Cancer. 2009;115:1531-1543.
- Bielack SS, et al. Prognostic factors in high-grade osteosarcoma of the extremities or trunk: an analysis of 1,702 patients treated on neoadjuvant cooperative osteosarcoma study group protocols. J Clin Oncol. 2002;20:776-790.
- Isakoff MS, Bielack SS, Meltzer P, Gorlick R. Osteosarcoma: Current Treatment and a Collaborative Pathway to Success. J Clin Oncol. 2015;33:3029-3035.
- Kansara M, Teng MW, Smyth MJ, Thomas DM. Translational biology of osteosarcoma. Nat Rev Cancer. 2014;14:722-735.
- Peng P, et al. Epigenetic remodeling under oxidative stress: Mechanisms driving tumor metastasis. MedComm - Oncology. 2024;3.
- Muñoz-Espín D, Serrano M. Cellular senescence: from physiology to pathology. Nat Rev Mol Cell Biol. 2014;15:482-496.
- Coppé JP, Desprez PY, Krtolica A, Campisi J. The senescence-associated secretory phenotype: the dark side of tumor suppression. Annu Rev Pathol. 2010;5:99-118.
- Collado M, Serrano M. Senescence in tumours: evidence from mice and humans. Nat Rev Cancer. 2010;10:51-57.
- Lehrke M, Lazar MA. The many faces of PPARgamma. Cell. 2005;123:993-999.
- Peters JM, Shah YM, Gonzalez FJ. The role of peroxisome proliferator-activated receptors in carcinogenesis and chemoprevention. Nat Rev Cancer. 2012;12:181-195.
- Barrett T, et al. NCBI GEO: archive for functional genomics data sets--update. Nucleic Acids Res. 2013;41.
- Ho XD, et al. Whole transcriptome analysis identifies differentially regulated networks between osteosarcoma and normal bone samples. Exp Biol Med (Maywood). 2017;242:1802-1811.
- Love MI, Huber W, Anders S. Moderated estimation of fold change and dispersion for RNA-seq data with DESeq2. Genome Biol. 2014;15:550.
- Avelar RA, et al. A multidimensional systems biology analysis of cellular senescence in aging and disease. Genome Biol. 2020;21:91.
- Goldman MJ, et al. Visualizing and interpreting cancer genomics data via the Xena platform. Nat Biotechnol. 2020;38:675-678.
- Prentice RL, Zhao S. Regression Models and Multivariate Life Tables. J Am Stat Assoc. 2021;116:1330-1345.
- Heagerty PJ, Lumley T, Pepe MS. Time-dependent ROC curves for censored survival data and a diagnostic marker. Biometrics. 2000;56:337-344.
- Tibshirani R. The lasso method for variable selection in the Cox model. Stat Med. 1997;16:385-395.
- Jaeger BC, et al. OBLIQUE RANDOM SURVIVAL FORESTS. Ann Appl Stat. 2019;13:1847-1883.
- Subramanian A, et al. Gene set enrichment analysis: a knowledge-based approach for interpreting genome-wide expression profiles. Proc Natl Acad Sci U S A. 2005;102:15545-15550.
- Newman AM, et al. Robust enumeration of cell subsets from tissue expression profiles. Nat Methods. 2015;12:453-457.
- Zhou Y, et al. Single-cell RNA landscape of intratumoral heterogeneity and immunosuppressive microenvironment in advanced osteosarcoma. Nat Commun. 2020;11:6322.
- Stuart T, et al. Comprehensive Integration of Single-Cell Data. Cell. 2019;177:1888-1902.e21.
- Hao Y, et al. Integrated analysis of multimodal single-cell data. Cell. 2021;184:3573-3587.e29.
- Zheng X, et al. A single-cell and spatially resolved atlas of human osteosarcomas. J Hematol Oncol. 2024;17:71.
- Ståhl PL, et al. Visualization and analysis of gene expression in tissue sections by spatial transcriptomics. Science. 2016;353:78-82.
- Kresse SH, et al. Integrative analysis reveals relationships of genetic and epigenetic alterations in osteosarcoma. PLoS One. 2012;7.
- Ritchie ME, et al. limma powers differential expression analyses for RNA-sequencing and microarray studies. Nucleic Acids Res. 2015;43.
- Livak KJ, Schmittgen TD. Analysis of relative gene expression data using real-time quantitative PCR and the 2(-Delta Delta C(T)) Method. Methods. 2001;25:402-408.
- Schneider CA, Rasband WS, Eliceiri KW. NIH Image to ImageJ: 25 years of image analysis. Nat Methods. 2012;9:671-675.
- Gill J, Gorlick R. Advancing therapy for osteosarcoma. Nat Rev Clin Oncol. 2021;18:609-624.
- Sun L, et al. Single-cell RNA sequencing revealed PPARG promoted osteosarcoma progression: based on osteoclast proliferation. Front Immunol. 2024;15:1506225.
- Yuan B, et al. Nuclear receptor modulators inhibit osteosarcoma cell proliferation and tumour growth by regulating the mTOR signaling pathway. Cell Death Dis. 2023;14:51.
- Lu Y, et al. Oridonin exerts anticancer effect on osteosarcoma by activating PPAR-γ and inhibiting Nrf2 pathway. Cell Death Dis. 2018;9:15.
- Gorgoulis V, et al. Cellular Senescence: Defining a Path Forward. Cell. 2019;179:813-827.
- Faget DV, Ren Q, Stewart SA. Unmasking senescence: context-dependent effects of SASP in cancer. Nat Rev Cancer. 2019;19:439-453.
- Hernandez-Segura A, et al. Unmasking Transcriptional Heterogeneity in Senescent Cells. Curr Biol. 2017;27:2652-2660.e4.
- Tian H, et al. Managing the immune microenvironment of osteosarcoma: the outlook for osteosarcoma treatment. Bone Res. 2023;11:11.
- Hanahan D. Hallmarks of Cancer: New Dimensions. Cancer Discov. 2022;12:31-46.
- Ricote M, Li AC, Willson TM, Kelly CJ, Glass CK. The peroxisome proliferator-activated receptor-gamma is a negative regulator of macrophage activation. Nature. 1998;391:79-82.
- Jiang C, Ting AT, Seed B. PPAR-gamma agonists inhibit production of monocyte inflammatory cytokines. Nature. 1998;391:82-86.
- McShane LM, et al. REporting recommendations for tumour MARKer prognostic studies (REMARK). Br J Cancer. 2005;93:387-391.
- Moses L, Pachter L. Publisher Correction: Museum of spatial transcriptomics. Nat Methods. 2022;19:628.