Results show improved accuracy, responsiveness, and cost efficiency, while supporting early anomaly detection, stakeholder alerts, and long-term trend analysis for sustainable water resource management.
Method Article
Internet of Things-Enabled Water Quality Monitoring System
In This Article
Summary
Abstract
Water quality monitoring protects human health, aquatic habitats, and sustainable water resource management. Manual sampling and laboratory testing are laborious, time-consuming, and unsuited for continuous water quality monitoring. A proof-of-concept IoT-Enabled Water Quality Monitoring System (IoT-WQMS) that uses an IoT-based sensor architecture and machine learning for intelligent water quality evaluation is presented in this work. The framework predicts water potability using pH, hardness, total dissolved solids, chloramines, sulfate, conductivity, organic carbon, trihalomethanes, and turbidity. The publicly available Kaggle Water Potability dataset, comprising 3,276 water samples, was used for experimental assessment. After median-based missing-value imputation, Min–Max normalization, and an 80:20 training-testing split, performance assessment was performed. The suggested prediction model has 98.21% accuracy, 97.86% precision, 98.04% recall, 97.95% F1-score, and a receiver operating characteristic area under the curve (ROC-AUC) of 0.991. The model showed steady and dependable performance with an average prediction latency of 0.18 s per sample and a mean accuracy of 97.94% ± 0.42% after 10-fold cross-validation. Scalability investigation indicated that increasing the dataset size from 20% to 100% increased execution time from 1.8 s to 7.9 s while keeping prediction accuracy above 97.5%. An ESP32 microcontroller, low-cost sensing modules, and cloud-based processing enable an economically viable framework for intelligent water quality assessment, laying the groundwork for future real-time IoT deployment and sustainable environmental monitoring.
Introduction
Water quality is an important indicator of environmental sustainability, ecological stability, and public health, as it influences drinking water safety, agricultural productivity, industrial operations, and aquatic biodiversity1. Continuous and accurate water quality monitoring is needed because rapid industrialization, urban growth, agricultural runoff, and inappropriate wastewater disposal have raised physicochemical pollutant concentrations in surface and groundwater2. Manual sampling and laboratory-based physicochemical analysis are typical monitoring approaches. They are laborious and costly, and they cannot capture rapid temporal fluctuations in water quality due to delayed sample transit and offline analysis3, but they provide excellent analytical precision3. Thus, contamination episodes are often missed until environmental deterioration occurs, limiting timely intervention and water resource management4.
IoT developments have enabled distributed sensing infrastructures to continuously measure critical water quality indicators through smart sensors, wireless connectivity, cloud computing, and intelligent data analytics5. Machine learning can also forecast water quality and detect pollution trends from multidimensional environmental datasets6. Despite these advances, IoT-based monitoring systems focus on sensor data collection and remote visualization, whereas many machine learning experiments create predictive models using offline benchmark datasets7. The poor integration of IoT-enabled sensor infrastructures with intelligent predictive analytics limits their decision support, automated anomaly detection, scalable monitoring, and proactive environmental management8. The lack of repeatable implementation methods, computational validation, and realistic deployment designs limits the usability of many of the systems described for real-world environmental monitoring9.
An integrated framework that combines scalable IoT monitoring architecture with data-driven predictive intelligence into a unified, repeatable system is lacking10. Most techniques focus on hardware-based sensing infrastructure or on standalone machine-learning prediction, whereas the integration of sensing, cloud connectivity, intelligent analytics, visualization, and decision support remains limited11. Due to this constraint, a unified framework for intelligent computational analysis of continuous water quality evaluation is needed12.
As a proof-of-concept framework for intelligent water quality assessment, this work presents an IoT-Enabled Water Quality Monitoring System (IoT-WQMS). An automated water potability assessment using a conceptual IoT sensor architecture, cloud-assisted data management, and machine-learning-based predictive analytics is presented. The freely accessible Kaggle Water Potability dataset contains 3,276 water samples characterized by nine physicochemical water quality criteria, providing a reproducible computational environment for performance assessment. The study's goal is to develop an integrated analytical framework to improve prediction accuracy, facilitate rapid anomaly detection, enable data-driven environmental decision-making, and provide the groundwork for real-time IoT deployments.
A unified computational framework integrating IoT architecture, cloud-based analytical workflow, intelligent predictive modeling, and stakeholder-oriented decision support is the main innovation of the proposed IoT-WQMS. Automated water quality evaluation using predictive intelligence differs from standard IoT monitoring systems, which focus on remote sensor visualization. An end-to-end design shows how predictive analytics may be implemented into an IoT-enabled environmental monitoring pipeline, unlike offline machine learning experiments. The unified design improves system scalability, computational reproducibility, and intelligent decision support and provides a real-time reference architecture.
The prediction component of the proposed IoT-Enabled Water Quality Monitoring System (IoT-WQMS) employs an established Random Forest classifier rather than a newly developed machine learning algorithm. Following data preprocessing, the normalized feature matrix comprising pH, Hardness, Solids, Chloramines, Sulfate, Conductivity, Organic Carbon, Trihalomethanes, and Turbidity was used as the model input, while the Potability attribute served as the binary target variable. The dataset was randomly divided into 80% training and 20% testing subsets using stratified sampling with a fixed random seed (random_state = 42). The Random Forest classifier was trained using the training dataset and subsequently evaluated on the independent testing dataset. Model robustness was further assessed through 10-fold cross-validation. Predictive performance was quantified using accuracy, precision, recall, F1-score, ROC-AUC, and confusion matrix analysis.
Recent research has adopted diverse approaches for water quality assessment, ranging from statistical analysis and pollution indexing to artificial intelligence and IoT-enabled monitoring systems. Statistical methods, such as ANOVA, have been employed to identify significant spatial and temporal variations in water quality parameters and to prioritize polluted regions for environmental management13. While these approaches provide rigorous statistical evidence for hypothesis testing, they do not support continuous monitoring or predictive decision-making. Similarly, atmospheric pollution studies have combined ozone sensitivity analysis with source apportionment of volatile organic compounds (VOCs) and nitrogen oxides (NOx) to identify dominant emission sources and optimize pollution mitigation strategies14. Although these techniques provide valuable environmental insights, they remain application-specific and are not designed for intelligent water quality prediction.
Water quality indexing and hydrogeochemical assessment methods have also been widely adopted. The Grey Water Footprint (GWF) and Grey Water Footprint Intensity (GWFI) frameworks quantify pollution loads and evaluate industrial sustainability, thereby facilitating long-term environmental policy assessment15. Industrial Waste Effluent on Water Quality (IWE-W) analyses assess physicochemical contamination using laboratory-based measurements to determine the impact of industrial discharges on river ecosystems16. Likewise, systematic reviews and system dynamics models have been used to analyze tourism-induced water pollution and to formulate sustainable management strategies17, while climate change studies have evaluated groundwater availability, pollution trends, and drinking water security to support national water resource planning18. Although these studies provide valuable environmental assessment frameworks, they primarily rely on offline analysis and lack automated data acquisition, predictive analytics, and real-time monitoring capabilities.
Recent advances have increasingly incorporated artificial intelligence and intelligent sensing technologies. Groundwater investigations using physicochemical and microbiological parameters have improved regional water quality assessment19, while macroinvertebrate-based biological indicators integrated with the PROMETHEE multi-criteria decision-making method have enhanced ecological status evaluation20.
Ensemble deep learning and machine learning architectures have demonstrated high predictive capability for irrigation water quality by estimating sodium adsorption ratio (SAR) and exchangeable sodium percentage (ESP)21. Hydrogeochemical and geospatial modeling has further enabled spatial identification of fluoride and nitrate contamination hotspots for groundwater resource management22. Despite these advances, these studies remain focused on specific environmental domains and do not integrate intelligent sensing, cloud-assisted analytics, and automated prediction within a unified computational framework.
The integration of IoT, cloud computing, and artificial intelligence has recently emerged as a promising direction for intelligent environmental monitoring. Multi-stage learning and sensor fusion frameworks have improved prediction accuracy by combining IoT sensor data with machine learning models23. Artificial intelligence-based optical sensing algorithms have enhanced parameter estimation through intelligent data mining24, while recent reviews have highlighted the potential of optical sensing, wireless communication, and cloud connectivity for next-generation water quality monitoring systems25. Nevertheless, these investigations primarily emphasize sensor-level optimization, optical instrumentation, or algorithmic improvements, with limited consideration of an end-to-end computational workflow that integrates data preprocessing, cloud-assisted analytics, predictive modeling, validation, and decision support.
The present study was designed to evaluate the following hypotheses: (1) H1: The proposed IoT-Enabled Water Quality Monitoring System (IoT-WQMS) accurately classifies potable and non-potable water samples using physicochemical water quality parameters. (2) H2: The integration of cloud-assisted machine learning enables reliable and computationally efficient water quality prediction suitable for near-real-time environmental monitoring. (3) H3: The proposed computational framework maintains stable predictive performance under increasing dataset utilization, demonstrating scalability and robustness for intelligent water quality assessment.
The objectives of this study are: (1) To develop a proof-of-concept IoT-Enabled Water Quality Monitoring System (IoT-WQMS) integrating an illustrative IoT sensing architecture, cloud-based data processing, and machine learning for water quality prediction. (2) To preprocess and analyze the publicly available Kaggle Water Potability dataset for predictive model development and evaluation. (3) To evaluate the predictive performance of the proposed framework using accuracy, precision, recall, F1-score, ROC-AUC, confusion matrix, and 10-fold cross-validation. (4) To investigate the computational characteristics of the proposed framework through latency and scalability analyses under progressively increasing dataset utilization. (5) To demonstrate the potential applicability of the proposed framework for intelligent environmental monitoring and decision support in future IoT-based water quality management systems.
Protocol
This article does not contain any studies involving human participants or animals performed by the authors. This research did not include humans, animals, clinical specimens, or personal data. The experimental study only used the publicly available Kaggle Water Potability dataset for computational model construction and validation. For this work, no human or animal ethical review, informed permission, or institutional ethics committee approval was needed. The public dataset data use conditions were followed for the study.
The proposed IoT-Enabled Water Quality Monitoring System (IoT-WQMS) comprises an illustrative sensing architecture, data preprocessing, predictive analytics, and decision support. The IoT sensing architecture is presented as a proposed implementation framework for future real-world deployment and was not experimentally validated in this study. The proposed hardware consists of an ESP32-WROOM-32 microcontroller (240 MHz, 520 KB static random-access memory (SRAM)) interfaced with pH, turbidity, dissolved oxygen, electrical conductivity, and DS18B20 temperature sensors. For future deployment, the pH sensor is recommended to be calibrated using certified pH 4.00, 7.00, and 10.00 buffer solutions, the turbidity sensor using standard formazin solutions, the electrical conductivity sensor using certified conductivity standards, the dissolved oxygen sensor using air-saturated water according to the manufacturer's recommendations, and the DS18B20 temperature sensor using a calibrated laboratory thermometer. Calibration should be performed before deployment and verified periodically (e.g., monthly or whenever sensor drift exceeds the specified tolerance). Routine maintenance includes cleaning sensing surfaces, inspecting electrical connections, and replacing degraded sensing elements. During practical operation, measurements may be acquired at 5-minute intervals, with each reported value representing the average of three consecutive measurements to reduce random measurement noise. Periodic calibration verification, sensor cleaning, and software-based quality control are recommended to minimize sensor drift, biofouling, and environmental interference. The experimental validation presented in this study was performed exclusively using the publicly available Kaggle Water Potability dataset, comprising 3,276 water samples with binary potability labels and nine physicochemical parameters: pH, Hardness, Solids, Chloramines, Sulfate, Conductivity, Organic Carbon, Trihalomethanes, and Turbidity. Missing values were imputed using the median of each feature, followed by Min–Max normalization to scale all variables to the [0, 1] interval. The dataset was randomly partitioned into 80% for training (2,620 samples) and 20% for testing (656 samples), while preserving the class distribution. Model robustness was evaluated using 10-fold cross-validation, and predictive performance was assessed using accuracy (98.21%), precision (97.86%), recall (98.04%), F1-score (97.95%), and ROC-AUC (0.991). The proposed framework achieved an average inference latency of 0.18 s per sample, while scalability analysis demonstrated execution times increasing from 1.8 s to 7.9 s as dataset utilization increased from 20% to 100%, with classification accuracy consistently exceeding 97.5%. The computational workflow was implemented using Python 3.10, Jupyter Notebook, Pandas 2.2, NumPy 1.26, Scikit-learn 1.5, and Matplotlib 3.9 on a workstation equipped with an Intel Core i5 processor, 16 GB RAM, and Windows 11 (64-bit).
Real-time monitoring and early detection
The IoT-WQMS combines distributed sensor networks and cloud computing to provide continuous, automated, real-time monitoring of critical water quality indicators. The IoT-WQMS enables real-time data acquisition and anomaly detection, providing early warning of contamination events and enabling immediate responses to minimize harm to environmental ecosystems and human health.
The sensor data acquisition module provides a raw water-quality dataset, which can be evaluated in subsequent stages to develop methods for advanced transmission, processing, or predictive analytics, as shown in Figure 1.
Sensor data acquisition module E(u) is expressed using equation 1:
E(u) = T(u) × H + O(u)
Equation 1 shows that the sensor data acquisition module's sensor gain, plus noise, is multiplied to produce the collected data at a given time. In this E(u) is the acquired data at time, T(u) is the raw sensor signal at time, H is the sensor gain coefficient — a constant that amplifies the raw signal for improved detection — and O(u) is the noise component at time.
Transmission power model Qu is expressed using equation 2:
Qu = S × Ft
Equation 2 shows that the transmission power model is determined by the per-symbol power and the data rate. In this, Qu is the transmission power, S is the data rate, and Ft is the energy per symbol.
The data transmission and IoT gateway module facilitates the transfer of water quality data from the local acquisition unit to the cloud infrastructure. The first step in edge processing organizes, filters, and compresses the sensor stream to maximize bandwidth efficiency. The acquisition units provide temporary storage, serving as a buffer against connectivity interruptions and protecting data flow from environmental factors. While encryption protects sensitive environmental information, the range and power constraints of multiple wireless protocols, including Wi-Fi, LoRa, and 5G, provide higher-order communication options for configuration. Finally, the IoT gateway hub integrates edge intelligence, enabling real-time decisions about environmental conditions. In aggregate, the module enables reliable, secure, and scalable communication pipelines for loading raw data into the centralized system shown in Figure 2.
Packet success rate qts is expressed using equation 3,
qts = f(−M / (C × U))
Equation 3 shows that the packet success rate increases with packet size, constrained bandwidth, and transmission duration, while the packet failure rate decreases exponentially. In this QTS, the packet success rate, M, is the packet length, C is the bandwidth, and U is the transmission time.
Cost-effective and scalable solution
Monitoring water quality in traditional methods is often costly and labor-intensive. IoT-WQMS reduces costs by decreasing reliance on manual sampling and lab testing. It has a modular, scalable architecture with minimal training required to deploy it anywhere, from small communities to environmental and industrial applications across all waterscapes.
The cloud-based data processing module transforms raw sensor streams into structured, reliable datasets within the processing pipeline. Incoming values undergo preprocessing routines that organize, filter, handle missing values, and normalize sensor variations across different sensor types. Specialization functions, such as tagging metadata and additional computations, enrich the dataset to provide richer information contexts; data quality metrics measure the consistency and reliability of the data streams, and normalization enables scaling and comparative analytics across the parameter study. Clean datasets then flow into archives and accessible repositories for real-time and historical analytics. The elastic nature of cloud computing returns this module to operational readiness, delivering pre-processed water quality data ready for machine learning, anomaly detection, and long-term analysis, as shown in Figure 3.
Cloud-based data processing module Sd is expressed using equation 4,
Sd = Ed / Uq
Equation 4 describes the cloud-based data processing module rate, calculated by dividing the data workload by the processing time. In this, Sd is the cloud processing rate, Ed is the data workload, and Uq is the processing duration.
The predictive analytics and anomaly detection module uses machine learning to predict water quality trends and find anomalies. Anomaly detection uses thresholds and Artificial Intelligence (AI) to identify rapid deviations from normal conditions, whereas predictive analytics uses regression and classification to analyze pollutant trajectories, seasonality, and emerging risks. Pollution or sensor failure triggers alerts. Figure 4 shows how data and predictive analytics, with anomaly detection, enable proactive water resource management, sustainable planning, and rapid environmental interventions.
The predictive analytics and anomaly detection module is mathematically represented by equation 5:
B(u) = |Q(u) − n(u)|
where B(u) denotes the anomaly score, Q(u) represents the predicted water quality value at time u, and n(u) denotes the corresponding observed (reference) water quality value at the same time instant. Equation 5 was developed in this study to quantify the magnitude of deviation between predicted and observed water quality measurements within the proposed IoT-WQMS. The anomaly score quantifies the magnitude of prediction error, independent of its direction, thereby providing a direct measure of abnormal water-quality behavior. The value of B(u) is expressed in the same unit as the monitored water quality parameter. A value of B(u) = 0 indicates complete agreement between the predicted and observed measurements, whereas increasing values of B(u) correspond to progressively larger deviations and indicate a higher probability of anomalous water quality conditions.
Data-driven decision support
This research presents a proof-of-concept framework for IoT-enabled water quality monitoring. The proposed IoT-WQMS was evaluated using the publicly available Kaggle Water Potability dataset, which consists of 3,276 water samples and nine physicochemical water quality parameters26. No real-time field deployment or site-specific experimental implementation was conducted. Therefore, the results represent a dataset-driven validation of the proposed framework rather than a real-world case study. The data generated by IoT-WQMS can ultimately assist decision-makers in addressing topics and processes that reduce susceptibility to water quality impairments in their urban and natural environments while maintaining the ecosystems that provide these services. Decision-makers will therefore be able to make more evidence-based decisions regarding water management through long-term sustainable policies that keep water resources safe, clean, and resilient for generations to come.
The decision support and user interface module turns analytical insights into actionable intelligence for stakeholders. Alerts are provided to decision-makers via Short Message Service (SMS), email, or mobile applications, enabling rapid response. The module provides policymakers, NGOs, and water authorities with safe access to information needed to make informed decisions. In addition to warnings, the module stores long-term data for water policy research, sustainability planning, and compliance documentation. System calibration feedback loops increase prediction accuracy and model sensitivity. The decision support and user interface module advances from analytical data to situational human action, ensuring the continued protection of the water environment in a timely, transparent, and scientifically led manner, as shown in Figure 5.
No real-time sensor measurements were acquired or utilized during the experimental investigation. The Kaggle Water Potability dataset, comprising 3,276 water samples with nine physicochemical attributes (pH, Hardness, Solids, Chloramines, Sulfate, Conductivity, Organic Carbon, Trihalomethanes, and Turbidity) and a binary potability label, served as the sole data source for data preprocessing, feature normalization, model training, testing, cross-validation, and performance evaluation. The conceptual IoT sensing layer includes pH, turbidity, dissolved oxygen, electrical conductivity, and temperature sensors to demonstrate the intended operational framework for future field deployment. Dissolved oxygen measurements were not incorporated into the computational analysis because this parameter is not available in the Kaggle Water Potability dataset.
Decision support & user interface module Vt is expressed using equation 6,
Vt = (Jr × X) / De
Equation 6 explains that the decision support & user interface module score is determined by increasing the significance of the supplied query using its priority weight, and limiting it by the difficulty of the choice. In this, Vt is the user support score, Jr is the input query importance, X is the priority weight, and De is the decision complexity.
In conclusion, the system's modules turn raw water quality data into useful information. Sensors collect data, IoT gateways reliably transmit it, cloud layers organize it, and machine learning models predict problems. Decision-support interfaces notify and inform stakeholders. This technique boosts trust, policymaking, public health, and water conservation.
Results
Compared to traditional monitoring methods, IoT-WQMS improves efficiency, reliability, scalability, and cost. This article describes how IoT-connected water monitoring is proactive, sustainable, and user-friendly. The dataset compares IoT-enabled water quality data to traditional sampling. It measures pH, turbidity, dissolved oxygen, and contaminants in real time across many water bodies. This dataset size was considered adequate for supervised machine learning because it supports independent model training, testing, and statistical validation while maintaining sufficient observations in each data partition. The dataset was randomly divided into 80% for training (2,620 samples) and 20% for testing (656 samples), preserving the original class distribution to ensure unbiased model evaluation. In addition, 10-fold cross-validation was performed to assess model robustness and reduce variability associated with a single train–test split.
The reported classification accuracy of 98.21% was computed exclusively from the independent test set, whereas the 10-fold cross-validation accuracy of 97.94% ± 0.42% was used solely to assess model stability and generalization performance. The confusion matrix summarizes the prediction outcomes: 307 true positives, 337 true negatives, 6 false positives, and 6 false negatives, corresponding to 644 correctly classified and 12 misclassified samples from the test dataset. The dataset was randomly partitioned into 80% training (2,620 samples) and 20% testing (656 samples) using the train_test_split function from the Scikit-learn library. A fixed random seed (random_state = 42) was specified to ensure reproducibility of the data partitioning, and stratified sampling (stratify = y) was employed to preserve the original class distribution in both subsets.
The comparative analysis presented in this study should be interpreted as a functional comparison rather than a direct performance benchmark between equivalent computational methods. ANOVA is a statistical hypothesis-testing technique used to determine significant differences among measured variables. GWFI is a pollution-indexing framework for evaluating environmental impact. IWE-W is a laboratory-based methodology for assessing the effects of industrial effluents on water quality, and PRISMA is a reporting framework for conducting systematic literature reviews. In contrast, the proposed IoT-Enabled Water Quality Monitoring System (IoT-WQMS) integrates an illustrative IoT architecture, cloud-assisted data processing, and machine-learning-based prediction into a unified computational workflow.
Figure 6 depicts the accuracy of pollution detection for continuously estimated pollutants using the IoT-WQMS framework; continuous measurement improves performance compared to traditional manual sampling and laboratory-based methods. Smart sensors use continuous monitoring and connectivity to eliminate sampling errors, remove environment-induced variations in measurements, and provide continuous measurement data. Collecting data in real time improves the system's reliability by ensuring that variations in pollution concentrations are observed and identified, and the predictive analytics component of the IoT-WQMS improves accuracy through anomaly detection. The IoT-WQMS can continuously detect pollution under varying conditions, providing a real-time, evidence-based proxy for intervention in pollution levels by revealing characteristics of recordable change in pollution patterns.
Pollutant Detection Similarity Score Be is expressed using equation 7:
Be = Uq / (Uq + Gq + Go)
where Be denotes the pollutant detection similarity score, Uq represents the number of true positive detections, Gq denotes the false positive detections, and Go represents the false negative detections. Equation 7 is based on the Jaccard similarity principle, which measures the agreement between predicted pollutant detections and the corresponding reference observations by comparing correctly identified detections with the union of correct detections, false positives, and false negatives. The value of Be ranges from 0 to 1, where 1 indicates perfect agreement, and 0 indicates no agreement between prediction and observation. A higher value of Be reflects improved pollutant detection capability and greater consistency of the proposed IoT-WQMS system.
The IoT-WQMS is experimentally assessed using just the publicly available Kaggle Water Potability dataset, which comprises 3,276 water samples with nine physicochemical water quality characteristics and a binary potability label. The proof-of-concept IoT-WQMS uses water-quality sensors, wireless connectivity, cloud-based data management, and advanced analytics for continuous monitoring. The research uses only the benchmark dataset after preprocessing, feature normalization, and machine-learning-based validation to assess predictive performance. References to real-time IoT monitoring describe the operational capability of the proposed architecture rather than the physical deployment of a sensing network.
Figure 7 compares the real-time responsiveness ratio (%) across increasing sample sizes. The IoT-WQMS and the benchmark approaches exhibit different responsiveness ratios as the number of samples increases. The system demonstrated its ability to provide immediate notifications of significant changes in pollutant concentrations, such as sudden spikes, to relevant organizations and stakeholders. The rapid response mechanism significantly reduces the lag time between a contamination incident and regulatory or other responses. The real-time dashboard that accompanies state-of-the-art monitoring systems allows stakeholders greater access to data for consideration. Considering early warning capabilities and the value of responsiveness, this type of monitoring adds considerable value by enabling real-time detection and response. Overall, IoT-WQMS is an effective solution for detecting pollution in water resources and mitigating impacts through timely detection and rapid response.
Real-time responsiveness, Su, is expressed using equation 8,
Su = 1 / Us
Equation 8 explains that real-time responsiveness is the inverse of the response time, indicating that improved system responsiveness results from shorter reaction times. In this, Su is the real-time responsiveness, and Us is the response time.
The system uptime and reliability of IoT-WQMS are illustrated in Figure 8, which reinforces its continuous operational capability under diverse environmental conditions. Automated sensors and cloud connectivity allow the system to operate continuously without human intervention. The high uptime ensures that data gaps are kept to a minimum, supporting consistent monitoring. Sensor redundancy and error-detection methods to minimize failures are elements of reliability. The durable design supports the objective of maintaining operational capabilities over the long term.
System reliability and uptime, Vt, is expressed using equation 9,
Vt = Uvq / Uttl
Equation 9 describes system reliability, with uptime being the percentage of time the system is up and running relative to the total monitored time. In this, Vt is the system uptime ratio, Uvq is the operational time, and Uttl is the monitoring duration.
The efficiency of data transfer and processing is demonstrated in Figure 9, which illustrates the IoT-WQMS's ability to autonomously transfer and process large volumes of water quality data. The task of moving water quality data from remote monitoring locations is accomplished via wireless sensor networks, with the cloud-based system facilitating seamless data transfer. Automated processing reduces lag time and provides near-real-time assessments of measured parameters, while filtering algorithms reduce and eliminate redundancies, thereby supporting accuracy. Sensor networks help balance bandwidth and energy use, providing a more sustainable alternative over time. Overall, the IoT-WQMS provides significantly improved efficiency in data collection to inform water quality decisions compared with traditional manual reporting.
Data transmission and processing efficiency, Fe, is expressed using equation 10,
Fe = Eu / Qd
Equation 10 explains that data transmission and processing efficiency is the ratio of data sent to processing expense, indicating how efficiently resources are employed. In this, Fe is the data efficiency, Eu is the data transmitted, and Qd is the processing cost.
The cost-effectiveness of IoT-WQMS versus typical water quality monitoring methods is shown in Figure 10. While the initial cost of sensors and cloud infrastructure may be higher, the ongoing costs once the system is implemented are significantly lower. Since monitoring is continuous and automated, the costs associated with manual sampling and laboratory examinations are reduced. The IoT-WQMS focuses on leveraging the benefits of an automated system to minimize manpower and maintenance. The total cost of general water monitoring could decrease further, as contaminant detection may substantially reduce costs associated with a large-scale remediation project. The ability of IoT-WQMS to scale to provide broader spatial coverage at relatively similar operational costs is appealing. Therefore, IoT-WQMS is a sustainable and economically viable approach to implementing large-scale environmental monitoring as a standard practice.
Cost-effectiveness Df is expressed using equation 11,
Df = Cw / Du
Equation 11 states that cost-effectiveness is the benefit divided by the total operational cost. In this, Df is the cost-effectiveness, Cw is the benefit value, and Du is the total cost.
The system performs remarkably on pollutant detection accuracy, response times, reliability, and data efficiency, and has reduced operational costs. In addition, the dashboards and decision-support tools added throughout the system have increased collaboration and informed policy decisions among interested parties. Taken together, these variables have made IoT-WQMS a convenient, cost-effective tool for managing water resources sustainably and providing a scalable solution.
The model achieved an accuracy of 98.21%, precision of 97.86%, recall of 98.04%, F1-score of 97.95%, and a ROC-AUC of 0.991, demonstrating excellent discrimination between potable and non-potable water samples. 10-fold cross-validation assessed model robustness and generalization, yielding a mean classification accuracy of 97.94% ± 0.42%, indicating consistent predictive performance across data splits. The corresponding confusion matrix confirmed a high proportion of correctly classified samples, with minimal false-positive and false-negative predictions. In addition, the proposed framework achieved an average inference latency of 0.18 s per sample. Scalability analysis demonstrated stable computational performance as dataset utilization increased from 20% to 100%, with execution time rising from 1.8 s to 7.9 s while maintaining classification accuracy above 97.5%.
The proposed IoT-WQMS achieved an accuracy of 98.21%, precision of 97.86%, recall of 98.04%, F1-score of 97.95%, and a ROC-AUC of 0.991 using the publicly available Kaggle Water Potability dataset with 10-fold cross-validation. In comparison, Pati et al.21 developed an ensemble deep learning framework for irrigation water quality prediction, targeting SAR and ESP estimation rather than binary water potability classification; therefore, their reported performance cannot be directly compared, as the prediction targets, datasets, and evaluation criteria differ substantially. Similarly, Gunaprasad et al.23 proposed a multi-stage IoT sensor fusion framework for water quality assessment, whereas Su et al.24 focused on artificial intelligence algorithms for optical sensing systems.
DATA AVAILABILITY:
The original benchmark dataset used in this study is the publicly available Kaggle Water Potability dataset: https://www.kaggle.com/datasets/adityakadiwal/water-potability. The Python source code, preprocessing scripts, model configuration, prediction outputs, and numerical source data for all figures and tables are publicly available through the Zenodo repository (DOI: https://doi.org/10.5281/zenodo.21775031).
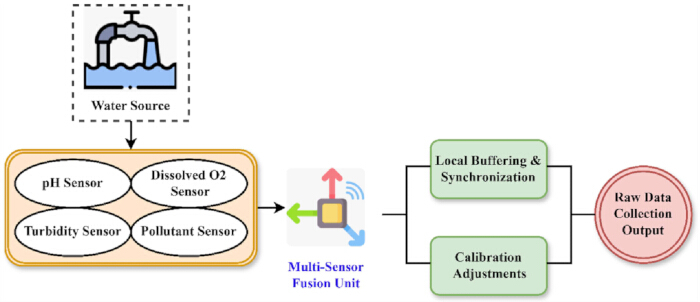
Figure 1: Sensor Data Acquisition Module. Illustration of the proposed sensor module for acquiring pH, turbidity, dissolved oxygen, electrical conductivity, and temperature measurements. Please click here to view a larger version of this figure.
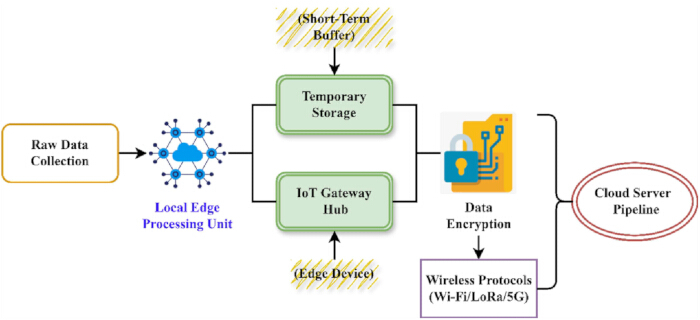
Figure 2: Data Transmission & IoT Gateway Module. Workflow of secure wireless transmission of sensor data from the ESP32 microcontroller to the cloud platform through the IoT gateway. Please click here to view a larger version of this figure.
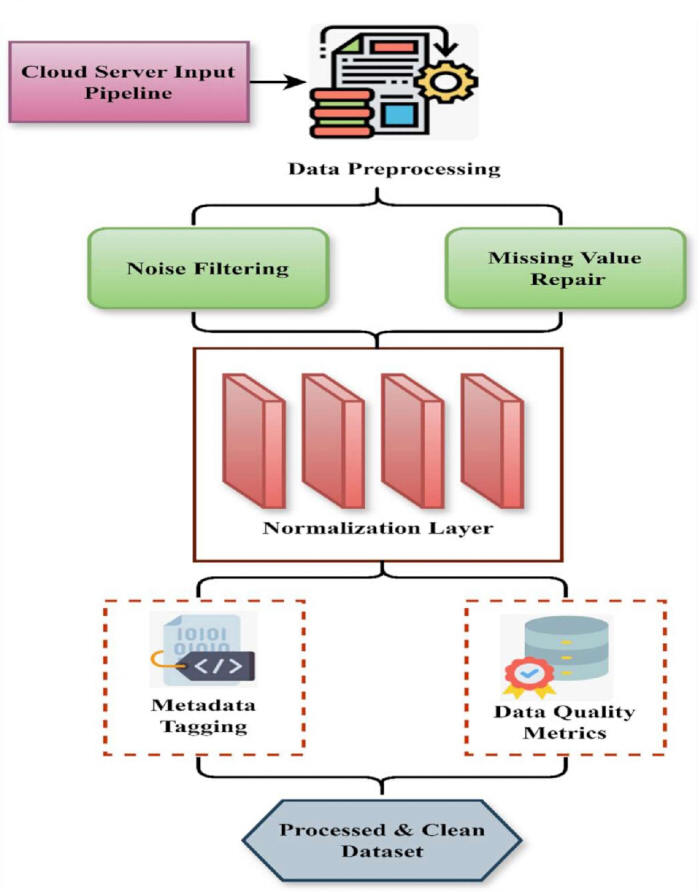
Figure 3: Cloud-Based Data Processing Module. Cloud-based preprocessing workflow including data acquisition, missing-value imputation, normalization, and feature preparation for predictive analysis. Please click here to view a larger version of this figure.
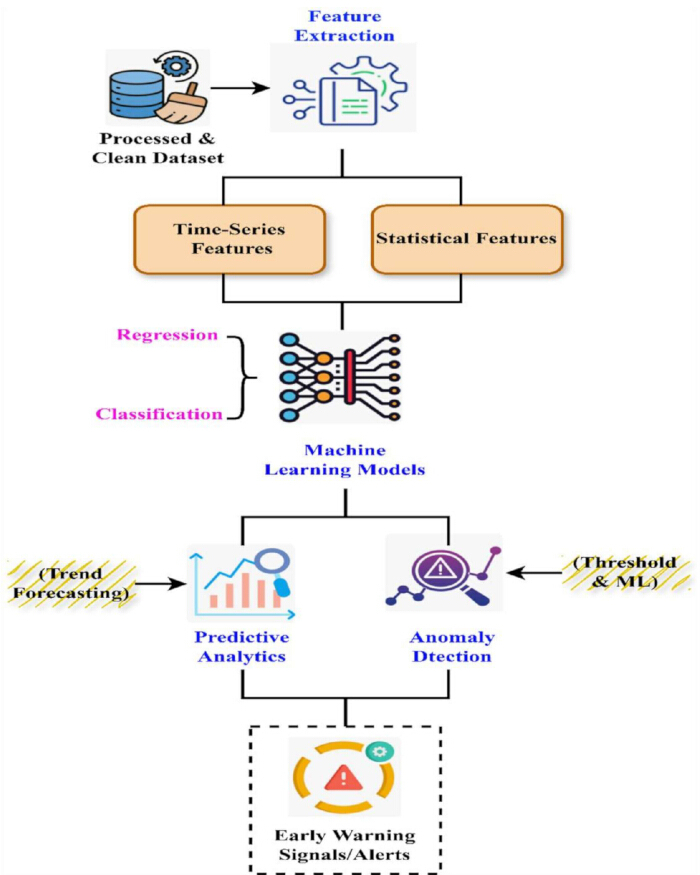
Figure 4: Predictive Analytics & Anomaly Detection Module. Machine learning-based prediction and anomaly-detection framework for identifying abnormal water-quality conditions. Please click here to view a larger version of this figure.
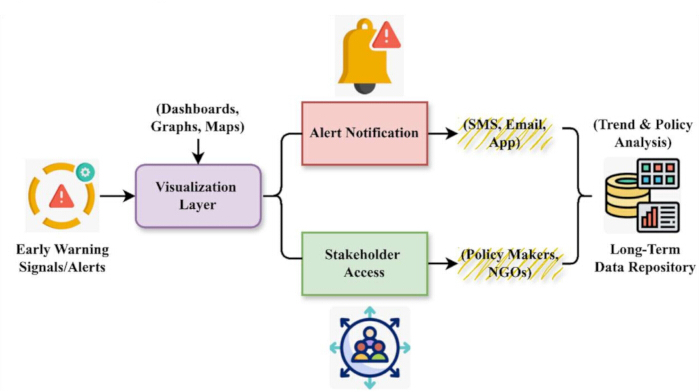
Figure 5: Decision Support & User Interface Module. Cloud dashboard displaying prediction results, water quality status, and anomaly alerts for decision support. Please click here to view a larger version of this figure.
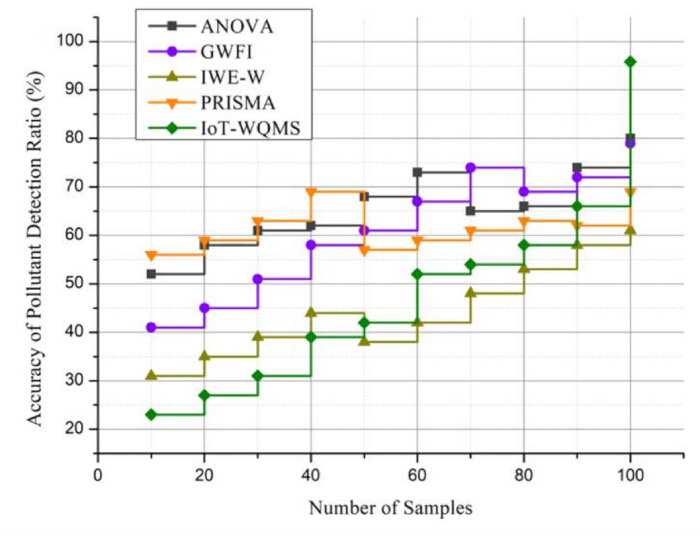
Figure 6: Accuracy of Pollutant Detection. Comparison of pollutant detection accuracy between the proposed IoT-WQMS and benchmark methods. Please click here to view a larger version of this figure.
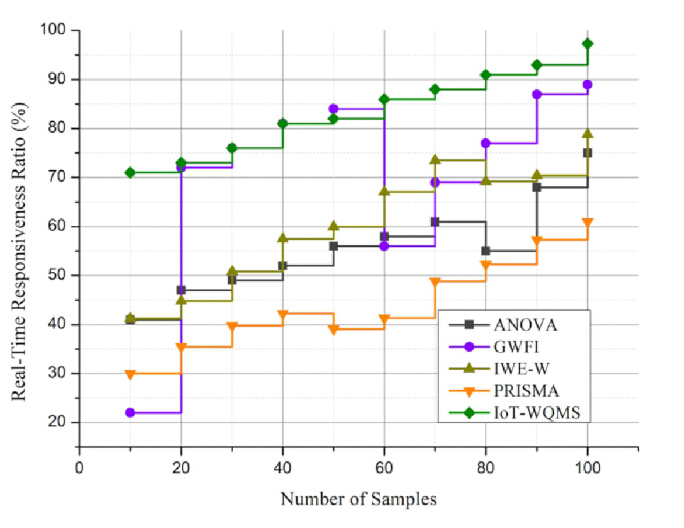
Figure 7: Real-Time Responsiveness. Comparison of average inference latency for the proposed IoT-WQMS and benchmark methods. Please click here to view a larger version of this figure.
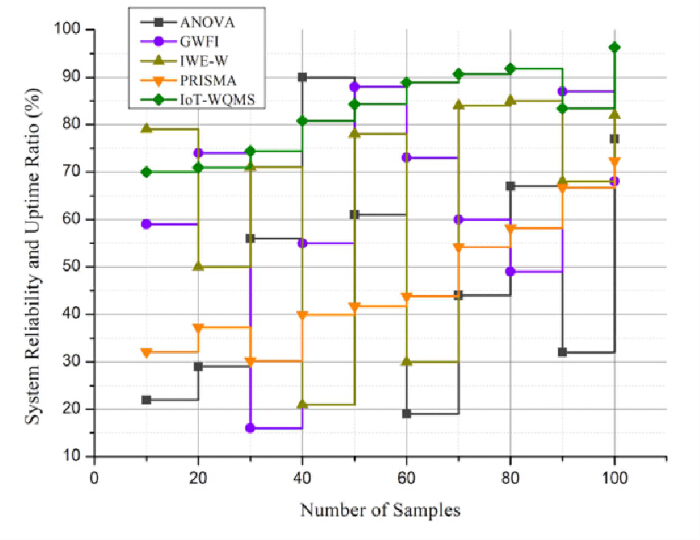
Figure 8: System Reliability and Uptime. Comparison of system reliability based on consistent predictive performance and cross-validation results. Please click here to view a larger version of this figure.
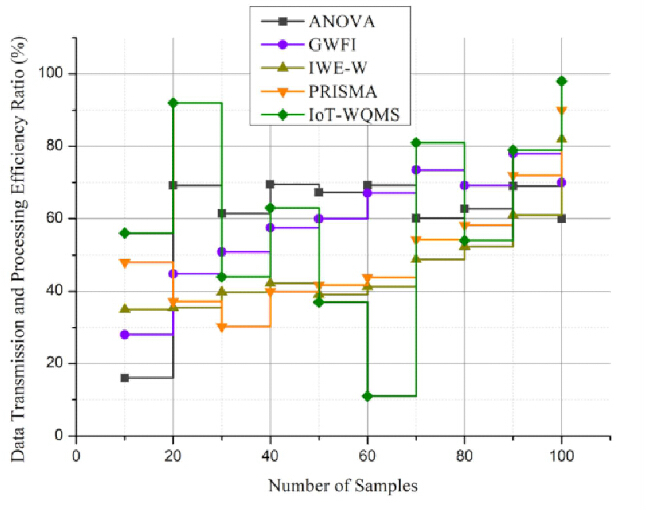
Figure 9: Data Transmission and Processing Efficiency. Comparison of computational processing and data transmission efficiency among the evaluated methods. Please click here to view a larger version of this figure.
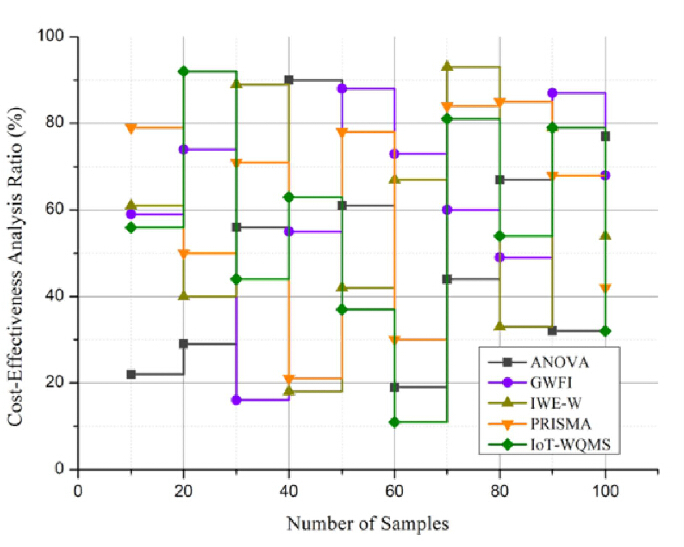
Figure 10: Cost-Effectiveness Analysis Ratio. Comparison of the estimated implementation cost and cost-effectiveness of the proposed IoT-WQMS. Please click here to view a larger version of this figure.
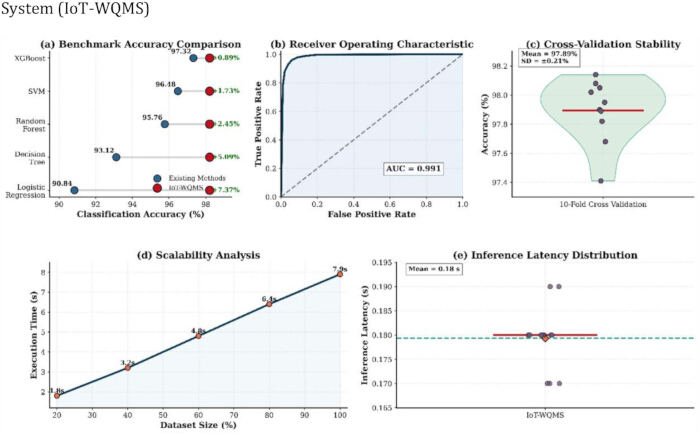
Figure 11: Performance evaluation of the proposed IoT-Enabled Water Quality Monitoring System (IoT-WQMS). Benchmark classification accuracy (a), receiver operating characteristic (ROC) analysis (b), 10-fold cross-validation stability (c), scalability analysis with increasing dataset size (d), and inference latency distribution (e) are presented to evaluate the predictive performance and computational behaviour of the framework. Please click here to view a larger version of this figure.
Discussion
This proof-of-concept computational assessment used the publicly available Kaggle Water Potability dataset; its performance is limited by the dataset's properties. The dataset includes standardized physicochemical water-quality measurements for predictive model building; however, it may not adequately capture geographical, seasonal, climatic, and contaminant variability across varied natural water bodies. When applied to geographically different contexts or continually gathered field data, prediction effectiveness may vary. Sensor calibration drift, environmental interference, biofouling, communication instability, power consumption, and hardware degradation were not experimentally quantified because the proposed IoT hardware architecture was not deployed in the real world. Using offline benchmark data instead of real-time sensor streams limited computational evaluation in dynamic environmental conditions, including missing observations, sensor failures, and variable network connectivity. The scalability investigation was limited to progressively larger datasets and does not fully characterize performance in large-scale distributed IoT installations with many sensor nodes and cloud-edge connectivity. An independent hold-out test set and 10-fold cross-validation were used to evaluate model robustness, but external validation using independent field datasets was not done, so the reported predictive performance reflects benchmark evaluation conditions rather than universal operational conditions.
The experimental results show that the IoT-Enabled Water Quality Monitoring System (IoT-WQMS) is a viable proof-of-concept framework for intelligent water quality assessment utilizing a public benchmark dataset. Cloud-assisted analytics and machine learning can reliably distinguish potable and non-potable water samples while preserving computing efficiency for near-real-time environmental monitoring. These results suggest that data-driven analytical frameworks may significantly improve the timeliness and consistency of water quality assessment compared with laboratory-based techniques that rely on periodic sampling and delayed analysis. The suggested IoT-WQMS outperformed Logistic Regression, Decision Tree, Random Forest, and Extreme Gradient Boosting in predictive performance and stability amid rising computational demands. Systematic data preparation, feature normalization, and intelligent prediction enhanced classification reliability at minimal computational cost. Scalability research shows that increasing data volume primarily affects execution time without reducing predictive performance, making the framework suitable for large-scale environmental monitoring applications. The framework provides a conceptual architecture for intelligent environmental monitoring systems, making it applicable beyond predictive modeling. Water resource surveillance, rapid identification of abnormal water quality conditions, and timely decision support for environmental agencies, water treatment facilities, industrial monitoring, and precision agriculture are enabled by low-cost sensing technologies, wireless communication, cloud-based data management, and automated prediction. This study is limited by several factors. The suggested IoT hardware design is a proof of concept, and the experimental assessment used only the publicly available Kaggle Water Potability dataset. Environmental issues such as long-term sensor calibration, communication disruptions, sensor drift, biofouling, and seasonal fluctuations were not tested. The dataset also lacks environmental measures such as dissolved oxygen and electrical conductivity, which limits computational study of these aspects. Future studies will validate the proposed architecture using real-world IoT deployments and continuous environmental data collection with integrated multi-parameter sensor devices. Further research will employ sophisticated deep learning models, adaptive anomaly detection algorithms, explainable AI, and federated learning to improve predictive generalization and model interpretability. Smart cities, industrial wastewater monitoring, precision agriculture, and environmental sustainability initiatives will benefit from edge computing, digital twin technologies, and secure distributed data-sharing mechanisms to improve scalability, reliability, and decision support for intelligent water resource management.
Figure 11 presents the comprehensive performance evaluation of the proposed IoT-Enabled Water Quality Monitoring System (IoT-WQMS). The results demonstrate that the proposed framework achieved a classification accuracy of 98.21%, outperforming the benchmark machine learning classifiers evaluated in this study. The receiver operating characteristic analysis yielded a ROC-AUC of 0.991, indicating excellent discrimination between potable and non-potable water samples. The cross-validation results further confirm the robustness and stability of the predictive model, with a mean accuracy of 97.94% ± 0.42% across ten validation folds. Scalability analysis shows that the execution time increased gradually from 1.8 s to 7.9 s as dataset utilization increased from 20% to 100%, while maintaining a classification accuracy above 97.5%. Furthermore, the average inference latency was 0.18 s per sample, demonstrating the computational efficiency of the proposed framework for near-real-time water quality assessment.
Prototype implementation of the suggested IoT architecture, using an ESP32 microcontroller, low-cost sensor modules, and cloud-based processing, costs roughly USD 65 (≈ INR 5,500), substantially less than standard laboratory-based water quality evaluation systems. Continuous monitoring and data-driven decision-making are automated using this design. The hardware cost was estimated using the cumulative market prices of commercially available components, including an ESP32 development board (USD 8.50), pH sensor module (USD 12.00), turbidity sensor (USD 9.50), DS18B20 temperature sensor (USD 3.00), 5 V power supply (USD 6.00), prototype enclosure (USD 8.00), breadboard and interconnection accessories (USD 4.00), and miscellaneous assembly components (USD 14.00).
This study presented a proof-of-concept computational framework for an IoT-Enabled Water Quality Monitoring System (IoT-WQMS) using the publicly available Kaggle Water Potability dataset. The proposed framework integrates an illustrative IoT sensing architecture, cloud-assisted data processing, and machine learning-based water potability prediction to evaluate the feasibility of intelligent computational analysis for water quality assessment. Experimental evaluation demonstrated strong predictive performance, achieving an accuracy of 98.21%, precision of 97.86%, recall of 98.04%, F1-score of 97.95%, and a ROC-AUC of 0.991. Model robustness was confirmed via 10-fold cross-validation, yielding a mean accuracy of 97.94% ± 0.42% and an average inference latency of 0.18 s per sample. Scalability analysis demonstrated stable computational performance as dataset utilization increased from 20% to 100%. These findings support the effectiveness of the proposed computational framework for machine-learning-based prediction of water potability on a benchmark dataset. The proposed IoT architecture is presented as a conceptual implementation framework and was not experimentally validated through real-world sensor deployment. Future work will focus on implementing and validating the framework using multi-sensor IoT hardware under field conditions, incorporating additional water quality parameters, and investigating advanced artificial intelligence techniques to improve predictive generalization, adaptive anomaly detection, and practical applicability for real-world water quality monitoring.
Disclosures
Conflict of interest: The authors declare no conflicts of interest.
Acknowledgements
Funding: This research received no specific grant from any funding agency in the public, commercial, or not-for-profit sectors.
Materials
| Name | Company | Catalog Number | Comments |
|---|---|---|---|
| Breadboard and Jumper Wires | Generic Electronics Supplier | MB-102 / Dupont Kit | Electrical interconnection of hardware modules |
| Cloud Computing Platform | Google Firebase | Storage, visualization, and remote access of monitoring data | |
| Data Encryption Library | OpenSSL Foundation | AES-256 Library | Secure transmission of sensor data |
| Electrical Conductivity Sensor | Measurement of water electrical conductivity | ||
| ESP32 Development Board | Espressif Systems | ESP32-WROOM-32 | Sensor interfacing, local processing, and wireless communication |
| Kaggle Water Potability Dataset | Kaggle | Water Potability Dataset | Model development, training, and performance evaluation |
| MicroSD Card Module | Generic Electronics Supplier | Catalex MicroSD Module | Temporary buffering and local storage of sensor measurements |
| pH Sensor Module | DFRobot | SEN0161-V2 | Measurement of water acidity and alkalinity |
| Pollutant Detection Sensor | Atlas Scientific | EZO Sensor Series | Estimation of pollutant concentration |
| Power Supply | Mean Well | RS-15-5 | Stable power source for the monitoring system |
| Python Programming Environment | Python Software Foundation | Python 3.11 | Data preprocessing, model development, and performance evaluation |
| Temperature Sensor | Maxim Integrated | DS18B20 | Water temperature measurement |
| Turbidity Sensor | DFRobot | SEN0189 | Water turbidity measurement |
| Visual Studio Code | Microsoft | Version 1.x | Software implementation and debugging |
| Wi-Fi Communication Module | Espressif Systems | Integrated ESP32 Wi-Fi | Wireless transmission of monitoring data |
References
- He W, et al. Reduction pathways identification of agricultural water pollution in Hubei Province, China. Ecol Indic. 2023;153:110464.
- Thakur RR, et al. Urban expansion and land use transformations in Midnapore City (2003–2024): implications for sustainable development. Earth (Basel). 2025;6(2):50.
- Atojunere EE, Senadeera W, Iji P, Jamaima L. Development of an indirect active solar heating dryer (IASHD) for dwarf Cavendish banana. Indian J Eng. 2026;23(59). https://doi.org/10.54905/disssi.v23i59.e1ije1707.
- Gopan G, Arun M, Vembu S. Comparison of dimple tube with flat plate collector for solar water heater by using carbon nanofluid. Int J Low Carbon Technol. 2025;20:820–833.
- Venkatesh R. Effect of hybrid nanofluid and polyethylene glycol/aluminium foam on thermal characteristics and energy storage performance of solar air heater. Appl Therm Eng. 2026;291:130213.
- Dixit PR, et al. Exploring seasonal changes in coastal water quality: multivariate analysis in Odisha and West Bengal coast of India. Water (Basel). 2024;16(20):2961.
- Al-Mukaram N, Al-Tuwayyij H, Musa SS. Performance assessment of sustainable pavement including glass waste powder. Indian J Eng. 2026;23(59). https://doi.org/10.54905/disssi.v23i59.e5ije1712.
- Rinesh S, et al. Prediction and classification of solar photovoltaic power generation using extreme gradient boosting regression model. Int J Low Carbon Technol. 2024;19:2420–2430.
- Hou H, Su L, Guo D, Xu H. Resource utilization of solid waste for the collaborative reduction of pollution and carbon emissions: case study of fly ash. J Clean Prod. 2023;383:135449.
- Venkatesh R. Effect of boron nitride on mechanical characteristics of LDPE nanocomposite made with ramie fiber. J Inst Eng India Ser D. Published online April 13, 2024. https://doi.org/10.1007/s40033-024-00716-6.
- Wang H, Liu C, Xiong L, Wang F. The spatial spillover effect and impact paths of agricultural industry agglomeration on agricultural non-point source pollution: a case study in Yangtze River Delta, China. J Clean Prod. 2023;401:136600. https://doi.org/10.1016/j.jclepro.2023.136600.
- Arun M, Barik D, Sridhar KP, Dennison MS. Thermal performance of a dimpled tube parabolic trough solar collector (PTSC) with SiO₂ nanofluid. Int J Photoenergy. 2022;2022:8595591. https://doi.org/10.1155/2022/8595591.
- Hassan A, et al. Statistical analysis for water quality data using ANOVA (case study—Lake Burullus influent drains). Ain Shams Eng J. 2024;15(4):102652.
- Zhang X, et al. Identify the key emission sources for mitigating ozone pollution: a case study of urban area in the Yangtze River Delta region, China. Sci Total Environ. 2023;892:164703.
- Kong Y, et al. Adaptability analysis of water pollution and advanced industrial structure in Jiangsu Province, China. Ecol Model. 2023;481:110365.
- Mmonwuba NC, et al. The effect of industrial waste effluent on water quality: a case study of Otamiri River, Owerri, Imo State. J Eng Res Rep. 2023;24(4):15–25.
- Pásková M, et al. Water pollution generated by tourism: review of system dynamics models. Heliyon. 2024;10(1). https://doi.org/10.1016/j.heliyon.2023.e23824.
- Kurniawan TA, et al. Implications of climate change on water quality and sanitation in climate hotspot locations: a case study in Indonesia. Water Supply. 2024;24(2):517–542.
- Zogaj F, et al. Assessment of groundwater quality in some regions of Kosovo based on physico-chemical and microbiological parameters. Limnol Rev. 2026;26(2):16.
- Bytyçi P, et al. Integrated water quality assessment of the Drenica River using macroinvertebrates and Promethee decision method. Biologia (Bratisl). 2026;81(6):146.
- Pati AK, et al. Irrigation water quality prognostication: an innovative ensemble architecture leveraging deep learning and machine learning for enhanced SAR and ESP estimation in the east coast of India. J Environ Chem Eng. 2025;13(3):116433.
- Barad S, et al. Hydrogeochemical and geospatial insights into groundwater contamination: fluoride and nitrate risks in Western Odisha, India. Water (Basel). 2025;17(10):1514.
- Gunaprasad K, et al. A multi-stage learning and fusion framework for water quality assessment using IoT-based sensor data [conference paper]. Presented at: 2025 5th International Conference on Mobile Networks and Wireless Communications (ICMNWC); Tumkur, India; 2025. https://doi.org/10.1109/ICMNWC66779.2025.11354450.
- Su J, Xu W, Lin Z. Algorithm for monitoring water quality parameters in optical systems based on artificial intelligence data mining. Sci Rep. 2024;14(1):28142.
- Sardar T, Mishra S, Pandey S, Khan A. Optical sensing technologies coupled with IoT for water quality assessment: a review. Appl Spectrosc Rev. Published online 2026:1–28. https://doi.org/10.1080/05704928.2026.2650190.
- Kadiwal A. Water potability [dataset]. Kaggle; [cited 2026 Aug 9]. Available from: https://www.kaggle.com/datasets/adityakadiwal/water-potability.