This cross-sectional observational study evaluated whether abdominal subcutaneous fat thickness measured on existing CT images was associated with STOP-BANG-based obstructive sleep apnea risk. No significant association was observed between CT-measured fat thickness and STOP-BANG scores.
Research Article
Computed Tomography–Measured Abdominal Subcutaneous Fat Thickness and Obstructive Sleep Apnea Risk: A Cross-Sectional Observational Study
In This Article
Summary
Abstract
This study investigated whether umbilical subcutaneous fat thickness (USFT), measured opportunistically on abdominal computed tomography (CT) images obtained for clinical indications, was associated with perioperative obstructive sleep apnea (OSA) risk assessed using the STOP-BANG questionnaire. In this cross-sectional observational study, 64 adult participants completed the STOP-BANG questionnaire, and USFT was measured on existing abdominal CT images using a standardized protocol. Associations between USFT and continuous variables were assessed using Spearman correlation, while comparisons across STOP-BANG risk categories were performed using the Kruskal–Wallis test. Exploratory logistic regression was used to assess the association between USFT and high STOP-BANG risk after adjustment for age. No significant correlation was observed between USFT and STOP-BANG score (ρ = 0.142, p = 0.264), and USFT did not differ significantly across STOP-BANG risk categories (p = 0.677). USFT was significantly higher among participants reporting snoring (p = 0.026) and showed positive correlations with body mass index (BMI; ρ = 0.663, p < 0.001) and neck circumference (ρ = 0.544, p < 0.001). USFT was not significantly associated with high STOP-BANG risk after adjustment for age. Overall, CT-measured USFT was not associated with STOP-BANG-based OSA risk in this study. Larger studies incorporating polysomnography (PSG)-confirmed OSA and adequately powered multivariable analyses are needed to determine the potential role of CT-derived adiposity measures in perioperative OSA risk assessment.
Introduction
OSA is a sleep-related breathing disorder characterized by recurrent upper airway obstruction during sleep, leading to intermittent hypoxia, hypercapnia, and sleep fragmentation1. OSA is associated with both cardiovascular and metabolic comorbidities and represents a major perioperative concern because it increases the risk of difficult mask ventilation, difficult tracheal intubation, and postoperative respiratory complications2,3. Despite its clinical relevance, OSA frequently remains unrecognized in surgical patients, making pragmatic perioperative risk stratification essential.
Obesity is a key contributor to OSA risk through mechanisms including altered upper airway mechanics, reduced pharyngeal muscle responsiveness, and inflammatory-metabolic effects related to adipose tissue dysfunction3,4. While PSG is the diagnostic gold standard, limited access, waiting times, and feasibility constraints during acute surgical admissions often necessitate the use of screening instruments rather than objective sleep testing in routine perioperative workflows1,5. Among these instruments, the STOP-BANG questionnaire is widely used because of its simplicity and high sensitivity. The score incorporates eight parameters—snoring, daytime sleepiness, witnessed apnea, hypertension, BMI, age, neck circumference, and sex—to classify patients into OSA risk categories6,7.
Umbilical subcutaneous fat thickness (USFT), as an indicator of abdominal adiposity, may influence the severity and complications of OSA through increased abdominal fat accumulation3,8. CT is a widely used method for assessing abdominal adipose tissue, providing high accuracy and reproducibility in fat measurement. Previous studies have reported strong correlations between CT-based subcutaneous and visceral fat measurements and anthropometric parameters9. However, whether opportunistically measured USFT on abdominal CT provides additional information in relation to STOP-BANG-based perioperative OSA risk stratification remains unclear.
Therefore, this study aimed to explore whether USFT measured opportunistically on existing abdominal CT images obtained for clinical indications is associated with OSA risk assessed using the STOP-BANG questionnaire in adult surgical patients. The novelty of this study lies in the use of routinely acquired abdominal CT images to quantify USFT without additional imaging exposure. We hypothesized that greater CT-measured USFT would be associated with higher STOP-BANG scores and increased OSA risk.
Protocol
This cross-sectional observational study was approved by the Ankara Bilkent City Hospital Ethical Committee (approval date: April 9, 2025; approval no.: TABED-1-25-1200). All procedures were performed in accordance with the ethical standards of the institutional and/or national research committee and the 1964 Declaration of Helsinki and its later amendments or comparable ethical standards. Informed consent was obtained from all individual participants included in the study. No participant enrollment, informed consent procedures, STOP-BANG assessments, or other study-specific data collection occurred before formal ethics committee approval.
Study Design and Participants
This study was conducted between April 10, 2025, and June 30, 2025. Adult patients (≥18 years) who underwent abdominal CT for clinical indications in the General Surgery Department were eligible for inclusion. The clinical indications for CT included abdominal pain, suspected malignancy, and trauma. STOP-BANG scores were obtained on the same day as the CT examination, ensuring that both assessments reflected the same clinical period. No additional CT imaging was performed specifically for this study. Exclusion criteria were age <18 years, pregnancy, refusal to participate, absence of suitable abdominal CT images, prior abdominal surgery that could interfere with accurate fat measurements, or incomplete clinical data. No additional imaging or diagnostic procedures were performed for study purposes; all CT examinations were obtained as part of routine clinical care. The participant screening and selection process is summarized in Figure 1.
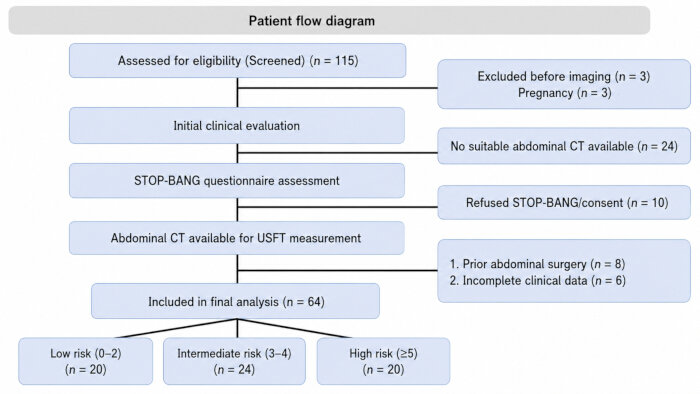
Figure 1. Patient flow diagram. The flowchart illustrates the study selection process, including the number of patients screened, reasons for exclusion, the final number of participants included in the analysis, and their distribution across STOP-BANG risk categories. The final risk groups comprised low-risk (n = 20), intermediate-risk (n = 24), and high-risk (n = 20) participants. As this is a descriptive patient flow diagram rather than a statistical data figure, error bars and statistical significance testing are not applicable. Abbreviations: USFT, umbilical subcutaneous fat thickness; n, number of participants. Please click here to view a larger version of this figure.
Clinical and Anthropometric Data
Demographic and anthropometric data, including age, sex, height, weight, BMI, and neck circumference, were recorded. Neck circumference was measured using a flexible, non-elastic measuring tape with the participant in an upright position and the head in a neutral position. The measurement was taken at the level of the laryngeal prominence (thyroid cartilage). Measurements were recorded to the nearest 0.1 cm. Three measurements were obtained, and the mean value was used for analysis. A neck circumference of >40 cm was considered positive for the STOP-BANG criterion. Hypertension status and STOP-BANG questionnaire responses were collected at the time of enrollment. The STOP-BANG score was calculated based on eight components: snoring, daytime tiredness, witnessed apnea, hypertension, BMI > 35 kg/m2, age > 50 years, neck circumference >40 cm, and male sex6,7.
CT-Based Measurement of USFT
All CT examinations were performed using a 128-slice multidetector CT scanner. The imaging parameters were as follows: tube voltage, 120 kV; automatic tube current modulation, 200–420 mA; rotation time, 0.6 s; pitch, 1.375; detector coverage, 40.0 mm; acquisition slice thickness, 3.75 mm; reconstruction slice thickness, 1.25 mm using a standard soft-tissue reconstruction kernel; and table length, 2000 mm. Measurements were performed on either non-contrast or contrast-enhanced images, as subcutaneous adipose tissue boundaries are clearly distinguishable regardless of contrast administration. Image assessments were performed using ProHIMS PACS Viewer software (version 2024.5.0) with standard abdominal soft-tissue window settings (window width, 400 HU; window level, 40 HU). To minimize interobserver variability, all image assessments were performed by a single radiologist with more than 10 years of experience in abdominal CT interpretation. Measurements were obtained from existing CT images without additional radiation exposure.
USFT was measured on axial CT slices at the level of the umbilicus. The exact umbilical level was determined by identifying the anatomical landmark of the umbilical scar on the anterior abdominal wall. Measurements were performed according to a standardized protocol by calculating the distance between the skin surface and the anterior rectus sheath (muscle fascia). As described in the earlier protocol, measurements were performed on three consecutive axial slices at this level, and the values were averaged for the final analysis.
The assessing radiologist was blinded to the participants’ STOP-BANG scores and clinical outcomes during image analysis. To evaluate intra-observer reliability, a random subset of 20 CT scans was reanalyzed by the same blinded radiologist. Reliability was assessed using the intraclass correlation coefficient (ICC). Intra-observer measurement reliability was good, with an ICC of 0.79. A representative example of the measurement technique is presented in Figure 2.
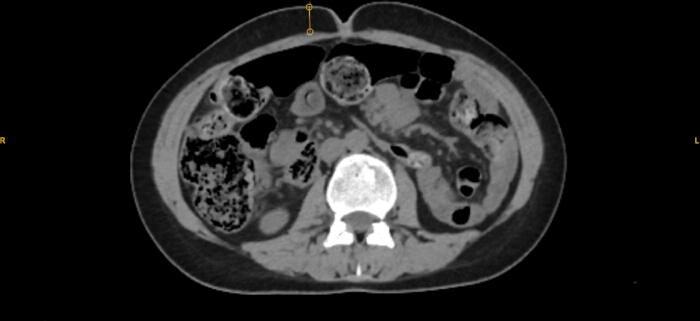
Figure 2. Representative measurement of umbilical subcutaneous fat thickness on an abdominal computed tomography image. A representative axial computed tomography (CT) image at the umbilical level demonstrates the measurement of umbilical subcutaneous fat thickness (USFT). The vertical measurement caliper indicates the perpendicular distance between the anterior skin surface and the anterior rectus sheath (muscle fascia). The image represents a single axial slice from one participant and illustrates the measurement technique only. For the study analysis, USFT was measured on three consecutive axial slices at the umbilical level, and the mean of the three measurements was used as the final USFT value. R, right; L, left; CT, computed tomography; USFT, umbilical subcutaneous fat thickness. Please click here to view a larger version of this figure.
Outcomes and STOP-BANG Risk Categorization
The primary outcome was the association between USFT and STOP-BANG score. STOP-BANG scores were analyzed both as a continuous variable and as categorical risk groups: low risk (0–2), intermediate risk (3–4), and high risk (≥5)7. The ≥5 cutoff was selected for high-risk classification because it provides higher specificity and is more strongly associated with moderate-to-severe OSA, which is particularly relevant in the perioperative setting.
Sample Size Considerations
The study sample size (n = 64) was determined based on feasibility within the study period. Given the limited prior data on the relationship between CT-derived USFT and STOP-BANG score, the study was designed as an exploratory, hypothesis-generating analysis rather than a confirmatory study powered to detect small effect sizes. Accordingly, findings were interpreted with emphasis on effect estimates and clinical relevance rather than statistical significance alone.
Statistical Analysis
Statistical analyses were performed using Python (version 3.10.12), with pandas (version 1.5.3), SciPy (version 1.10.1), and statsmodels (version 0.14.0). Matplotlib (version 3.7.1) and seaborn (version 0.12.2) were used for data visualization. The normality of continuous variables was assessed using the Shapiro–Wilk test. Variables with a normal distribution were presented as mean ± standard deviation, whereas those with a non-normal distribution were expressed as median (minimum–maximum, interquartile range [IQR]).
Group comparisons across the three STOP-BANG risk categories were assessed using the Kruskal–Wallis test. The association between USFT and individual components of the STOP-BANG questionnaire was further assessed: the Mann–Whitney U test was applied to dichotomous categorical variables, and Spearman correlation was used for continuous variables.
Logistic regression models were used to evaluate the association between USFT and high STOP-BANG-based OSA risk. The dependent variable in all models was binary high STOP-BANG risk, strictly defined as a score ≥5. Given the limited number of verified high-risk cases (n = 20), conventional multivariable logistic regression with multiple covariates was avoided to reduce overfitting. Instead, a minimal standard logistic regression model explicitly included only two independent variables: USFT and age. Furthermore, an L2-penalized (Ridge) logistic regression was performed using the same dependent and independent variables. For the penalized model, the regularization parameter (alpha) was set to 1.0 to apply a standard penalty, shrinking coefficients to prevent extreme variance. Odds ratios (ORs) with 95% confidence intervals (CIs) were calculated. A p-value <0.05 was considered statistically significant for all analyses.
Results
Study Design and Participants
During the study period, a total of 115 patients presenting with relevant clinical indications, including abdominal pain, suspected malignancy, or trauma, were screened for eligibility. Three patients were excluded because of pregnancy and did not undergo CT scanning. Of the remaining patients, 24 were excluded because a clinically suitable abdominal CT image was not available. An additional 24 patients were excluded because of refusal to participate or complete the STOP-BANG questionnaire (n = 10), prior abdominal surgery (n = 8), or incomplete clinical data (n = 6). Consequently, 64 patients were enrolled and included in the final analysis (Figure 1).
A total of 64 participants were included in the analysis, comprising 32 women (50.0%) and 32 men (50.0%). The median age was 60 years (range, 22–85 years). The mean neck circumference was 38.44 ± 2.68 cm, and the median BMI was 25.4 kg/m2 (range, 14.9–51.4 kg/m2). The median STOP-BANG score was 4 (range, 0–7), and the median USFT was 25.07 mm (range, 11.85–53.28 mm). Baseline demographic, anthropometric, and clinical characteristics are summarized in Table 1.
| Variable | N = 64 |
| Age (years), median (min–max; IQR) | 60.0 (22–85; 18.0) |
| Height (cm), mean ± SD | 166.11 ± 8.3 |
| Weight (kg), median (min–max; IQR) | 70.0 (38–145; 21.25) |
| BMI (kg/m²), median (min–max; IQR) | 25.4 (14.9–51.4; 6.95) |
| Neck circumference (cm), mean ± SD | 38.44 ± 2.68 |
| STOP-BANG score (0–8), median (min–max; IQR) | 4.0 (0–7; 3) |
| USFT (mm), median (min–max; IQR) | 25.07 (11.85–53.28; 12.22) |
| Sex, n (%) | |
| Male | 32 (50.0) |
| Female | 32 (50.0) |
| Hypertension, n (%) | |
| Yes | 28 (43.8) |
| No | 36 (56.3) |
| Snoring, n (%) | |
| Yes | 51 (79.7) |
| No | 13 (20.3) |
| Tiredness, n (%) | |
| Yes | 41 (64.1) |
| No | 23 (35.9) |
| Observed apnea, n (%) | |
| Yes | 1 (1.6) |
| No | 63 (98.4) |
Table 1: Demographic and clinical characteristics of study participants. Demographic, anthropometric, and clinical characteristics of the 64 participants included in the final analysis are presented. Continuous variables are reported as mean ± standard deviation (SD) or median (minimum–maximum; interquartile range [IQR]), as appropriate, and categorical variables are reported as number (percentage). BMI, body mass index; USFT, umbilical subcutaneous fat thickness; SD, standard deviation; IQR, interquartile range; min, minimum; max, maximum; n, number of participants.
Table 1 presents the baseline demographic, anthropometric, and clinical characteristics of the study cohort (n = 64). Categorical variables include sex and binary clinical responses (yes/no) for hypertension, snoring, daytime tiredness, and observed apnea. Normally distributed continuous variables (height and neck circumference) are presented as mean ± SD. Non-normally distributed continuous variables (age, weight, BMI, STOP-BANG score, and USFT) are presented as median (minimum–maximum; IQR). Categorical variables are presented as n (%). As Table 1 presents baseline descriptive statistics, comparative statistical tests were not performed, and p values are not applicable.
Clinical and Anthropometric Data
No statistically significant correlation was observed between STOP-BANG score and USFT (Spearman’s ρ = 0.142, p = 0.264). Similarly, USFT did not differ significantly across the low-, intermediate-, and high-risk STOP-BANG categories (Kruskal–Wallis H = 0.781, p = 0.677). The final verified risk categories comprised 20 participants (31.3%) at low risk, 24 (37.5%) at intermediate risk, and 20 (31.3%) at high risk (Figure 1 and Table 2).
| Variable | n (%) | Analysis | Median (IQR) | Test statistic | p value | Effect size |
| STOP-BANG score | 64 (100) | Spearman correlation | 4.0 (2.0–5.0) | ρ = 0.142 | 0.264 | — |
| STOP-BANG risk category | 64 (100) | Kruskal–Wallis test | — | H = 0.781 | 0.677 | — |
| Low risk (0–2) | 20 (31.3) | — | 23.7 (19.6–32.4) | — | — | — |
| Intermediate risk (3–4) | 24 (37.5) | — | 26.6 (20.4–34.8) | — | — | — |
| High risk (≥5) | 20 (31.3) | — | 25.3 (22.4–30.2) | — | — | — |
| Snoring | 64 (100) | Mann–Whitney U test | — | U = 198.0 | 0.026 | 0.278 |
| No | 13 (20.3) | — | 20.0 (16.3–27.5) | — | — | — |
| Yes | 51 (79.7) | — | 25.3 (21.2–36.1) | — | — | — |
| Tiredness | 64 (100) | Mann–Whitney U test | — | U = 471.0 | 1 | 0.001 |
| No | 23 (35.9) | — | 24.1 (20.0–32.6) | — | — | — |
| Yes | 41 (64.1) | — | 25.3 (20.9–31.3) | — | — | — |
| Hypertension | 64 (100) | Mann–Whitney U test | — | U = 497.0 | 0.93 | 0.012 |
| No | 36 (56.3) | — | 24.9 (19.9–32.6) | — | — | — |
| Yes | 28 (43.8) | — | 25.1 (21.1–30.4) | — | — | — |
| Sex | 64 (100) | Mann–Whitney U test | — | U = 546.0 | 0.653 | 0.057 |
| Female | 32 (50.0) | — | 25.1 (20.2–33.1) | — | — | — |
| Male | 32 (50.0) | — | 24.9 (20.6–29.9) | — | — | — |
| Age (years) | 64 (100) | Spearman correlation | 60.0 (52.0–70.0) | ρ = −0.067 | 0.6 | — |
| BMI (kg/m²) | 64 (100) | Spearman correlation | 25.4 (22.5–29.5) | ρ = 0.663 | <0.001 | — |
| Neck circumference (cm) | 64 (100) | Spearman correlation | 39.0 (36.8–40.0) | ρ = 0.544 | <0.001 | — |
Table 2: Statistical analysis of the associations between umbilical subcutaneous fat thickness and STOP-BANG score and its components. Associations between USFT and continuous variables were assessed using Spearman rank correlation. Differences in USFT between dichotomous groups were assessed using the Mann–Whitney U test, and differences across the three STOP-BANG risk categories were assessed using the Kruskal–Wallis test. For categorical comparisons, values in the Median (IQR) column represent USFT in millimeters; for continuous-variable analyses, values represent the corresponding variable. Statistical significance was defined as p < 0.05. BMI, body mass index; IQR, interquartile range; USFT, umbilical subcutaneous fat thickness; U, Mann–Whitney U statistic; H, Kruskal–Wallis test statistic; ρ, Spearman rank correlation coefficient; n, number of participants.
USFT was significantly higher among participants who reported snoring than among those who did not (U = 198.0, p = 0.026). In contrast, no significant associations were observed between USFT and daytime tiredness (U = 471.0, p = 1.000), hypertension (U = 497.0, p = 0.930), sex (U = 546.0, p = 0.653), or age (ρ = −0.067, p = 0.600). Positive correlations were observed between USFT and BMI (ρ = 0.663, p < 0.001) and between USFT and neck circumference (ρ = 0.544, p < 0.001). Associations between USFT and the STOP-BANG score and its components are summarized in Table 2.
Table 2 presents the statistical evaluation of the relationships between USFT and demographic, anthropometric, and clinical variables, including the overall STOP-BANG score. The total sample size was n = 64. The categorical analyses included STOP-BANG risk categories (low risk, 0–2; intermediate risk, 3–4; high risk, ≥5), binary clinical variables (yes/no for snoring, daytime tiredness, and hypertension), and sex (female/male). Observed apnea was excluded from comparative analysis because of the extreme imbalance between groups (n = 1 for “yes”). Data dispersion for non-normally distributed continuous variables is presented as median (IQR). Spearman’s rank correlation was used for continuous variables (age, BMI, neck circumference, and STOP-BANG score), the Kruskal–Wallis test was used for comparison across the three STOP-BANG risk categories, and the Mann–Whitney U test was used for dichotomous categorical variables. Effect sizes are reported where applicable. Statistical significance was defined as p < 0.05.
Outcomes and STOP-BANG Risk Categorization
Twenty participants (31.3%) were classified as being at high risk for OSA based on a STOP-BANG score ≥5. This high-risk classification is consistent with the final risk-group distribution presented in Figure 1 and Table 2.
Statistical Analysis
Given the limited number of high-risk cases, exploratory multivariable analyses were restricted to minimal age-adjusted and L2-penalized logistic regression models. In the minimal age-adjusted logistic regression model, USFT was not associated with high STOP-BANG-based OSA risk (OR = 1.00, 95% CI, 0.95–1.06; p = 0.936). The L2-penalized logistic regression model yielded a consistent result (OR = 0.98, 95% CI, 0.93–1.04; p = 0.472). Among the 64 participants, 20 (31.3%) underwent abdominal hernia surgery.
Overall, USFT was not significantly associated with the STOP-BANG score or STOP-BANG risk categories. USFT was significantly higher among participants reporting snoring and was positively correlated with BMI and neck circumference; however, it was not associated with high STOP-BANG-based OSA risk after adjustment for age in the exploratory regression analysis. These findings do not support the study hypothesis that greater CT-measured USFT would be associated with higher STOP-BANG scores and increased STOP-BANG-based OSA risk.
Data Availability:
The de-identified participant-level dataset used for the final analyses is provided with this article as Supplementary Data File 1. The study dataset and analysis code have also been deposited in Zenodo (DOI: 10.5281/zenodo.21969483); access to the deposited files is currently restricted. The supplementary dataset accompanying this article represents the final verified participant-level dataset used for the reported analyses.
Supplementary Data File 1. De-identified participant-level dataset used for the study analyses. The file contains data for the 64 participants included in the final analysis. Variables include age, sex, height, weight, body mass index (BMI), hypertension status, snoring, tiredness, observed apnea, neck circumference, the dichotomized STOP-BANG neck-circumference criterion (>40 cm), STOP-BANG score, and umbilical subcutaneous fat thickness (USFT). Binary variables are coded as indicated in the column headings. The dataset contains no missing values for the variables included in this file. Please click here to download this file.
Discussion
In this cross-sectional observational study, no statistically significant association was observed between CT-measured USFT and the STOP-BANG score or STOP-BANG-based OSA risk categories. This lack of association persisted after adjustment for age, suggesting that USFT alone may not adequately reflect OSA risk in this study population. Nevertheless, USFT was significantly associated with BMI and neck circumference, supporting its relationship with overall and upper-body adiposity. The association with snoring may also indicate a relationship between subcutaneous adiposity and individual components of OSA risk, although this finding should be interpreted cautiously. These results are consistent with the multifactorial nature of OSA, in which anatomical, metabolic, and demographic factors contribute to disease risk rather than a single measure of adiposity. This study evaluated the association between two indirect measures: CT-based subcutaneous fat thickness and a questionnaire-based OSA risk score, STOP-BANG. Therefore, the findings should be interpreted as reflecting overlap between measurement constructs rather than true disease prediction.
PSG was not performed in this study, and OSA was assessed using the STOP-BANG questionnaire. Although STOP-BANG is a widely used screening tool and may serve as a triage assessment when access to PSG is limited, it should not replace objective sleep testing. Its limited specificity may result in misclassification and weaken the observed relationship between USFT and objectively diagnosed OSA1,5,10. Thus, the present findings should be interpreted as an assessment of the cross-sectional association between USFT and STOP-BANG score rather than evidence of an association with objectively diagnosed OSA. In the present study, USFT showed strong positive correlations with BMI and neck circumference, suggesting that it may primarily reflect general obesity-related characteristics rather than having an independent association with OSA risk. Previous research has similarly reported correlations between ultrasonographically measured subcutaneous fat thickness at the neck, chest, and abdominal regions and anthropometric variables, while abdominal subcutaneous adipose tissue thickness measured 2 cm above the umbilicus and subcutaneous adipose tissue thickness measured over the second intercostal space have been associated with OSA-related risk in selected populations8.
However, the relationship between visceral and subcutaneous adipose tissue and OSA risk is not necessarily equivalent. Previous research has shown that visceral adiposity may be more closely related to OSA risk and severity, whereas subcutaneous adiposity may have a more limited role11,12. Previous evidence suggests that individuals at higher risk for OSA may exhibit greater visceral adiposity. In our study, the lack of a significant association between USFT and STOP-BANG score may therefore reflect the fact that only subcutaneous fat thickness was assessed, while visceral adiposity and fat distribution in other anatomical regions were not evaluated. BMI and neck circumference are established anthropometric parameters associated with OSA risk, with neck circumference also reported to be associated with OSA severity13,14. In our study, the strong correlations between USFT, BMI, and neck circumference suggest shared variance and possible collinearity among obesity-related measures, which may have limited the ability of USFT to provide additional information beyond established STOP-BANG components. In our study, USFT was significantly associated with snoring. However, this finding should be interpreted cautiously, as snoring is influenced by multiple factors, including upper airway anatomy, pharyngeal muscle tone, nasal resistance, and genetic predisposition. Furthermore, snoring was self-reported, which may have introduced reporting bias, and the relatively small sample size may have limited the statistical power to define the strength of this association.
Male sex is a well-established risk factor for OSA1,3. This is largely attributed to hormonal differences between men and women, which also influence patterns of fat distribution. In men, adipose tissue tends to accumulate predominantly in visceral regions, whereas women exhibit a greater proportion of subcutaneous fat deposition3,4. Consistent with these physiological differences, previous studies have reported that OSA severity is higher in men than in women with comparable BMI and waist circumference1,3. However, in our study, USFT did not differ significantly by sex. We hypothesize that this result may be explained by several factors, including the limited sample size, the fact that only subcutaneous fat thickness was measured, and the absence of visceral fat assessment, which may play a more critical role in sex-related differences in OSA severity. OSA is also recognized as an age-related sleep disorder1,3. Moreover, in individuals with higher BMI, a significant positive increase in parapharyngeal fat volume with advancing age has been reported15. Despite these findings, the lack of a statistically significant association between USFT and age in our study might be related to the fact that the measurement focused solely on subcutaneous fat at the umbilical level and to the limited sample size.
The absence of a statistically significant association between USFT and hypertension in our sample may reflect the complex nature of the relationship between obesity and hypertension described in the literature. Epidemiological evidence strongly supports obesity as a major risk factor for hypertension; however, this relationship is influenced by multiple interacting factors, including sex, demographic characteristics, genetic background, neurohormonal mechanisms, and environmental factors16. Previous studies have shown that visceral adiposity index and lipid accumulation product are associated with an increased risk of OSA and may serve as potential predictive markers17. In particular, android-type obesity, characterized by greater visceral fat accumulation, has been associated more strongly with hypertension than gynoid-type obesity16. Therefore, the lack of a significant association in our study may partly reflect the fact that we measured only subcutaneous fat thickness at the umbilical level and did not assess visceral adiposity. In obese individuals, an increase in USFT is an expected finding3. Daytime sleepiness and witnessed apneas are common symptoms in patients with OSA18,19. Therefore, we initially hypothesized that USFT would be associated with these clinical manifestations. However, our analysis revealed no significant association between USFT and daytime sleepiness. This result may be explained by the multifactorial nature of OSA symptoms, which are influenced not only by abdominal subcutaneous adiposity but also by visceral fat accumulation, upper airway anatomy, neuromuscular factors, and genetic predisposition. Additionally, subjective parameters such as daytime sleepiness are based on patient self-reporting, which may introduce heterogeneity into the measurements. The relatively small sample size of our study and the exclusive focus on umbilical subcutaneous fat measurements may also have contributed to the absence of a significant association. Previous studies have reported that visceral adipose tissue is more strongly associated with OSA, while subcutaneous fat plays a more limited role in reflecting these clinical symptoms.
The limitations of this study include the relatively small sample size and the fact that it was conducted at a single center. In addition, PSG, currently used as the gold standard for OSA diagnosis, was not performed in the present study, and the limited specificity of STOP-BANG as a screening tool may have contributed to the apparent weak relationship between USFT and OSA. Furthermore, CT measurements were limited to subcutaneous fat tissue at the umbilical level, and visceral adipose tissue or fat distribution in other body regions was not evaluated. Despite the lack of an association between USFT and STOP-BANG, opportunistic CT-based adiposity assessment may still have potential in perioperative screening research. CT-derived measures, particularly visceral adiposity, could be explored as complementary markers alongside established clinical risk factors. Further studies are needed to determine whether these measures are independently associated with OSA risk alongside conventional clinical evaluations. In conclusion, CT-measured USFT was not significantly associated with the STOP-BANG score or STOP-BANG-based OSA risk categories, and this lack of association persisted after adjustment for age. Although USFT was significantly associated with obesity-related parameters, including BMI and neck circumference, and with snoring, these findings do not establish a direct relationship between abdominal subcutaneous fat and objectively diagnosed OSA. Therefore, USFT alone does not appear to reflect STOP-BANG-based OSA risk adequately. Future studies with larger sample sizes, objective assessment of OSA using PSG, and comprehensive evaluation of visceral and subcutaneous adipose tissue distribution are warranted to clarify the potential role of CT-derived adiposity measures in OSA risk stratification.
Disclosures
Conflict of Interest:
The authors declare no conflicts of interest.
Acknowledgements
The authors acknowledge the use of OpenAI’s ChatGPT (GPT-5) for assistance with English-language editing and grammar correction during manuscript preparation. All manuscript content and scientific interpretations were reviewed and approved by the authors. No funding was received for this research.
Materials
| Name | Company | Catalog Number | Comments |
|---|---|---|---|
| 128-slice multidetector CT scanner | GE Healthcare | Revolution EVO EX/EL | RRID not available |
| Flexible measuring tape | Lufkin | 50' x 3/8 | RRID not available |
| matplotlib | Python Software Foundation | Version 3.7.1 | SCR_008624 |
| pandas | Python Software Foundation | Version 1.5.3 | SCR_018214 |
| ProHIMS PACS Viewer | ProHIMS | Version 2024.5.0 | RRID not available |
| Python | Python Software Foundation | Version 3.10.12 | SCR_008394 |
| scipy | Python Software Foundation | Version 1.10.1 | SCR_008058 |
| seaborn | Python Software Foundation | Version 0.12.2 | SCR_018132 |
| statsmodels | Python Software Foundation | Version 0.14.0 | SCR_016074 |
| STOP-BANG questionnaire | University of Toronto (Chung F. et al.) | N/A | RRID not available |
| Study Dataset and Analysis Code | Zenodo | DOI: 10.5281/zenodo.21969483 | RRID not available |
References
- Slowik JM, Sankari A, Collen JF. Obstructive sleep apnea. In: StatPearls [Internet]. StatPearls Publishing; Treasure Island (FL); 2025. Available from: https://www.ncbi.nlm.nih.gov/books/NBK459252/.
- Ojeda D, et al. STOP-BANG questionnaire as predictor of a difficult airway management during anesthesia. Rev Med Chil. 2022;150:450-457. doi:10.4067/S0034-98872022000400450.
- Bonsignore MR. Obesity and obstructive sleep apnea. Handb Exp Pharmacol. 2022;274:181-201. doi:10.1007/164_2021_558.
- Ryan S, et al. Adipose tissue as a key player in obstructive sleep apnoea. Eur Respir Rev. 2019;28:190006. doi:10.1183/16000617.0006-2019.
- Chen L, et al. Validation of the STOP-Bang questionnaire for screening of obstructive sleep apnea in the general population and commercial drivers: a systematic review and meta-analysis. Sleep Breath. 2021;25:1741-1751. doi:10.1007/s11325-021-02299-y.
- Chung F, et al. STOP questionnaire: a tool to screen patients for obstructive sleep apnea. Anesthesiology. 2008;108:812-821. doi:10.1097/ALN.0b013e31816d83e4.
- Neves Junior JAS, et al. Cutoff points in STOP-Bang questionnaire for obstructive sleep apnea. Arq Neuropsiquiatr. 2020;78:561-569. doi:10.1590/0004-282X20200086.
- Molnár V, et al. The predictive role of subcutaneous adipose tissue in the pathogenesis of obstructive sleep apnoea. Life (Basel). 2022;12:1504. doi:10.3390/life12101504.
- Pickhardt PJ, Summers RM, Garrett JW. Automated CT-based body composition analysis: a golden opportunity. Korean J Radiol. 2021;22:1934-1937. doi:10.3348/kjr.2021.0775.
- Nagappa M, et al. Validation of the STOP-Bang questionnaire as a screening tool for obstructive sleep apnea among different populations: a systematic review and meta-analysis. PLoS One. 2015;10:e0143697.
- Franco I, Reis R, Ferreira D, et al. The impact of neck and abdominal fat accumulation on the pathogenesis of obstructive sleep apnea. Rev Port Pneumol (2006). 2016;22:240-242.
- Ugur KS, et al. Subcutaneous fat tissue thickness of the anterior neck and umbilicus in patients with obstructive sleep apnea. Otolaryngol Head Neck Surg. 2011;145:505-510.
- Kollár B, et al. Anthropometric parameters and sleep apnea: correlations, and treatment implications in a sleep laboratory-based study. Bratisl Med J. 2025;126:1066-1077. doi:10.1007/s44411-025-00148-y.
- Ibrahim MIS, Mohamad H, Mohamad A, Mohamad I. Association between neck circumference and the severity of obstructive sleep apnea. Pol Ann Med. 2020;27(1):1-6. doi:10.29089/2020.20.00097.
- Gao F, et al. Upper airway morphological changes in obstructive sleep apnoea: effect of age on pharyngeal anatomy. J Laryngol Otol. 2020;134:354-361.
- Wolk R, Shamsuzzaman AS, Somers VK. Obesity, sleep apnea, and hypertension. Hypertension. 2003;42:1067-1074.
- Zhou T, et al. Association between obstructive sleep apnea and visceral adiposity index and lipid accumulation product: NHANES 2015-2018. Lipids Health Dis. 2024;23:100. doi:10.1186/s12944-024-02081-5.
- Howarth T, et al. Excessive daytime sleepiness is associated with relative delta frequency power among patients with mild OSA. Front Neurol. 2024;15:1367860. doi:10.3389/fneur.2024.1367860.
- Tang Y, et al. Prevalence of excessive daytime sleepiness (EDS) and its association with quality of life in patients with obstructive sleep apnea (OSA): data from a sleep-center in Shenzhen, a single-center cross-sectional study. J Thorac Dis. 2024;16:8216.