This randomized pilot study compares 80-ms and 15-ms intense pulsed light regimens for facial rejuvenation. Objective skin measures, patient-reported pain and satisfaction, and systematic adverse-event monitoring were used to assess efficacy and tolerability during three treatment sessions and 3-month follow-up.
Research Article
Comparison of Two Intense Pulsed Light Regimens for Facial Rejuvenation: A Randomized Controlled Study
In This Article
Summary
Abstract
Intense pulsed light (IPL) is widely used for facial rejuvenation, but comparative clinical evidence for ultra-long-pulse-duration protocols remains limited. In this randomized controlled pilot trial, 27 Chinese participants with mild-to-moderate facial photoaging received three full-face IPL sessions at 4-week intervals using either an 80-ms, higher-fluence regimen (32-50 J/cm2; n = 13) or a 15-ms, lower-fluence regimen (22–30 J/cm2; n = 14). The study compares two complete regimens rather than isolating pulse width. Wrinkle percentile, pore feature count, surface sebum, R2 elasticity, and F4 viscoelasticity were measured at baseline, after each treatment, and at 1- and 3-month follow-up. The primary 3-month ANCOVA adjusted for the outcome baseline value and age, with Holm-Bonferroni correction across five objective endpoints. The nominal between-group difference favored the 80-ms regimen for pore feature count (-264.5 features; 95% CI, -466.9 to -62.1; exact p = 0.0127), but did not remain significant after Holm correction (p = 0.0635); the other objective endpoints were also not significant after correction. Pain was lower, and satisfaction was higher with 80-ms IPL. Adverse events were mild and self-limiting, with no serious adverse events, blistering, edema, pigmentary alteration, or scarring. These exploratory findings support further adequately powered trials.
Introduction
Skin aging is an intricate biological process categorized into chronological aging and exogenous aging. Chronological aging refers to the intrinsic genetic programming of skin cells, while exogenous aging results from external environmental insults, predominantly cumulative damage from ultraviolet (UV) radiation, a process termed photoaging1,2. The clinical manifestations of facial photoaging are multifaceted, encompassing pigmentary irregularities, telangiectasia, skin roughness, fine lines, and enlarged pores3. Existing therapeutic modalities for photoaging, including chemical peels, laser therapy, and injectable agents, have been widely explored4,5,6,7. However, these interventions are frequently associated with adverse effects such as post-inflammatory hyperpigmentation, pruritus, and edema, necessitating the exploration of safer and more efficacious alternatives.
Intense pulsed light (IPL), a non-coherent, polychromatic light source with a broad wavelength spectrum (typically 500–1200 nm), has emerged as a versatile tool in dermatological practice8. IPL devices emit a wide range of wavelengths that can be absorbed by various chromophores in the skin, such as melanin, hemoglobin, and water. The therapeutic efficacy and safety of IPL are governed by the principle of selective photothermolysis, which enables targeted destruction of specific structures while minimizing collateral damage to surrounding tissues9. This technology has gained widespread application in treating diverse skin conditions, including dyspigmentation, vascular lesions, acne, and photoaging1,10.
The pulse width, defined as the duration of light emission, represents a critical parameter in IPL therapy. It directly influences the spatial and temporal distribution of light energy within the skin, thereby determining treatment depth, efficacy, and safety profile9. Conventional IPL systems typically employ pulse widths ranging from 1 to 50 milliseconds (ms). Recent technological advancements have introduced ultra-long pulse width capabilities, extending to 80 ms or even 100 ms, though standardized definitions for "long pulse width" remain elusive in the literature1. The strategic selection of pulse width according to specific dermatological concerns is paramount: superficial pigmented lesions often respond optimally to shorter pulse widths (2–10 ms), while vascular pathologies require pulse widths commensurate with vessel diameter (3–30 ms). Hair removal procedures typically necessitate longer pulse widths (10–40 ms) due to the larger size of follicular structures9.
Substantial clinical evidence supports the application of IPL in managing facial photoaging1. However, conventional pulse width configurations in standard IPL rejuvenation protocols pose elevated risks of complications, including blistering, erythema, and pigmentary alterations, particularly in individuals with darker skin phototypes8. The underlying mechanism involves rapid melanin-mediated absorption of light energy, where the energy delivery period of conventional pulse-width IPL falls short of the epidermal thermal relaxation time. This temporal mismatch precipitates abrupt temperature elevations in cutaneous tissues, compromising both treatment safety and patient comfort9.
Longer pulse durations may better accommodate the thermal relaxation behavior of deeper dermal targets, permitting more gradual heat deposition and retention in the dermis while reducing high instantaneous epidermal temperature. This is a biophysical rationale rather than a demonstrated mechanism in the present study: tissue temperatures and dermal heat retention were not measured. Technical innovations in IPL delivery systems, including sequential pulses with calibrated inter-pulse delays, can further modulate thermal deposition8,9. Notwithstanding these advancements, comparative studies examining the differential effects of ultra-long versus conventional pulse widths in facial rejuvenation remain limited1,11. The scientific community has identified an imperative to establish standardized protocols that maximize therapeutic outcomes while minimizing risks across diverse demographic populations. This study aims to address this knowledge gap through a systematic evaluation of the efficacy, safety, and patient comfort associated with long-pulse-width IPL compared to conventional pulse-width configurations in facial rejuvenation treatments. The findings are anticipated to contribute to the development of evidence-based, personalized treatment approaches in cosmetic dermatology.
This randomized controlled pilot study compared an 80-ms, higher-fluence regimen with a 15-ms, lower-fluence regimen for facial rejuvenation. The objectives were to evaluate changes in wrinkle percentile, pore feature count, surface sebum, R2 elasticity, and F4 viscoelasticity; compare treatment-related pain and satisfaction; and characterize adverse events. Comparative interpretations used ANCOVA adjusted for baseline outcome value and age, with confidence intervals and Holm-Bonferroni-adjusted p values.
Protocol
Ethics statement
This study was conducted in accordance with the Declaration of Helsinki and approved by the Ethics Committee of Wenzhou Hospital of Integrated Traditional Chinese and Western Medicine (approval number: 2024-L086). The trial was registered with the Chinese Clinical Trial Registry (registration number: CTR2400092254). All participants provided written informed consent before enrollment, including consent for standardized facial photography and publication of identifiable clinical facial images; the eyes were mosaicked in the published figures as an additional privacy safeguard. The workflow is depicted in Figure 1. The equipment, devices, and materials used in this protocol are listed in the Table of Materials.
Participant selection and randomization
Participants were recruited from the institutional database of patients seeking facial rejuvenation treatment between January 2024 and June 2024. Inclusion criteria required adults aged 23-55 years with Fitzpatrick skin types II–IV and visible facial photoaging. Exclusion criteria included sun exposure within 4 weeks, photosensitive disease, photosensitizing medication or topical retinoid use within the prior month, active skin infection, inflammatory skin disease, and pregnancy or lactation. To limit post-enrollment confounding by ultraviolet exposure, participants received the same broad-spectrum sunscreen and were instructed to use it daily and avoid new topical active treatments. Twenty-seven eligible participants were randomized to the 80-ms group (n = 13) or 15-ms group (n = 14) using computer-generated permuted blocks of four. Sequentially numbered opaque sealed envelopes maintained allocation concealment until enrollment.
Pre-treatment procedures
All participants underwent standardized facial cleansing without topical anesthesia. After retroauricular test spots were applied, the site was observed for 3–5 min for erythema and pain. Testing began at 32 J/cm2 in the 80-ms group and 22 J/cm2 in the 15-ms group. If only mild transient erythema occurred, with VAS pain ≤ 3 and no blistering or intense whitening, fluence was increased in 2 J/cm2 increments. The highest tolerable fluence producing a mild thermal response without severe pain or immediate adverse effects was used within the respective 32–50 and 22–30 J/cm2 ranges.
IPL treatment parameters and procedure
The study compared two complete IPL treatment regimens that differed in both pulse width and fluence; it was not designed to estimate an isolated pulse-width effect. The 80-ms regimen used 32–50 J/cm2 and the 15-ms regimen used 22–30 J/cm2. Both used a fixed 525-nm long-pass filter (525-1200 nm spectrum), single-pulse mode, a 2-mm layer of clear optical cooling gel, and a single non-overlapping pass with a 12 × 28 mm spot. Integrated synchronous contact sapphire cooling was used throughout. The same senior dermatologist (Y.K.; >5 years of experience with energy-based aesthetic procedures) performed all treatments. Standard post-treatment care included 15 min of cooling and daily broad-spectrum sunscreen.
Skin parameter assessment protocol
To ensure consistency in longitudinal assessment and eliminate evaluation bias, all objective skin parameter measurements and visual documentation were conducted by the same clinical research technician across all participants, who was fully certified in biophysical skin analysis and completely blinded to participants' treatment group assignments.
Biomechanical properties assessment and parameter definitions
Skin elasticity was measured with a 2-mm aperture suction probe at the forehead midline, bilateral zygomatic prominences, and bilateral masseter regions. Ten 1-second suction/1-second relaxation cycles were acquired at 450 mbar; three acquisitions per site were averaged, then the five site means were averaged to obtain one participant-level value per visit. R2 is a unitless gross-elasticity ratio (elastic recovery divided by maximum deformation); higher values indicate greater elasticity. F4 was exported by the device in mm/s and was treated in this study as a viscoelasticity index, with lower values indicating improvement. Analyses used the raw participant-level R2 and F4 values, not percentages.
Sebum production quantification and interpretation
Sebum content was quantified with a photometric sebum cassette probe at the same standardized sites after a 30-second contact. Three readings per site were averaged, then site means were averaged to obtain one participant-level value per visit. Sebum is reported in µg/cm2; lower values indicate less surface sebum. Measurements were performed at 22 ± 2 °C and 50 ± 5% relative humidity.
Standardized imaging and digital facial analysis parameters
Standardized frontal and 33° lateral images were acquired with a multispectral facial complexion analysis system under consistent positioning, lighting, and background conditions. The wrinkle outcome was a device-derived percentile on a 0–100 scale; higher values indicate fewer detected wrinkles. Pore feature count was the number of algorithm-detected pore features in the standardized region; lower values indicate improvement. The same software, capture geometry, and analysis regions were used at every visit. Image analysts were blinded to group assignment.
Anatomical and subcutaneous layer evaluation
To assess individual variation in subcutaneous tissue over bony prominences (maxilla and mandible) relative to deep-tissue sensory responses, soft-tissue thickness at the mid-cheek and lower buccal regions was evaluated during baseline 3D multispectral facial imaging and biophysical assessment. Subcutaneous thickness was estimated at standardized anatomical landmarks based on standardized cross-sectional contour mapping and high-resolution optical surface profilometry integrated into the facial analysis system. All anatomical site measurements were calibrated under standardized room conditions and evaluated by the same blinded technician.
Patient-reported outcome measures
Treatment satisfaction was assessed using a validated 5-point Likert scale (1 = very dissatisfied, 5 = very satisfied) at each follow-up visit. Pain intensity during treatment was evaluated using a digital visual analog scale (VAS: 0–10) administered immediately following each treatment session. All patient-reported outcomes were collected using standardized electronic data capture systems operating on a secure institutional database to minimize recording errors.
Safety monitoring and adverse event documentation
A comprehensive safety-monitoring protocol was used throughout the study. Erythema, edema, blistering, pigmentary change, scarring, and transient localized deep-tissue sensitivity/gum soreness were assessed and documented on a standardized adverse-event registration form. Severity, duration, and management were recorded; participants were instructed to report events between visits.
Statistical analysis plan
Analyses included all 27 randomized participants, each with complete observations at six visits. This was an exploratory pilot trial based on clinical feasibility. Continuous outcomes are summarized as mean ± standard deviation. Baseline-to-3-month within-group changes were used in paired t-tests. For each primary objective endpoint, the 3-month ANCOVA included randomized group, the corresponding baseline outcome value, and age (years) as covariates. Model-based adjusted means, standard errors, 95% confidence intervals, and exact two-sided p values are reported; differences are 80 ms minus 15 ms. Holm-Bonferroni correction controlled the family-wise error rate across wrinkle percentile, pore feature count, sebum, R2, and F4. Standardized sunscreen instructions and behavioral restrictions were used to minimize differential sun exposure, but individual ultraviolet exposure was not directly quantified. Change-score analyses were sensitivity analyses; longitudinal patterns used mixed-design repeated-measures analysis of variance with Greenhouse-Geisser correction. Patient-reported outcomes used Welch t-tests and categorical safety outcomes used Fisher exact tests.
Results
Participant demographics and baseline characteristics
All 27 randomized participants (80 ms, n = 13; 15 ms, n = 14) contributed complete data at all six visits. Mean age was 39.62 ± 9.78 years in the 80-ms group and 37.14 ± 9.31 years in the 15-ms group (p = 0.508). Twenty-five participants were female, and two were male. Baseline R2 was higher in the 80-ms group (0.721 ± 0.078 vs 0.641 ± 0.096; p = 0.023), supporting baseline-adjusted comparisons. Other objective baseline differences were not statistically significant (Supplementary Table 1).
Primary efficacy outcomes
From baseline to 3 months, the 80-ms group showed within-group improvements in wrinkle percentile, pore feature count, sebum, R2, and F4; these findings do not by themselves establish between-group superiority. In the 15-ms group, R2 improved after Holm correction, whereas the paired changes in wrinkles, pores, sebum, and F4 did not meet the adjusted threshold (Table 1 and Table 2). In the primary 3-month ANCOVA adjusted for baseline outcome value and age, the adjusted mean pore feature count was 742.0 (SE, 70.0) in the 80-ms group and 1006.5 (SE, 67.4) in the 15-ms group (difference, -264.5 features; 95% CI, -466.9 to -62.1; exact p = 0.0127; Holm-adjusted p = 0.0635). Adjusted differences were not significant after Holm correction for wrinkle percentile (difference, 9.24 points; 95% CI, -3.83 to 22.30; exact p = 0.1572; Holm-adjusted p = 0.4716), sebum (0.05 µg/cm2; 95% CI, -7.71 to 7.81; exact p = 0.9896; Holm-adjusted p = 0.9896), R2 (-0.0625; 95% CI, -0.1192 to -0.0058; exact p = 0.0322; Holm-adjusted p = 0.1287), or F4 (-0.199 mm/s; 95% CI, -0.509 to 0.112; exact p = 0.1984; Holm-adjusted p = 0.4716) (Figure 2; Table 3 and Table 4).
The longitudinal analyses showed group-by-time interactions for wrinkle percentile, pore feature count, and R2, but not sebum or F4 (Figure 3A–E; Supplementary Tables 2 and 3). These exploratory trajectories do not supersede the prespecified age- and baseline-adjusted 3-month comparisons. The baseline R2 imbalance and modest sample size warrant endpoint-specific, cautious interpretation (Supplementary Table 4).
Patient-reported outcomes
Patient-reported outcomes consistently favored 80-ms IPL. Mean post-treatment pain VAS was lower after treatment 1 (2.95 vs 4.95), treatment 2 (2.55 vs 4.65), and treatment 3 (2.15 vs 4.35) (Figure 4; Supplementary Table 5). Satisfaction was higher with 80-ms IPL at each assessed visit; at 3 months, mean satisfaction was 4.49 versus 3.50 (Figure 5; Supplementary Table 5).
Safety profile
No serious adverse events, blistering, clinically observed edema, post-inflammatory pigmentary alteration, or scarring were recorded in either group. In the 80-ms group, 6 of 13 participants (46.2%) had transient erythema, and 3 of 13 (23.1%) reported mild gum soreness or localized deep-tissue tightness. All recorded events were mild and resolved spontaneously without medical intervention. In the 15-ms group, 3 of 14 participants (21.4%) had transient erythema, and none reported gum soreness. No edema was recorded in either group. Between-group differences in gum soreness, erythema, and any adverse event were not statistically significant (Figure 6A–C; Supplementary Table 6).
Representative clinical cases
Representative VISIA images from one participant in each group illustrate changes in pore and wrinkle features across treatment and follow-up (Figure 7A–H and Figure 8A–H). Images were acquired with standardized positioning, lighting, and background; faces were additionally de-identified for publication. These images are illustrative only and were not used for inferential comparisons, which are based on complete-cohort analyses.
DATA AVAILABILITY:
The tables in this article and Supplementary Tables 1–6 are the authoritative source for all reported aggregate outcomes and figure values. Supplementary Table 7 provides the supplied de-identified participant-level source record.
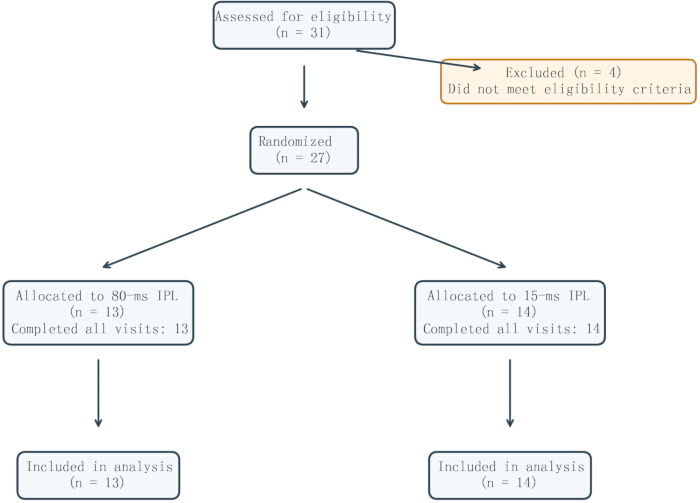
Figure 1: Participant flow. Thirty-one individuals were assessed, 4 were excluded, and 27 were randomized to 80-ms IPL (n = 13) or 15-ms IPL (n = 14). All randomized participants completed follow-up and were included in the final analysis. Please click here to view a larger version of this figure.
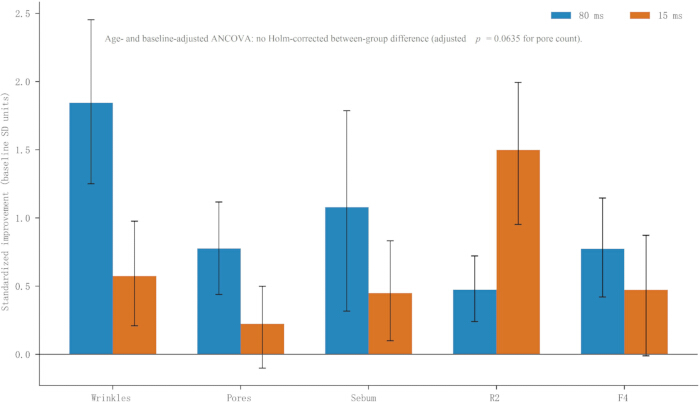
Figure 2: Direction-normalized standardized objective changes at 3 months. Bars show the mean baseline-to-3-month change, divided by the group-specific baseline standard deviation; directions were normalized so that positive values indicate improvement. Error bars are bootstrap 95% confidence intervals. The primary age- and baseline-adjusted ANCOVA did not identify a significant between-group difference in the objective endpoint (Holm-corrected). Please click here to view a larger version of this figure.
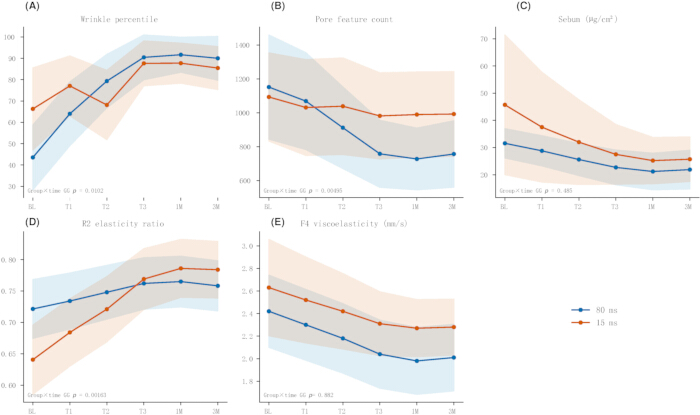
Figure 3: Objective outcome trajectories. Mean wrinkle percentile, pore feature count, sebum, R2, and F4 at baseline, after each treatment, and at 1- and 3-month follow-up. Shaded bands indicate 95% confidence intervals. Panel annotations report Greenhouse-Geisser-adjusted group-by-time p values. (A) Wrinkle percentile; (B) pore feature count; (C) sebum; (D) R2 elasticity ratio; and (E) F4 viscoelasticity. Please click here to view a larger version of this figure.
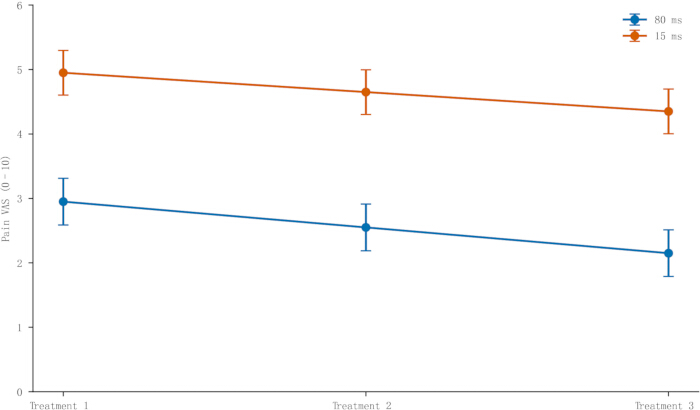
Figure 4: Post-treatment pain scores. Mean pain VAS (0–10) after each of the three treatment sessions. Error bars indicate 95% confidence intervals. Scores were lower with 80-ms IPL at all sessions (Supplementary Table 5). Please click here to view a larger version of this figure.
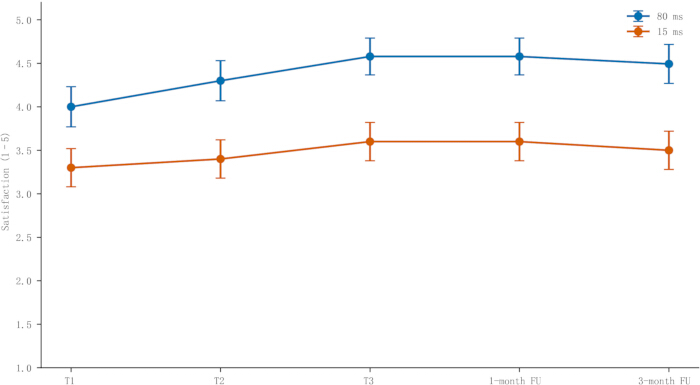
Figure 5: Patient satisfaction outcomes. Mean satisfaction scores (1–5) after each treatment and at 1- and 3-month follow-up. Error bars indicate 95% confidence intervals. Scores were higher with 80-ms IPL at every assessed visit (Supplementary Table 5). Please click here to view a larger version of this figure.
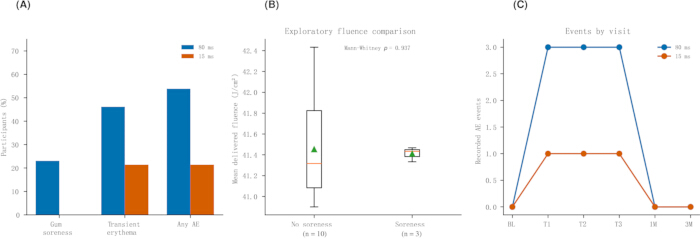
Figure 6: Safety outcomes. Participant-level incidence of gum soreness, transient erythema, and any adverse event; exploratory comparison of mean delivered fluence by gum-soreness status; and adverse-event counts by visit. No edema, blistering, pigmentary alteration, or scarring was recorded. Between-group event-rate differences were not statistically significant (Supplementary Table 6). (A) Participant-level incidence of gum soreness, transient erythema, and any adverse event; (B) exploratory mean-fluence comparison by gum-soreness status; and (C) adverse-event counts by visit. Please click here to view a larger version of this figure.
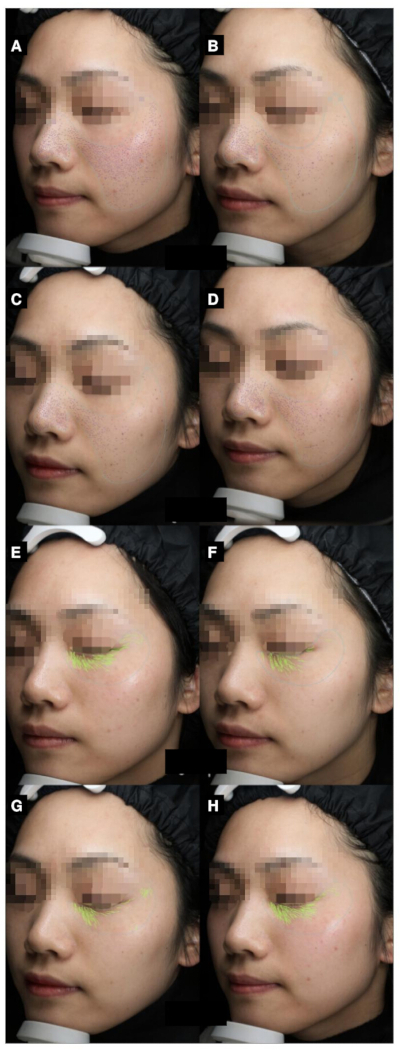
Figure 7: Representative VISIA images from the 80-ms group. Standardized images from one participant at baseline, post-treatment, 1-month, and 3-month assessments. Consistent positioning, lighting, and background were used; only the eye region is mosaicked for de-identification. Images are illustrative only. (A) Baseline left image; (B) baseline, right image; (C) post-treatment, left image; (D) post-treatment, right image; (E) 1-month follow-up, left image; (F) 1-month follow-up, right image; (G) 3-month follow-up, left image; and (H) 3-month follow-up, right image. Please click here to view a larger version of this figure.
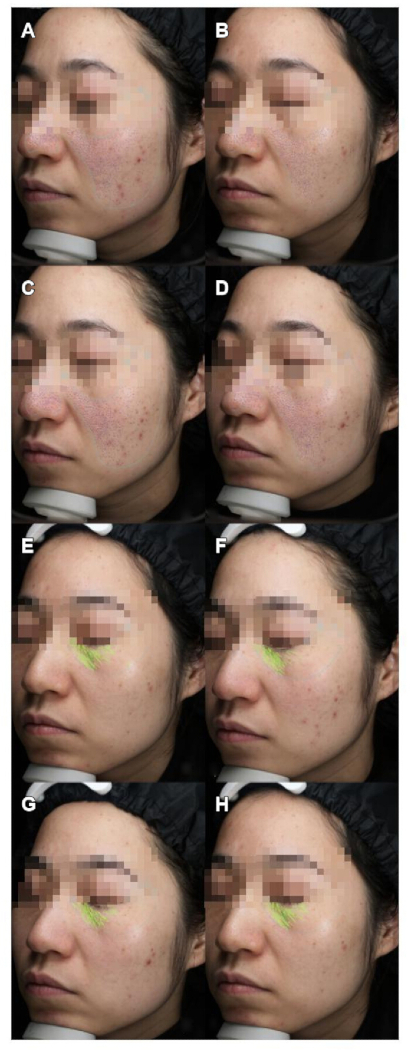
Figure 8: Representative VISIA images from the 15-ms group. Standardized images from one participant at baseline, post-treatment, 1-month, and 3-month assessments. Consistent positioning, lighting, and background were used; only the eye region is mosaicked for de-identification. Images are illustrative only. (A) Baseline left image; (B) baseline, right image; (C) post-treatment, left image; (D) post-treatment, right image; (E) 1-month follow-up, left image; (F) 1-month follow-up, right image; (G) 3-month follow-up, left image; and (H) 3-month follow-up, right image. Please click here to view a larger version of this figure.
| Outcome | Group | N | Baseline mean | Baseline SD | 3-month mean | 3-month SD | Mean change | Change SD | Paired t | df | Raw p | Holm-adjusted p | ||
| Wrinkle percentile | Experimental | 13 | 43.56 | 25.18 | 90 | 17.02 | 46.44 | 29.08 | 5.758 | 12 | <0.001 | <0.001 | ||
| Wrinkle percentile | Control | 14 | 66.29 | 33.32 | 85.43 | 17.49 | 19.14 | 25.178 | 2.844 | 13 | 0.014 | 0.055 | ||
| Pore feature count | Experimental | 13 | 1151.89 | 509.35 | 756.78 | 325.04 | -395.11 | 334.489 | -4.259 | 12 | 0.001 | 0.004 | ||
| Pore feature count | Control | 14 | 1093.36 | 451.4 | 992.71 | 433.64 | -100.65 | 267.66 | -1.407 | 13 | 0.183 | 0.183 | ||
| Sebum (ug/cm2) | Experimental | 13 | 31.56 | 8.96 | 21.89 | 11.81 | -9.67 | 12.61 | -2.765 | 12 | 0.017 | 0.017 | ||
| Sebum (ug/cm2) | Control | 14 | 45.71 | 44.51 | 25.71 | 14.23 | -20 | 32.466 | -2.305 | 13 | 0.038 | 0.115 | ||
Table 1: Within-group changes in wrinkle, pore, and sebum outcomes from baseline to 3 months. Values are mean ± standard deviation. Paired t-tests are reported with Holm-adjusted p values across the five objective endpoints.
| Outcome | Group | N | Baseline mean | Baseline SD | 3-month mean | 3-month SD | Mean change | Change SD | Paired t | df | Raw p | Holm-adjusted p | ||
| R2 elasticity ratio | Experimental | 13 | 0.721 | 0.078 | 0.758 | 0.066 | 0.037 | 0.036 | 3.678 | 12 | 0.003 | 0.006 | ||
| R2 elasticity ratio | Control | 14 | 0.641 | 0.096 | 0.784 | 0.078 | 0.143 | 0.101 | 5.327 | 13 | <0.001 | <0.001 | ||
| F4 viscoelasticity (mm/s) | Experimental | 13 | 2.42 | 0.53 | 2.01 | 0.49 | -0.41 | 0.371 | -3.986 | 12 | 0.002 | 0.005 | ||
| F4 viscoelasticity (mm/s) | Control | 14 | 2.63 | 0.74 | 2.28 | 0.43 | -0.35 | 0.65 | -2.016 | 13 | 0.065 | 0.13 | ||
Table 2: Within-group changes in R2 and F4 from baseline to 3 months. Values are mean ± standard deviation. Paired t-tests are reported with Holm-adjusted p values across the five objective endpoints.
| Outcome | Adjusted mean, 80 ms (SE) | Adjusted mean, 15 ms (SE) | Difference, 80 minus 15 (95% CI) | Exact p value | Holm-adjusted p value |
| Wrinkle percentile (points) | 92.419 (4.450) | 83.183 (4.280) | 9.236 (-3.830 to 22.303) | 0.1572 | 0.4716 |
| Pore feature count (features) | 741.978 (70.001) | 1006.454 (67.421) | -264.477 (-466.891 to -62.062) | 0.0127 | 0.0635 |
| Sebum (µg/cm²) | 23.897 (2.663) | 23.847 (2.564) | 0.049 (-7.711 to 7.809) | 0.9896 | 0.9896 |
Table 3: Age- and baseline-adjusted 3-month comparisons of wrinkle, pore, and sebum outcomes. ANCOVA estimates are adjusted for the corresponding baseline value and age. Differences are 80 ms minus 15 ms; exact and Holm-adjusted p values are reported.
| Outcome | Adjusted mean, 80 ms (SE) | Adjusted mean, 15 ms (SE) | Difference, 80 minus 15 (95% CI) | Exact p value | Holm-adjusted p value |
| R2 (ratio units) | 0.739 (0.019) | 0.802 (0.018) | -0.063 (-0.119 to -0.006) | 0.0322 | 0.1287 |
| F4 (mm/s) | 2.047 (0.107) | 2.246 (0.103) | -0.199 (-0.509 to 0.112) | 0.1984 | 0.4716 |
Table 4: Age- and baseline-adjusted 3-month comparisons of R2 and F4. ANCOVA estimates are adjusted for the corresponding baseline value and age. Differences are 80 ms minus 15 ms; exact and Holm-adjusted p values are reported.
Supplementary Table 1: Baseline characteristics. Demographic and clinical characteristics by randomized group.Please click here to download this file.
Supplementary Table 2: Longitudinal analysis. Objective-outcome analysis across all study visits.Please click here to download this file.
Supplementary Table 3: Repeated measures. Analysis of objective outcomes.Please click here to download this file.
Supplementary Table 4: Sensitivity analysis. Change-score sensitivity analyses for objective outcomes.Please click here to download this file.
Supplementary Table 5: Patient outcomes: Pain and satisfaction outcomes.Please click here to download this file.
Supplementary Table 6: Safety summary: Safety outcomes and adverse-event summary, including edema assessment.Please click here to download this file.
Supplementary Table 7: Raw dataset. De-identified participant-level source data and provenance documentation.Please click here to download this file.
Discussion
This randomized comparison does not support a claim that the 80-ms regimen is uniformly more efficacious or safer than the 15-ms regimen. Because pulse width and fluence differed together, all findings compare complete clinical regimens and cannot be attributed to pulse width alone. After adjustment for both baseline outcome value and age, no objective endpoint remained significant after Holm correction. The nominal pore-count difference and patient-reported outcomes should be viewed as exploratory signals for a larger, prespecified trial1,9,12.
The nominal pore-count result is compatible with more gradual dermal thermal deposition around the pilosebaceous unit, but the study did not measure tissue temperature, target thermal relaxation time, dermal heat retention, sebaceous-gland structure, inflammation, or microbiome changes. Mechanistic explanations are therefore hypotheses, not demonstrated causal pathways9,13,14,15,16. Wrinkle, R2, and F4 findings require particular caution. The 80-ms group had a lower baseline wrinkle percentile and higher baseline R2. ANCOVA adjusted for measured baseline values and age, but the modest sample size limited precision and could not eliminate unmeasured confounding, including individual ultraviolet exposure. The different trajectories are not evidence of the broad superiority of one regimen1,12.
Both protocols were free of serious adverse events in this cohort, but the observed mild-event rates do not establish superior safety. A previous study highlighted the necessity of explicit adverse event reporting and facial anatomical consideration in energy-based procedures12. In the present study, transient localized deep-tissue sensitivity or gum soreness occurred only with the 80-ms regimen, and erythema was numerically more frequent, although neither difference was statistically significant. This transient deep-tissue sensitivity likely reflects thermal propagation through periosteal tissues over shallow bony prominences in patients with varying facial anatomical profiles. Mean delivered fluence did not differ between participants with and without soreness within the 80-ms group; this exploratory negative result is imprecise because only three events occurred.
Combination treatments remain a direction for future research rather than an inference from the present trial. A systematic review and meta-analysis suggest that some laser combination approaches may improve rejuvenation outcomes, although protocols and evidence quality vary17. Hyaluronic acid-based mesotherapy is used for facial rejuvenation18, but its incremental benefit when combined with IPL has not been established. Other emerging strategies, including exosome-based approaches, have plausible regenerative mechanisms; however, current evidence in skin photoaging is predominantly preclinical or early-stage and requires standardized clinical trials19. Other adjunctive or comparative rejuvenation approaches, including synchronized radiofrequency and facial electrical stimulation20, retinaldehyde-based topical treatment21, shockwave-based treatment22, and bioactive peptide approaches23, require independent clinical evaluation before combination with IPL. Any combination with the IPL regimens evaluated here should therefore be tested prospectively for efficacy and safety.
This study has several limitations. It was a small exploratory pilot trial with wide confidence intervals and limited power for safety comparisons. Five correlated objective endpoints and multiple visits increased false-positive risk; Holm correction was therefore applied. ANCOVA controlled for measured baseline outcome values and age, whereas individual ultraviolet exposure was controlled by eligibility restrictions and standardized sunscreen instructions but was not directly quantified. Pulse width and fluence changed together; follow-up was limited to 3 months, the cohort was predominantly female, and representative images were not an efficacy endpoint. Larger prospectively powered trials with a prespecified primary endpoint, blinded assessment, direct exposure measurement, and longer follow-up are needed. In this exploratory randomized pilot study, the 80-ms higher-fluence regimen was associated with lower pain and higher satisfaction than the 15-ms lower-fluence regimen. Its nominal adjusted pore-count difference did not remain significant after correction for the five objective endpoints. Objective efficacy and safety findings should therefore be interpreted cautiously and confirmed in adequately powered trials.
Disclosures
Yuzhen Huang, Changhan Chen, Xiaxia Chen, Yaoyao Xie, and Youhui Ke declare that they have no competing interests.
AUTHORS’ CONTRIBUTIONS:
Yuzhen Huang contributed to conceptualization, methodology, investigation, data curation, and writing the original draft. Changhan Chen contributed to formal analysis, investigation, objective skin parameter measurements, visual documentation, and data curation. Xiaxia Chen performed all treatments. Yaoyao Xie contributed to investigation, participant recruitment, and follow-up. Youhui Ke contributed to conceptualization, supervision, methodology, and writing—review and editing.
Acknowledgements
This work was supported by the Wenzhou Key Laboratory of Laser Cosmetology, Wenzhou Hospital of Integrated Traditional Chinese and Western Medicine (grant 2022HZSY0042).
Materials
| Name | Company | Catalog Number | Comments |
|---|---|---|---|
| Adverse Event Registration Form (CRF) | Institutional Clinical Trial Unit | Adverse Event Registry | Standardized case report forms to document occurrences, severity, and duration of erythema, blistering, hyperpigmentation, scarring, and gum soreness / deep-tissue sensitivity. |
| Broad-spectrum Sunscreen | Local Commercial Source | SPF 50, PA+++ | Provided to participants for strict post-treatment daily photoprotective care. |
| Cooling Materials & Gel | Foshan Pingchuang Medical Technology Co., Ltd., Foshan, China | Pingzhichuang Photonic Cooling Gel | Applied topically during IPL treatment as an optical coupling and thermal protective medium. |
| Cutometer Probe | Courage + Khazaka Electronic GmbH, Cologne, Germany | MPA580-CUT | 2 mm standard aperture probe for skin elasticity (R2, F4) measurements. |
| Electronic Data Capture System | Microsoft Corp., Redmond, WA, USA | Excel 2019 / Institutional EDC | Secure database used to collect patient-reported outcomes (VAS and satisfaction scores) to minimize recording errors. |
| IPL Device | Cynosure, Westford, MA, USA | Icon | Total spectrum: 525-1200 nm; fixed built-in 525 nm long-pass filter; spot size 12x28 mm; max fluence 90 J/cm²; integrated synchronous contact sapphire cooling. |
| Mild Cleanser | Local Commercial Source | N/A | Used for standardized pre-treatment facial preparation without topical anesthesia. |
| Randomization Tool | Microsoft Corp., Redmond, WA, USA | Excel 2019 | Used for computer-generated sequence generation with block randomization. |
| Sebumeter Probe | Courage + Khazaka Electronic GmbH, Cologne, Germany | MPA580-SEB | Photometric cassette probe for quantifying sebum levels. |
| Semi-solid Ice Packs | Local Commercial Source | N/A | Applied for precisely 15 minutes immediately post-treatment for epidermal cooling. |
| Skin Analysis System Main Unit | Courage + Khazaka Electronic GmbH, Cologne, Germany | Multi Probe Adapter (MPA 9) | Main delivery system anchoring the biophysical probes. |
| Statistical Software | IBM, Armonk, NY, USA | SPSS Statistics 26.0 (RRID: SCR_002865) | Used for all two-tailed parametric and non-parametric statistical analyses. |
| Thermography Device | FLIR Systems, Wilsonville, OR, USA | FLIR E4 | Handheld infrared thermography device used to monitor skin temperature (15–33 °C) during immediate post-treatment ice pack application. |
| VISIA Imaging System | Canfield Scientific, Parsippany, NJ, USA | VISIA 7 | Standardized multi-spectral facial complexion analysis. |
References
- Sales AFS, Pandolfo IL, de Almeida Cruz M, Parisi JR, Garcia LA, Martignago CCS, et al. Intense pulsed light on skin rejuvenation: a systematic review. Arch Dermatol Res. 2022;314:823-838.
- Wang J, Yano S, Xie K, Ohata Y, Hara T. Genome-wide RNA sequencing analysis in human dermal fibroblasts exposed to low-dose ultraviolet A radiation. Genes (Basel). 2022;13:974.
- Fisher GJ, Kang S, Varani J, Bata-Csorgo Z, Wan Y, Datta S, et al. Mechanisms of photoaging and chronological skin aging. Arch Dermatol. 2002;138:1462-1470.
- Yaar M, Gilchrest BA. Photoageing: mechanism, prevention and therapy. Br J Dermatol. 2007;157:874-887.
- Riahi RR, Bush AE, Cohen PR. Topical retinoids: therapeutic mechanisms in the treatment of photodamaged skin. Am J Clin Dermatol. 2016;17:265-276.
- O'Connor AA, Lowe PM, Shumack S, Lim AC. Chemical peels: a review of current practice. Australas J Dermatol. 2018;59:171-181.
- Liu TM, Sun YM, Tang ZY, Li YH. Microneedle fractional radiofrequency treatment of facial photoageing as assessed in a split-face model. Clin Exp Dermatol. 2019;44:e96-e102.
- Hamilton M, Campbell A, Holcomb JD. Contemporary laser and light-based rejuvenation techniques. Facial Plast Surg Clin North Am. 2018;26:113-121.
- Lipp MB, Angra K, Wu DC, Goldman MP. Intense pulsed light: a methodical approach to understanding clinical endpoints. J Drugs Dermatol. 2021;20:203-207.
- Oh SH, et al. A comparative study of topical 5-aminolevulinic acid incubation times in photodynamic therapy with intense pulsed light for the treatment of inflammatory acne. Dermatol Surg. 2009;35:1918-1926.
- Zhu J, et al. Comparison of intense pulsed light with nonablative fractional laser and picosecond alexandrite laser with diffractive lens array for noninvasive facial rejuvenation. Lasers Surg Med. 2025;57:195-203.
- Hedelund L, Due E, Bjerring P, Wulf HC, Haedersdal M. Skin rejuvenation using intense pulsed light: a randomized controlled split-face trial with blinded response evaluation. Arch Dermatol. 2006;142:985-990. doi:10.1001/archderm.142.8.985.
- Barakat MT, Moftah NH, El Khayyat MA, Abdelhakim ZA. Significant reduction of inflammation and sebaceous glands size in acne vulgaris lesions after intense pulsed light treatment. Dermatol Ther. 2017;30:e12410.
- Podwojniak A, Tan IJ, Sauer J, Neubauer Z, Rothenberg H, Ghani H, et al. Acne and the cutaneous microbiome: a systematic review of mechanisms and implications for treatments. J Eur Acad Dermatol Venereol. 2025;39:793-805. doi:10.1111/jdv.20332.
- Huang J, Luo X, Lu J, et al. IPL irradiation rejuvenates skin collagen via the bidirectional regulation of MMP-1 and TGF-beta1 mediated by MAPKs in fibroblasts. Lasers Med Sci. 2011;26:381-387.
- Cuerda-Galindo E, Diaz-Gil G, Palomar-Gallego MA, Linares-GarciaValdecasas R. Intense pulsed light induces synthesis of dermal extracellular proteins in vitro. Lasers Med Sci. 2015;30:1931-1939.
- Pour Mohammad A, Gholizadeh Mesgarha M, Seirafianpour F, Karimi Y, Sodagar S, Afraie M, et al. A systematic review and meta-analysis of efficacy, safety, and satisfaction rates of laser combination treatments versus laser monotherapy in skin rejuvenation resurfacing. Lasers Med Sci. 2023;38:228.
- Iranmanesh B, Khalili M, Mohammadi S, Amiri R, Aflatoonian M. Employing hyaluronic acid-based mesotherapy for facial rejuvenation. J Cosmet Dermatol. 2022;21:6605-6618.
- Hajialiasgary Najafabadi A, Soheilifar MH, Masoudi-Khoram N. Exosomes in skin photoaging: biological functions and therapeutic opportunity. Cell Commun Signal. 2024;22:32.
- Manuskiatti W, et al. The efficacy and safety of synchronized radiofrequency and high intensity facial electrical stimulation in improving facial skin laxity and quality in Asians. Lasers Surg Med. 2025;57:177-186.
- Monteil C, et al. Enhancing facial rejuvenation outcomes with a novel retinaldehyde-based cream: a comparative randomized intra-individual study. J Cosmet Dermatol. 2025;24:e70555.
- Cai S, New H. Analysis of the clinical application and treatment effects of ultra-pulse shockwave technology in facial rejuvenation. Lasers Med Sci. 2025;40:131.
- Wang D, et al. Natural bioactive peptides in photoaging: multi-target mechanisms, clinical progress, and future anti-aging applications. Ageing Res Rev. 2025;102966.