This study compares the nephroprotective effects of ethanol and fomepizole in a methotrexate-pretreated rat model of methanol intoxication designed to reduce folate-dependent formate clearance. Renal outcomes were evaluated using measures of renal function, kidney injury biomarkers, inflammatory markers, redox-related biomarkers, and histopathological findings.
Research Article
Nephroprotective Effects of Ethanol and Fomepizole in a Methotrexate-Pretreated Rat Model of Methanol Intoxication
In This Article
Summary
Abstract
Methanol intoxication causes metabolic acidosis, organ injury, and death; renal injury predicts adverse outcomes. Ethanol and fomepizole were compared in a methotrexate-pretreated rat model of methanol intoxication. Thirty male Wistar rats were allocated to five groups: Control, methotrexate (MTX), MTX + Methanol, MTX + Methanol + Fomepizole, and MTX + Methanol + Ethanol (n = 6 per group). MTX was administered by oral gavage at 0.3 mg/kg/day on days 1–7. The three methanol-exposed groups received 3 g/kg methanol by oral gavage on day 8. Fomepizole was administered intraperitoneally at 15 mg/kg 4 h after methanol administration, followed by 10 mg/kg at 12, 24, and 36 h. Ethanol was administered once by oral gavage at 0.5 g/kg 4 h after methanol administration. Samples were collected on day 10. No primary outcome was prospectively designated. Renal function, kidney homogenate injury, inflammatory biomarkers, blood-derived redox-related biomarkers, and histopathological findings were assessed. Analysis of variance (ANOVA) revealed significant group differences in kidney-homogenate cystatin C (p = 0.003), interleukin-6 (IL-6; p = 0.013), kidney injury molecule-1 (KIM-1; p = 0.017), serum urea (p = 0.017), and serum creatinine (p < 0.001). Duncan post hoc testing showed lower values for these parameters in both antidote groups than in the MTX + Methanol group. No significant biochemical differences were identified between the two antidote groups. Histopathological scores were lower in the antidote groups. Although fomepizole showed a more favorable descriptive pattern, the findings do not establish its superiority over ethanol. Variance heterogeneity, multiple testing, unequal antidote regimens, the absence of toxicokinetic and acid–base measurements, and short follow-up limit interpretation. Future studies should include direct measurements of methanol and formate, renal cytosolic alcohol dehydrogenase activity, correlations with renal biochemical outcomes, longer follow-up periods, and comparable antidote regimens.
Introduction
Methyl alcohol (methanol) poisoning is a major toxicological emergency associated with substantial morbidity and mortality worldwide, particularly following the consumption of illicit or illegally produced alcoholic beverages. Although methanol itself has relatively low toxicity, it is predominantly metabolized in the liver by alcohol dehydrogenase (ADH) to formaldehyde and subsequently to formic acid; the resulting accumulation of formate can cause high-anion-gap metabolic acidosis, optic neuropathy, and multiorgan injury1,2. Formaldehyde is a short-lived intermediate, whereas formate accumulation is considered the primary contributor to toxicity via inhibition of mitochondrial cytochrome oxidase, cellular hypoxia, and oxidative stress 3. Early diagnosis, correction of metabolic acidosis, antidotal therapy, and hemodialysis are the main therapeutic approaches for reducing mortality2.
In methanol intoxication, clinical manifestations typically become evident after a latent period. Nausea, vomiting, abdominal pain, and mild central nervous system depression may be followed by high-anion-gap metabolic acidosis, dyspnea, altered mental status, and visual symptoms1,2. Visual blurring, photophobia, mydriasis, optic disc edema, and, in severe cases, permanent blindness are among the most characteristic toxic effects associated with formic acid-mediated inhibition of mitochondrial cytochrome oxidase1,2. Current treatment strategies include supportive care; correction of metabolic acidosis with sodium bicarbonate; folinic or folic acid supplementation; inhibition of alcohol dehydrogenase with ethanol or fomepizole; and, in selected severe cases, hemodialysis to accelerate the elimination of methanol and formate3,4. Fomepizole is increasingly regarded as a first-line antidote because of its more predictable pharmacokinetics, simpler dosing, and lower risk of adverse effects; however, ethanol remains an important alternative because of its availability and lower cost4,5,6,7.
Although optic nerve and central nervous system injury have traditionally been regarded as the predominant manifestations of methanol toxicity, the kidney has increasingly been recognized as a clinically relevant target organ8,9,10. In methanol-specific cohorts, acute kidney injury (AKI) has been associated with more severe metabolic acidosis, respiratory failure, multiple organ failure, mechanical ventilation, extracorporeal treatment, longer hospitalization, and higher in-hospital mortality; volume depletion, sepsis, rhabdomyolysis, and acute pancreatitis have also been identified as factors associated with AKI development8,10. In the cohort reported by Chang et al., AKI remained independently associated with in-hospital mortality in a multivariable analysis; however, the retrospective observational design does not establish that AKI itself caused mortality8. Accordingly, AKI should be interpreted as a marker of greater illness severity and a worse prognosis in methanol intoxication. By contrast, the systematic review by Wang et al. evaluated kidney outcomes after toxic alcohol poisoning more broadly, principally methanol and ethylene glycol; therefore, its conclusions are not exclusively methanol-specific9. That review identified substantial short-term mortality and important evidence gaps concerning long-term kidney recovery, ongoing dialysis, and standardized renal outcome reporting9.
The relationship between methanol toxicity and AKI is likely multifactorial. Toxic metabolite accumulation may contribute through mitochondrial inhibition, cellular hypoxia, severe metabolic acidosis, and redox imbalance, whereas systemic factors documented in clinical cohorts—including volume depletion, hemodynamic compromise, rhabdomyolysis, sepsis, respiratory failure, and multiple organ dysfunction—may provide additional renal insults1,2,3,8,10. These pathways provide biologically and clinically plausible links between methanol poisoning and renal injury. Renal metabolic disturbances may result from exposure to circulating formate, mitochondrial inhibition, metabolic acidosis, and systemic hemodynamic stress. However, the specific contribution of alcohol and aldehyde metabolism within renal tissue remains uncertain because methanol, formaldehyde, and formate concentrations, renal ADH activity, and mitochondrial function were not directly assessed in the present study.
A major methodological challenge in experimental studies of methanol toxicity is that rats metabolize formic acid more rapidly than humans. Although formic acid accumulation is a principal determinant of methanol toxicity in humans, achieving comparable accumulation and consequent organ injury in rats is more difficult due to their highly efficient folate-dependent formate metabolism. Therefore, agents that suppress folate metabolism are frequently used in experimental models of methanol toxicity11,12. Methotrexate (MTX) pretreatment was used to reduce folate-dependent formate clearance in rats, thereby increasing susceptibility to methanol toxicity11,12. Methotrexate does not itself induce methanol toxicity, and the resulting model does not reproduce all aspects of human methanol poisoning. Because methotrexate may independently influence renal, oxidative, and inflammatory outcomes, an MTX-only group was included to characterize changes associated with pretreatment. Within these limitations, the model provides a controlled preclinical platform for comparing renal outcome patterns among experimental groups receiving the same methotrexate pretreatment and methanol exposure protocol and for evaluating these outcomes at biochemical, inflammatory, oxidative, and histopathological levels.
Inhibition of alcohol dehydrogenase constitutes the cornerstone of antidotal treatment for methanol intoxication. The two agents most commonly used for this purpose in clinical practice are ethanol and fomepizole (4-methylpyrazole). Ethanol competitively suppresses toxic metabolite formation because of its higher affinity for ADH than methanol, whereas fomepizole, a potent and selective ADH inhibitor, directly prevents the conversion of methanol to formaldehyde and formic acid5,6. However, no complete consensus exists regarding the comparative clinical efficacy, safety, ease of administration, and organ-protective effects of these two antidotes. Fomepizole is considered advantageous in many centers because of its standardized dosing regimen, lack of requirement for serum level monitoring, absence of central nervous system depression, and more predictable pharmacokinetic properties, whereas ethanol therapy is associated with potential disadvantages, including hypoglycemia, hepatotoxicity, altered mental status, and the need for intensive monitoring6,7. Conversely, large-scale clinical comparisons have suggested that the effects of the two antidotes on mortality and clinical outcomes may be similar. In the study by Zakharov et al., which evaluated mass poisoning cases, no significant difference in survival was observed between fomepizole and ethanol5.
Despite the prognostic importance of AKI in methanol poisoning8,9,10, renal injury has received substantially less attention than ocular and neurological toxicity, and the comparative renal effects of ethanol and fomepizole remain insufficiently characterized. A kidney-focused evaluation incorporating conventional renal function tests, early tubular injury biomarkers, inflammatory cytokines, redox-related parameters, and histopathology is therefore warranted to determine whether the two antidotal strategies are associated with different renal outcome patterns. In addition, this controlled methotrexate-pretreated rat model may facilitate the preclinical evaluation of candidate antidotal, kidney-directed, and supportive interventions under defined experimental conditions. The research value of this model lies in comparative assessment within an acute experimental setting rather than in direct replication of the clinical and metabolic complexity of human methanol poisoning.
Differences in methanol metabolism between rodents and humans, together with the use of pharmacological pretreatment to reduce folate-dependent formate clearance, remain important methodological limitations. Moreover, acute toxicity induced under experimental conditions may not fully reflect the varying exposure durations and comorbid conditions encountered in clinical practice. Accordingly, findings from this animal model should be regarded as preliminary preclinical evidence and should not be used directly to support treatment decisions in humans. Confirmation in appropriately designed clinical studies is required before clinical inferences can be made. Against this background, the key knowledge gap is whether ethanol and fomepizole are associated with different renal outcome patterns across conventional renal function measures, tubular injury biomarkers, inflammatory cytokines, redox-related parameters, and histopathology in a methotrexate-pretreated rat model. The study hypothesis was that inhibition of alcohol dehydrogenase with either ethanol or fomepizole would be associated with attenuation of renal injury, with potential differences between the treatments across the evaluated outcome domains. Nephroprotection was defined operationally as a more favorable pattern of renal outcomes than in the MTX + Methanol group. This pattern comprised lower serum urea and creatinine concentrations; lower renal levels of kidney injury molecule-1 (KIM-1), cystatin C, tumor necrosis factor-alpha (TNF-α), interleukin-6 (IL-6), and interleukin-1 beta (IL-1β); lower serum malondialdehyde (MDA) concentrations; higher serum superoxide dismutase (SOD) activity, blood reduced glutathione (GSH) levels, and blood catalase (CAT) activity; and lower histopathological scores for tubular degeneration, tubular necrosis, glomerular injury, vascular congestion, interstitial inflammation, and fibrosis. Nephroprotection was not calculated as a single composite score; instead, individual outcomes were evaluated collectively across these complementary domains. Accordingly, the study aimed to compare the effects of ethanol and fomepizole on renal function, tubular injury, inflammation, redox status, and renal histopathology in this model.
Protocol
All experimental procedures were approved by the Kırşehir Ahi Evran University Animal Experiments Local Ethics Committee (approval decision no. 1, meeting no. 12, approval date: June 12, 2025) and were conducted in accordance with national and international guidelines for the care and use of laboratory animals. Measures were taken throughout the study to minimize pain and distress and to use the fewest animals necessary.
Preparation of chemicals
Methotrexate was used as a pretreatment agent to facilitate the establishment of the experimental methanol toxicity model. Because folate-dependent formate oxidation was more efficient in rats than in humans, methotrexate pretreatment was used to reduce formate clearance and increase susceptibility to methanol toxicity; it was used as a model-sensitizing intervention rather than as a surrogate for methanol exposure11,12. Methotrexate was supplied as a 500 mg/5 mL formulation, corresponding to a stock concentration of 100 mg/mL. The formulation was diluted with sterile 0.9% sodium chloride solution to obtain a final working concentration of 0.06 mg/mL. The working solution was administered by oral gavage at 5 mL/kg, corresponding to an MTX dose of 0.3 mg/kg. For rats weighing 200–220 g at study initiation, the daily administration volume ranged from 1.00 to 1.10 mL per animal and was calculated individually using the body weight recorded at study initiation. Body weight was not remeasured during the 7-day MTX pretreatment period. Methotrexate was administered once daily for 7 consecutive days (study days 1–7), and methanol was administered on study day 8 after completion of the MTX pretreatment protocol. This regimen was consistent with previously published oral-gavage MTX pretreatment models13.
Methanol (≥99.8% purity) was freshly prepared on the day of administration as a 20% (v/v) aqueous working solution by dilution with sterile distilled water. The working solution was prepared by mixing 1 volume of methanol with 4 volumes of sterile distilled water. In accordance with previously described methotrexate-pretreated rat models of methanol intoxication, a single dose of methanol was administered to Groups 3–5 on study day 8 at 3 g/kg by oral gavage. No food or water restrictions were imposed before methanol administration. The required administration volume was calculated individually based on each animal's body weight and was approximately 18.9 mL/kg for the 20% methanol solution. For a rat weighing approximately 220 g, this dose corresponded to 0.66 g of methanol and a final gavage volume of approximately 4.2 mL. This methanol exposure regimen was selected to maintain comparability with previously published methotrexate-pretreated rat models of acute methanol toxicity13,14,15.
The fomepizole working solution was prepared in sterile 0.9% sodium chloride solution at a final concentration of 10 mg/mL. An intraperitoneal loading dose of 15 mg/kg was administered 4 h after methanol administration, followed by intraperitoneal maintenance doses of 10 mg/kg at 12, 24, and 36 h. At the 10 mg/mL working concentration, the administration volumes were 1.5 mL/kg for the loading dose and 1.0 mL/kg for each maintenance dose. For a rat with a study-initiation body weight of approximately 220 g, these doses corresponded to approximately 0.33 mL for the loading dose and 0.22 mL for each maintenance dose. All administration volumes were calculated using the body weight recorded at study initiation. The fomepizole loading and maintenance doses were selected with reference to established methanol poisoning treatment recommendations1,6.
Ethanol was used as the antidotal comparator treatment. Absolute ethanol (≥99.8% purity) was diluted with sterile distilled water by mixing 1 volume of absolute ethanol with 4 volumes of sterile distilled water to obtain a final 20% (v/v) aqueous working solution. A single dose of ethanol was administered by oral gavage at 0.5 g/kg 4 h after methanol administration; no maintenance ethanol doses were administered. The administration volume was approximately 3.2 mL/kg. For a rat with a study-initiation body weight of approximately 220 g, this corresponded to a final gavage volume of approximately 0.70 mL. The administration volume was calculated using the body weight recorded at study initiation. The ethanol concentration, dose, route, and timing of administration were selected based on previously published methotrexate-pretreated rat models using ethanol as an antidotal comparator13,14.
All solutions were freshly prepared on the day of administration and were inspected for homogeneous appearance and the absence of visible particulate matter. Oral administrations were performed using a stainless-steel gavage cannula. During gavage, the cannula was carefully advanced from the oral cavity into the esophagus, and regurgitation, oral leakage, aspiration, and respiratory distress were avoided. Intraperitoneal injections were performed under aseptic conditions using sterile disposable syringes and needles. All procedures related to the preparation and administration of chemicals were conducted in accordance with institutional laboratory safety regulations.
Experimental animals, housing conditions, and randomization
A total of 30 adult male Wistar albino rats, aged 8–12 weeks and weighing 220 ± 20 g, were obtained from the Experimental Animal Research Laboratory of Ahi Evran University, Kırşehir, Türkiye. Wistar rats were selected because they had been widely used in experimental toxicity and nephroprotection studies and allowed comparison with previously published studies. The animals were housed at 24 ± 2 °C under a 12-h light/12-h dark cycle. Standard pellet chow and tap water were provided ad libitum throughout the 10-day experimental period. Before the experimental procedures, all animals underwent a 7-day acclimatization period.
Thirty rats were allocated to five experimental groups using a computer-assisted random allocation procedure, with a target of six animals per group. For each rat, a random integer between 1 and 5 was generated, and the animal was assigned to the corresponding experimental group. Once a group contained six animals, any subsequent draw identifying that group was discarded, and a new random number was generated until a group with an available position was selected. This procedure continued until all 30 rats had been allocated, resulting in 6 animals per group. The same researcher generated the random assignments and implemented allocation; no separate allocation operator was used. Group 1 (Control) received no experimental drug treatment, and animals underwent the same scheduled endpoint sampling as the other groups. Group 2 (MTX) received methotrexate by oral gavage at 0.3 mg/kg for 7 days. Group 3 (MTX + Methanol) received methotrexate for 7 days, followed by methanol at 3 g/kg on study day 8. Group 4 (MTX + Methanol + Fomepizole) received methotrexate pretreatment followed by methanol, with 4-methylpyrazole treatment initiated 4 h later. Group 5 (MTX + Methanol + Ethanol) received methotrexate pretreatment followed by methanol, with ethanol administered 4 h later.
All three methanol-exposed groups received the same MTX pretreatment and methanol administration protocol and differed only with respect to post-exposure antidotal treatment. The experimental group allocation, administration protocol, timing of antidotal treatment, and sample collection process were summarized in Figure 1. An a priori power analysis was performed for a fixed-effects one-way ANOVA with five independent groups. Assuming a large standardized effect size (Cohen’s f = 0.70), a significance level of 0.05, and 80% statistical power, the minimum required total sample size was calculated as 30 animals, corresponding to six animals per group. The calculated power for a total sample size of 30 was approximately 80.9%. The assumed effect size (Cohen’s f = 0.70) was specified before the experiment based on the investigators’ expectation of a large overall between-group effect in this acute toxicity model. This assumption was based on the investigator's judgment rather than an estimate derived from pilot data or a specific previous study. No single primary outcome was prospectively designated for this study; the sample size calculation was based on an assumed large overall effect in an omnibus comparison among the five experimental groups. A primary outcome cannot be retrospectively designated as a prospectively specified endpoint. Accordingly, the sample size calculation does not provide adequate power for each individual outcome or for pairwise comparisons.
Methanol intoxication and antidotal treatment protocol
After the acclimatization period, animals in Groups 2–5 received methotrexate once daily for 7 consecutive days (study days 1–7). On study day 8, animals in Groups 3–5 received a single dose of 20% methanol solution at 3 g/kg by oral gavage. No fasting or other food or water restrictions were imposed before methanol administration.
In the MTX + Methanol + Fomepizole group, an intraperitoneal loading dose of 15 mg/kg was administered 4 h after methanol administration, followed by intraperitoneal maintenance doses of 10 mg/kg at 12, 24, and 36 h after methanol administration. In the MTX + Methanol + Ethanol group, a single dose of ethanol was administered by oral gavage at 0.5 g/kg 4 h after methanol administration; no maintenance ethanol doses were administered. The two antidotal regimens were selected to reflect established fomepizole dosing recommendations and previously published ethanol comparator protocols1,6,13,14. The regimens were not designed to provide dose-, route-, or exposure-matched treatment. Therefore, the repeated intraperitoneal fomepizole regimen and the single oral ethanol dose constituted an unequal pharmacologic comparison. Successful gavage administration was confirmed by the absence of regurgitation, oral leakage, or respiratory distress during the procedure. Successful intraperitoneal administration was confirmed by the absence of leakage, bleeding, or marked swelling at the injection site.
After administration, the animals were regularly monitored for general health status, mobility, food intake, posture, fur appearance, and signs of toxicity. The treatment schedule was designed to allow initiation of toxic metabolite formation from methanol while enabling evaluation of the protective and therapeutic effects of the antidotal agents.
Euthanasia, humane endpoints, and sample collection
Throughout the experiment, all animals were evaluated daily for general health status, food and water intake, mobility, and behavioral changes. Humane endpoint criteria were predefined as marked lethargy, inability to consume food or water, severe weight loss, restricted mobility, abnormal posture, persistent piloerection, or evident signs of distress. Animals meeting any of these criteria were planned to undergo humane euthanasia. However, no animal reached the predefined humane endpoint criteria during the study.
All animals in the five experimental groups were euthanized on study day 10. For the MTX + Methanol, MTX + Methanol + Fomepizole, and MTX + Methanol + Ethanol groups, this endpoint corresponded to 48 h after the single methanol administration on study day 8. The Control group remained untreated until study day 10, whereas the MTX-only group was monitored until study day 10 after completion of the 7-day MTX administration protocol. Thus, all five groups had the same total study duration and underwent euthanasia and sample collection on the same study day.
Ketamine and xylazine were used to induce deep anesthesia. The depth of anesthesia was confirmed by loss of the pedal withdrawal reflex. After deep anesthesia was achieved, blood samples were collected by intracardiac puncture. Approximately 3–5 mL of blood was obtained using an appropriate syringe and needle. Blood collected for measurement of serum urea and creatinine concentrations, serum SOD activity, and serum MDA concentration was transferred into anticoagulant-free tubes and allowed to clot completely. Blood intended for measurement of GSH level and CAT activity was collected separately into tubes containing ethylenediaminetetraacetic acid (EDTA) and was processed without a clotting step. After complete clot formation, serum samples were centrifuged at 3,000 × g for 10–15 min at 4 °C. The separated serum was stored at −80 °C until analysis. Successful serum separation was confirmed by a clear, non-hemolyzed appearance. After blood collection, euthanasia was completed by exsanguination under deep anesthesia. A median laparotomy was then performed, and both kidneys were carefully removed. After the surrounding fat and connective tissues were removed, the kidneys were rinsed with cold physiological saline. Tissue samples were divided for histopathological and biochemical analyses. Samples allocated for histopathological examination were placed in 10% neutral-buffered formaldehyde. Samples allocated for biochemical analyses were appropriately labeled and stored at −80 °C.
Sample collection, biochemical analyses, and outcome assessments were performed by researchers blinded to the experimental groups. No animals were excluded from the analyses.
Biochemical analyses
Serum urea concentration was measured using an enzymatic urease–glutamate dehydrogenase kinetic assay on an automated biochemistry analyzer. Urea was hydrolyzed by urease to produce ammonia, which subsequently reacted with 2-oxoglutarate and reduced nicotinamide adenine dinucleotide (NADH) in the presence of glutamate dehydrogenase. The decrease in absorbance resulting from NADH consumption was measured kinetically. Serum creatinine concentration was measured colorimetrically using the same automated biochemistry analyzer.
Serum superoxide dismutase (SOD) activity was determined using a colorimetric assay based on superoxide radical generation by the xanthine–xanthine oxidase system and its reaction with 2-(4-iodophenyl)-3-(4-nitrophenyl)-5-phenyltetrazolium chloride to form a colored formazan product. Endpoint absorbance was measured at 505 nm. Serum malondialdehyde (MDA) concentration was determined using the thiobarbituric acid reaction. Serum samples were mixed with cold trichloroacetic acid to precipitate proteins and were centrifuged at 7,500 × g for 5 min at 4 °C. The resulting supernatant was mixed with an equal volume of thiobarbituric acid and incubated at 90 °C for 60 min. The reaction tubes were then cooled in a cold-water bath for 10 min, and absorbance was measured at 532 nm. MDA concentrations were calculated from the corresponding calibration curve. Reduced glutathione (GSH) was measured in EDTA-anticoagulated blood using a modified Ellman method. Following protein precipitation with trichloroacetic acid, the deproteinized samples were reacted with 5,5′-dithiobis(2-nitrobenzoic acid) in 500 mM Tris buffer at pH 8.2, and absorbance was measured at 412 nm. Catalase (CAT) activity was measured in EDTA-anticoagulated blood using a two-step colorimetric assay. Samples were incubated with a known amount of hydrogen peroxide, and after the enzymatic reaction was terminated, residual hydrogen peroxide was measured using a chromogenic reagent at 405 nm.
Because SOD activity and MDA concentration were measured in serum, and GSH level and CAT activity were measured in EDTA-anticoagulated blood rather than kidney tissue homogenates, normalization of these redox-related parameters to tissue total protein concentration was not applicable. For interpretation of the redox-related biomarker profile, higher serum MDA concentrations were considered consistent with greater lipid peroxidation, whereas lower serum SOD activity, blood GSH levels, and blood CAT activity were considered indicative of reduced antioxidant capacity; changes in the opposite direction were interpreted as a more favorable redox-related profile.
For renal tissue enzyme-linked immunosorbent assay (ELISA) measurements, approximately 50 mg of kidney tissue stored at −80 °C was homogenized on ice in 500 µL of homogenization buffer containing a protease inhibitor cocktail, corresponding to a fixed tissue-to-buffer ratio of 1:10 (w/v). One animal-specific renal tissue homogenate was prepared for each rat. Samples from different animals were processed independently and were not pooled at any stage. The homogenates were centrifuged at 14,000 × g for 10 min at 4 °C, and the supernatant obtained from each animal was collected separately and divided into aliquots for the planned renal tissue analyses. Total protein concentration was not measured separately; therefore, tissue ELISA results were not normalized to it. Final concentrations calculated from the corresponding assay-specific standard curves were expressed as ng/L for TNF-α and IL-6 and as ng/mL for IL-1β, KIM-1, and cystatin C.
Kidney injury molecule-1 (KIM-1) and cystatin C were evaluated as renal injury biomarkers, whereas tumor necrosis factor-α (TNF-α), interleukin-6 (IL-6), and interleukin-1β (IL-1β) were evaluated as renal inflammatory markers. All five analytes were measured in kidney tissue homogenates using rat-specific ELISA kits according to the manufacturers’ protocols. For the respective assays, the analytical sensitivities and measurement ranges were 2.51 ng/L and 5–1,000 ng/L for TNF-α, 0.052 ng/L and 0.1–40 ng/L for IL-6, 0.08 ng/mL and 0.2–60 ng/mL for IL-1β, 0.01 ng/mL and 0.05–10 ng/mL for KIM-1, and 0.25 ng/mL and 0.5–100 ng/mL for cystatin C, respectively. Before analysis, all reagents, standards, and renal tissue supernatants were brought to room temperature. Standard curves were generated separately for each assay run according to the manufacturer’s recommendations. Standards and renal tissue supernatants were added to antibody-precoated wells, followed by the corresponding biotinylated detection antibody and streptavidin-horseradish peroxidase conjugate. Samples and ELISA reagents were incubated for 1 h at 37 °C. After five washing cycles using an automated microplate washer, substrate solutions A and B were added and incubated for 10 min at 37 °C. The color reaction was terminated using an acidic stop solution, and absorbance was measured at 450 nm. For each analyte, blank-corrected absorbance values were converted to concentrations using the corresponding assay-specific standard curve.
All biochemical analyses were performed under standardized conditions, and all samples were processed using the same procedures. Renal tissue ELISA measurements were performed in duplicate. For each analyte, the mean of the two technical replicate wells was calculated to obtain a single animal-level value. Technical replicate wells and separate aliquots obtained from the same animal-specific homogenate were not considered independent observations. The individual animal was considered the experimental unit, and one animal-level result for each parameter was included in the statistical analysis.
Histopathological processing and renal injury scoring
Tissue samples were processed for microscopic evaluation using standard histopathological procedures. Kidney tissues were fixed in 10% neutral-buffered formaldehyde at room temperature for 72 h. After fixation, the tissues were dehydrated through graded ethanol concentrations of 50%, 70%, 80%, 96%, and 100%, with each concentration maintained for 1 h. Subsequently, the tissues were cleared using a two-step xylene procedure and embedded in paraffin blocks. Sections 5 µm thick were obtained from the paraffin blocks using a rotary microtome.
For hematoxylin and eosin staining, sections were deparaffinized and rehydrated, stained with hematoxylin for 5 min, and washed under running tap water for 5 min. Differentiation was performed using acid alcohol, after which the sections were maintained in ammonia water for 1 min. The sections were then counterstained with eosin for 2 min. Subsequently, the sections were dehydrated through an ascending alcohol series, cleared in xylene, and mounted with an appropriate mounting medium.
For Masson’s trichrome staining, sections were deparaffinized and rehydrated, then incubated in a mordant solution at 56 °C for 60 min and washed under running water for 10 min. The sections were then sequentially treated with Weigert’s iron hematoxylin for 10 min, Biebrich scarlet-acid fuchsin for 15 min, phosphotungstic acid for 10 min, and aniline blue for 10 min. Finally, the sections were maintained in 1% acetic acid for 5 min, dehydrated, cleared in xylene, and mounted.
Successful staining was confirmed by clear nuclear staining, preserved cytoplasmic contrast, maintenance of renal architecture, and distinct visualization of connective tissue structures. All stained slides were evaluated under standardized conditions using a light microscope equipped with a digital imaging system.
Histopathological evaluations were performed by a single experienced pathologist who was blinded to the experimental groups. Histopathological scoring was performed at 200× magnification. For each animal and each histopathological parameter, 10 randomly selected microscopic fields were examined. The field showing the most severe alteration for the parameter under evaluation was used to assign the animal’s single integer score on the 0–4 scale. Tubular injury was evaluated according to tubular dilatation, accumulation of proteinaceous material in the tubular lumen, tubular epithelial degeneration, and tubular necrosis. Glomerular injury was evaluated according to glomerular degeneration or atrophy, enlargement of Bowman’s space, and vascular congestion. Interstitial injury was evaluated based on interstitial inflammation and fibrosis. Five-micrometer hematoxylin and eosin- and Masson’s trichrome-stained kidney sections from each animal were used for histopathological evaluation. Representative photomicrographs were obtained at 200× magnification, with scale bars representing 100 µm. The number of separate histological sections examined per animal could not be recovered from the study records and therefore cannot be reported.
Masson’s trichrome findings were interpreted histomorphologically, considering the localization and morphological pattern of collagen deposition rather than the blue staining intensity alone. The semiquantitative interstitial fibrosis score was based on this histomorphological assessment, and the percentage of collagen-positive area was not quantified. Histopathological scoring was performed semiquantitatively using previously described renal injury assessment criteria16,17. Each animal was assigned one integer score for each histopathological parameter on a scale of 0–4, where 0 = absent, 1 = minimal, 2 = mild, 3 = moderate, and 4 = severe. The grading categories represented the blinded pathologist’s overall assessment of the morphological severity of each lesion rather than a continuous morphometric measurement.
Safety precautions and waste management
Appropriate personal protective equipment was used when handling methanol, formaldehyde, xylene, biological samples, and animal tissues. Laboratory coats, gloves, and eye protection were worn. Because of methanol's systemic toxicity and volatility, all procedures were performed with caution. Procedures involving formaldehyde and xylene were conducted under a chemical fume hood whenever possible. Sharps were collected in appropriate sharps disposal containers. Chemical waste and biological materials were disposed of in accordance with institutional biosafety and hazardous waste management procedures.
Statistical analysis
Continuous biochemical, renal injury biomarker, inflammatory, renal function, and redox-related variables were expressed as mean ± standard deviation (mean ± SD). Normality of the data distribution was assessed using the Shapiro–Wilk test, and homogeneity of variances was evaluated using Levene’s test. Between-group comparisons for biochemical outcomes were performed using one-way analysis of variance (ANOVA). Assumption checks identified departures from normality in one group for serum creatinine and variance heterogeneity for several biochemical outcomes. The original ANOVA approach was retained; however, these departures might have affected the reliability of the resulting p-values, and the findings were therefore interpreted cautiously.
When a statistically significant difference was detected by ANOVA, pairwise comparisons between groups were performed using Duncan’s post hoc multiple-comparison test. Values sharing the same superscript letter within each row were not significantly different according to Duncan’s post hoc test. No additional multiplicity adjustment was applied across the biochemical outcomes. Duncan’s procedure did not provide strong control of the family-wise type I error rate, and testing multiple outcomes further increased the risk of false-positive findings. Therefore, individual significant comparisons were interpreted cautiously.
Overall effect sizes for biochemical outcomes were estimated using eta-squared (η2), calculated as (F × df_between)/(F × df_between + df_error), with df_between = 4 and df_error = 25. Two-sided 95% confidence intervals were calculated by inverting the noncentral F distribution and transforming the noncentrality limits (λ) using λ/(λ + N), where N = 30. These supplementary calculations were performed using a scientific computing environment. Estimates were derived from the rounded F statistics obtained from the primary statistical analysis and were therefore approximate. The confidence intervals relied on the normality and equal-variance assumptions of the ANOVA model and were not adjusted for multiple outcomes.
Histopathological scores were ordinal, semiquantitative observations, summarized descriptively as mean ± SD to show the average group-level lesion burden and between-animal variability. No inferential hypothesis testing or post hoc pairwise comparisons were performed for the histopathological scores. Therefore, ANOVA, Duncan’s post hoc test, and p-value reporting were applied only to biochemical, renal injury biomarker, inflammatory, renal function, and redox-related outcomes. A p-value < 0.05 was considered statistically significant.
Results
All 30 animals were included in the analyses, with six animals in each of the five experimental groups. All animals in the five groups were euthanized and sampled on study day 10. For the three methanol-exposed groups, this endpoint corresponded to 48 h after methanol administration. Therefore, the total study duration and sample collection time were consistent across all experimental groups. Renal injury and inflammatory biomarkers, renal function and redox-related parameters, and histopathological findings were evaluated as described below.
Biochemical findings: renal injury and inflammatory biomarkers
The findings for renal injury and inflammatory biomarkers measured in kidney tissue homogenates are presented in Table 1. One-way ANOVA indicated significant overall differences among the five groups in cystatin C [F(4,25) = 5.329, p = 0.003], IL-6 [F(4,25) = 3.907, p = 0.013], KIM-1 [F(4,25) = 3.673, p = 0.017], TNF-α [F(4,25) = 7.660, p < 0.001], and IL-1β [F(4,25) = 11.584, p < 0.001]. Post hoc group comparisons were performed using Duncan’s multiple range test, with group assignments indicated by superscript letters in Table 1. Kidney tissue homogenate levels of cystatin C, IL-6, and KIM-1 were highest in the MTX + Methanol group, whereas no significant differences were observed among the Control, MTX-only, MTX + Methanol + Fomepizole, and MTX + Methanol + Ethanol groups for these variables. Kidney tissue homogenate levels of TNF-α and IL-1β were also highest in the MTX + Methanol group. The MTX-only group showed higher levels of TNF-α and IL-1β in kidney tissue homogenates than the Control group, whereas the antidote-treated groups showed intermediate values (Table 1).
Renal function and redox-related parameters
Serum renal function indices and blood-derived redox-related parameters were presented in Table 2. One-way ANOVA indicated significant overall differences among the five groups in serum urea [F(4,25) = 3.694, p = 0.017], serum creatinine [F(4,25) = 12.988, p < 0.001], serum SOD activity [F(4,25) = 11.621, p < 0.001], blood GSH level [F(4,25) = 10.164, p < 0.001], blood CAT activity [F(4,25) = 10.631, p < 0.001], and serum MDA concentration [F(4,25) = 8.814, p < 0.001]. Post hoc group comparisons were performed using Duncan’s multiple range test, with group assignments indicated by superscript letters in Table 2.
Serum urea, serum creatinine, and serum MDA concentrations were highest in the MTX + Methanol group. Serum urea and serum MDA concentrations did not differ significantly among the Control, MTX-only, MTX + Methanol + Fomepizole, and MTX + Methanol + Ethanol groups, whereas serum creatinine was lowest in the Control group (Table 2).
The MTX + Methanol group also showed the lowest serum SOD activity, blood GSH level, and blood CAT activity. Compared with the MTX + Methanol group, the fomepizole-treated group showed significantly higher serum SOD and blood CAT activities, whereas the corresponding increases in the ethanol-treated group were not statistically significant. Blood GSH levels did not differ significantly among the MTX-only, MTX + Methanol, and two antidote-treated groups (Table 2).
Compared with the Control group, the MTX-only group showed higher kidney tissue homogenate levels of TNF-α and IL-1β and lower serum SOD activity, blood GSH level, and blood CAT activity but did not differ significantly in kidney tissue homogenate levels of cystatin C, IL-6, or KIM-1 or in serum urea, serum creatinine, or serum MDA concentration.
Histopathological findings and renal injury scores
The results of the histopathological evaluation of renal tissues were presented in Table 3. Descriptive variation among the groups was observed in tubular dilatation, accumulation of proteinaceous material, tubular epithelial degeneration, tubular necrosis, glomerular degeneration, enlargement of Bowman’s space, vascular congestion, interstitial inflammation, and interstitial fibrosis.
In the Control group, renal tissue preserved normal histological architecture, with no evident pathological alterations in the glomerular or tubular structures. In the MTX group, mild tubular degeneration, vascular congestion, and interstitial inflammation were observed.
The MTX + Methanol group showed the highest observed injury scores across the evaluated tubular, glomerular, vascular, and interstitial parameters. Both antidote-treated groups showed descriptively lower observed scores than the MTX + Methanol group. In descriptive comparisons, the fomepizole-treated group showed lower observed scores than the ethanol-treated group for most parameters, particularly tubular dilatation, tubular necrosis, glomerular degeneration, enlargement of Bowman’s space, vascular congestion, and interstitial fibrosis (Table 3). These comparisons were descriptive, and no inferential statistical tests were performed on the histopathological scores. Representative renal histopathological images obtained using hematoxylin and eosin and Masson’s trichrome staining are shown in Figure 2.
Overall, the MTX + Methanol group showed the highest renal injury and inflammatory biomarker values, the least favorable renal function and redox profiles, and the highest histopathological injury scores. Both antidote-treated groups showed more favorable renal outcome patterns than the MTX + Methanol group, with the fomepizole-treated group showing a more consistently favorable pattern across the evaluated domains. The MTX-only group also showed changes in selected inflammatory and redox-related parameters relative to the Control group.
DATA AVAILABILITY:
The animal-level raw data supporting the biochemical, renal injury biomarker, inflammatory, renal function, and redox-related analyses are provided in Supplementary File 1.
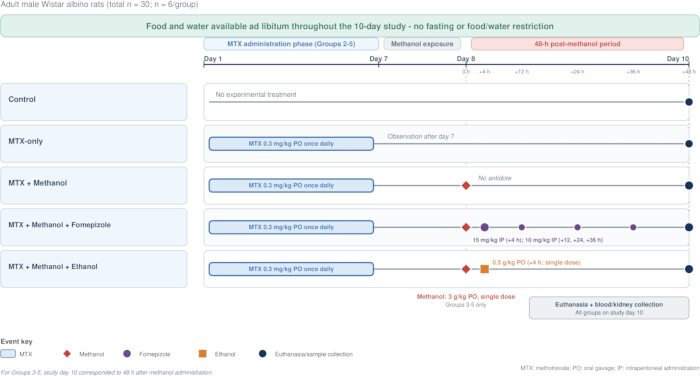
Figure 1: Experimental design and treatment timeline. Schematic representation of the experimental rat model of methanol intoxication. Adult male Wistar albino rats were assigned to five groups: Control, methotrexate (MTX) only, MTX + Methanol, MTX + Methanol + Fomepizole, and MTX + Methanol + Ethanol (n = 6/group). Standard pellet chow and tap water were available ad libitum throughout the 10-day study, and no fasting or other food or water restrictions were imposed before or after methanol administration. The Control group received no experimental treatment. Animals in Groups 2–5 received MTX by oral gavage at 0.3 mg/kg once daily for seven consecutive days (study days 1–7). Animals in Groups 3–5 received a single dose of methanol at 3 g/kg by oral gavage on study day 8. In the MTX + Methanol + Fomepizole group, an intraperitoneal loading dose of fomepizole at 15 mg/kg was administered 4 h after methanol administration, followed by maintenance doses of 10 mg/kg at 12, 24, and 36 h. In the MTX + Methanol + Ethanol group, ethanol was administered as a single dose of 0.5 g/kg by oral gavage 4 h after methanol administration. All animals were euthanized on study day 10. For Groups 3–5, this endpoint corresponded to 48 h after methanol administration. Blood and kidney samples were collected for analyses of renal function, renal injury biomarkers, inflammatory cytokines, redox-related biomarkers, and renal histopathology. Abbreviations: MTX = methotrexate. Please click here to view a larger version of this figure.
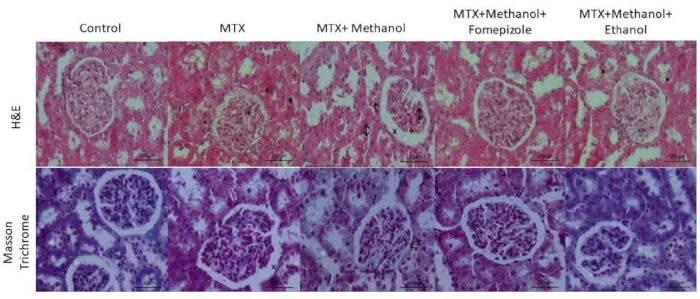
Figure 2: Representative histopathological findings in renal tissue from experimental groups. Representative kidney sections from the Control, MTX, MTX + Methanol, MTX + Methanol + Fomepizole, and MTX + Methanol + Ethanol groups are shown. The upper row presents hematoxylin and eosin (H&E) staining, whereas the lower row presents Masson’s trichrome staining. The Control group exhibited preserved renal architecture with normal glomerular and tubular morphology. The blue-stained collagen observed in the glomerular and tubular basement membranes, vascular walls, and interstitial connective tissue of the Control group was considered physiological collagen rather than evidence of pathological fibrosis. The MTX group showed mild tubular degeneration, vascular congestion, and inflammatory changes. The MTX + Methanol group exhibited more pronounced renal injury, characterized by tubular degeneration (*), vascular congestion (+), widening of Bowman’s space (x), tubular necrosis (↑), interstitial inflammation (↕), and periglomerular collagen accumulation consistent with a histomorphological fibrotic change (‡), as observed in the Masson’s trichrome-stained section. The Fomepizole-treated group showed lower histopathological injury scores than the MTX + Methanol group, with relatively preserved tubular and glomerular structures and less extensive necrosis, inflammation, vascular congestion, and collagen-associated changes. The Ethanol-treated group also showed lower histopathological injury scores than the MTX + Methanol group; however, residual tubular, glomerular, and vascular alterations were more apparent than in the Fomepizole-treated group. Photomicrographs were obtained at 200× magnification, and scale bars represent 100 µm. Masson’s trichrome staining was evaluated as supportive histomorphological evidence; differences in the intensity of blue staining among the panels were not used as a quantitative measure for intergroup comparison of fibrosis. Symbols: * tubular degeneration; + vascular congestion; x widening of Bowman’s space; ↑ tubular necrosis; ↕ interstitial inflammation; ‡ periglomerular collagen accumulation consistent with a histomorphological fibrotic change. MTX, methotrexate. Please click here to view a larger version of this figure.
| Variable | Control (n = 6) | MTX (n = 6) | MTX + Methanol (n = 6) | MTX + Methanol + Fomepizole (n = 6) | MTX + Methanol + Ethanol (n = 6) | p | η² (95% CI) |
| Cystatin C (ng/mL) | 26.07 ± 12.05a | 32.01 ± 1.86a | 45.23 ± 10.51b | 32.49 ± 1.60a | 31.27 ± 4.60a | 0.003 | 0.460 (0.084 – 0.597) |
| IL-6 (ng/L) | 7.66 ± 1.38a | 8.72 ± 2.45a | 11.02 ± 0.83b | 7.96 ± 1.54a | 8.12 ± 1.77a | 0.013 | 0.385 (0.023 – 0.535) |
| KIM-1 (ng/mL) | 2.21 ± 1.00a | 2.47 ± 0.24a | 3.45 ± 0.81b | 2.28 ± 0.58a | 2.32 ± 0.37a | 0.017 | 0.370 (0.013 – 0.522) |
| TNF-α (ng/L) | 118.66 ± 22.95a | 190.51 ± 5.84b | 238.29 ± 34.68c | 147.10 ± 24.31ab | 168.41 ± 75.41ab | <0.001 | 0.551 (0.181 – 0.668) |
| IL-1β (ng/mL) | 8.43 ± 0.59a | 12.53 ± 1.05c | 15.26 ± 1.46d | 10.05 ± 2.86ab | 11.17 ± 2.37bc | <0.001 | 0.650 (0.316 – 0.743) |
Table 1: Renal injury and inflammatory biomarkers in experimental groups. Data are presented as mean ± standard deviation (SD), with six animals per group. All biomarkers were measured in kidney tissue homogenates. Cystatin C, KIM-1, and IL-1β concentrations are expressed in ng/mL; IL-6 and TNF-α concentrations are expressed in ng/L. Reported p values are from omnibus one-way analysis of variance (ANOVA) across the five groups. Following a significant omnibus test, post hoc comparisons were performed using Duncan’s multiple range test. Within each row, groups sharing at least one superscript letter do not differ significantly, whereas groups with no letter in common differ significantly at the 0.05 level. No additional multiplicity adjustment was applied across biomarkers. Variance heterogeneity was identified among some biomarkers; therefore, the ANOVA and Duncan results should be interpreted with caution. Abbreviations: MTX = methotrexate; KIM-1 = kidney injury molecule-1; IL-6 = interleukin-6; TNF-α = tumor necrosis factor-alpha; IL-1β = interleukin-1 beta; SD = standard deviation; ANOVA = analysis of variance; CI = confidence interval. η2 represents the overall effect size across the five groups. The two-sided 95% confidence intervals are model-based, assume normally distributed errors with equal variances, and are not adjusted for multiple outcomes. Therefore, the confidence intervals should be interpreted cautiously where these assumptions are violated.
| Variable | Control | MTX | MTX + Methanol | MTX + Methanol + Fomepizole | MTX + Methanol + Ethanol | p | η² (95% CI) |
| Serum urea (mg/dL) | 39.64 ± 13.69a | 46.88 ± 9.49a | 98.75 ± 59.24b | 48.03 ± 19.64a | 60.44 ± 18.53a | 0.017 | 0.371 (0.014–0.523) |
| Serum creatinine (mg/dL) | 0.50 ± 0.10a | 0.54 ± 0.05ab | 0.72 ± 0.03c | 0.54 ± 0.03ab | 0.60 ± 0.05b | <0.001 | 0.675 (0.356–0.762) |
| Serum SOD activity (U/mL) | 470.40 ± 40.49d | 371.16 ± 17.64c | 219.29 ± 85.06a | 319.38 ± 107.20bc | 256.22 ± 67.89ab | <0.001 | 0.650 (0.317–0.743) |
| Blood GSH (mmol/L) | 58.74 ± 31.90b | 26.36 ± 5.92a | 11.10 ± 3.73a | 19.56 ± 1.66a | 13.66 ± 5.32a | <0.001 | 0.619 (0.272–0.720) |
| Blood CAT activity (U/mL) | 220.82 ± 74.08c | 160.88 ± 55.18b | 68.90 ± 13.41a | 129.45 ± 7.49b | 110.14 ± 20.18ab | <0.001 | 0.630 (0.287–0.728) |
| Serum MDA (nmol/mL) | 13.17 ± 2.03a | 17.29 ± 6.36a | 31.83 ± 9.94b | 17.93 ± 2.04a | 19.34 ± 4.65a | <0.001 | 0.585 (0.225–0.694) |
Table 2: Renal function and redox-related parameters in experimental groups. Data are presented as mean ± standard deviation (SD), with six animals per group. Serum urea, serum creatinine, superoxide dismutase (SOD) activity, and malondialdehyde (MDA) concentration were measured in serum, whereas reduced glutathione (GSH) level and catalase (CAT) activity were measured in blood anticoagulated with ethylenediaminetetraacetic acid (EDTA). Serum urea and creatinine concentrations are expressed in mg/dL, SOD and CAT activities in U/mL, GSH levels in mmol/L, and MDA concentrations in nmol/mL. Reported p values are from omnibus one-way analysis of variance (ANOVA) across the five groups. Following a significant omnibus test, post hoc comparisons were performed using Duncan’s multiple range test. Within each row, groups sharing at least one superscript letter do not differ significantly, whereas groups with no letter in common differ significantly at the 0.05 level. No additional multiplicity adjustment was applied across biomarkers. Variance heterogeneity was identified for some outcomes; therefore, the ANOVA and Duncan results should be interpreted cautiously. The redox-related biomarkers are indirect indicators and do not constitute direct measurements of mitochondrial function or molecular mechanisms of injury. η2 represents the overall effect size across the five groups. The two-sided 95% confidence intervals are model-based, assume normally distributed errors with equal variances, and are not adjusted for multiple outcomes. Therefore, the confidence intervals should be interpreted cautiously where these assumptions are violated. Abbreviations: MTX = methotrexate; SOD = superoxide dismutase; GSH = reduced glutathione; CAT = catalase; MDA = malondialdehyde; EDTA = ethylenediaminetetraacetic acid; SD = standard deviation; ANOVA = analysis of variance; CI = confidence interval.
| Variable | Control | MTX | MTX + Methanol | MTX + Methanol + Fomepizole | MTX + Methanol + Ethanol |
| Tubular dilatation | 0.16 ± 0.40 | 1.50 ± 0.54 | 3.50 ± 0.54 | 0.83 ± 0.40 | 1.66 ± 0.51 |
| Proteinaceous material accumulation | 0.00 ± 0.00 | 1.33 ± 0.51 | 3.16 ± 0.40 | 0.66 ± 0.51 | 1.33 ± 0.51 |
| Tubular epithelial degeneration | 0.16 ± 0.40 | 1.83 ± 0.40 | 3.83 ± 0.40 | 1.00 ± 0.00 | 2.00 ± 0.00 |
| Tubular necrosis | 0.00 ± 0.00 | 1.00 ± 0.00 | 3.33 ± 0.51 | 0.83 ± 0.40 | 1.33 ± 0.51 |
| Glomerular degeneration | 0.16 ± 0.40 | 1.33 ± 0.51 | 3.33 ± 0.51 | 1.00 ± 0.00 | 1.66 ± 0.51 |
| Bowman's space enlargement | 0.00 ± 0.00 | 1.16 ± 0.40 | 3.00 ± 0.00 | 0.83 ± 0.40 | 1.66 ± 0.51 |
| Vascular congestion | 0.00 ± 0.00 | 1.33 ± 0.51 | 3.16 ± 0.40 | 0.83 ± 0.40 | 1.66 ± 0.51 |
| Interstitial inflammation | 0.00 ± 0.00 | 1.00 ± 0.00 | 3.00 ± 0.63 | 0.83 ± 0.40 | 1.16 ± 0.40 |
| Interstitial fibrosis | 0.00 ± 0.00 | 1.00 ± 0.00 | 2.83 ± 0.40 | 0.66 ± 0.51 | 1.16 ± 0.40 |
Table 3: Descriptive histopathological scores in experimental groups. Data are presented descriptively as mean ± standard deviation (SD), with six animals per group. Histopathological scores were obtained from kidney sections stained with hematoxylin and eosin (H&E) and Masson’s trichrome; the scores are dimensionless. Each animal was assigned one integer score for each histopathological parameter on a scale of 0–4, where 0 = absent, 1 = minimal, 2 = mild, 3 = moderate, and 4 = severe. The decimal values presented in the table represent the arithmetic means of the individual integer scores obtained from the six animals in each experimental group and do not represent scores assigned to individual animals or a continuous scoring system. The standard deviations represent between-animal variability within each group. No inferential statistical testing or post hoc pairwise comparisons were performed on the histopathological scores; therefore, the observed between-group patterns should be interpreted descriptively rather than as statistically significant differences. Histopathological evaluation included tubular dilatation, proteinaceous material accumulation, tubular epithelial degeneration, tubular necrosis, glomerular degeneration, enlargement of Bowman’s space, vascular congestion, interstitial inflammation, and interstitial fibrosis.
Supplementary File 1: Raw data supporting the biochemical analyses. This spreadsheet contains the animal-level raw values used for the biochemical, renal injury biomarker, inflammatory, and redox-related analyses reported in the manuscript. Please click here to download this file.
Discussion
The principal finding of this study was that the MTX + Methanol group showed the most adverse renal injury profile across functional, inflammatory, redox-related, and histopathological outcomes. This group had the highest serum urea, serum creatinine, renal cystatin C, KIM-1, TNF-α, IL-6, IL-1β, and MDA values and the lowest SOD activity, GSH levels, and CAT activity, together with the highest observed histopathological injury scores. Both antidote-treated groups showed more favorable renal outcome patterns than the MTX + Methanol group, with the fomepizole-treated group showing a more consistently favorable pattern across the evaluated domains. However, these findings were obtained in an acute MTX-pretreated rat model using unequal antidote regimens: repeated intraperitoneal fomepizole administration versus a single oral ethanol dose. These differences in route and dosing frequency limit direct comparison of nephroprotective efficacy, and the observed outcome patterns do not establish the superiority of fomepizole over ethanol. The MTX-only group showed higher TNF-α and IL-1β levels and lower SOD activity, GSH levels, and CAT activity than the Control group, whereas renal cystatin C, IL-6, KIM-1, serum urea, serum creatinine, and MDA levels remained statistically comparable between the groups. This pattern indicated that MTX pretreatment contributed to the background inflammatory and redox-related profile. Accordingly, the additional alterations observed in the MTX + Methanol group occurred on an MTX-pretreated background and could not be attributed solely to methanol. Because no methanol-only group was included, the independent contribution of methanol and potential MTX–methanol interactions could not be fully separated.
Based on established methanol toxicology, toxic metabolite accumulation represented a plausible contributor to renal injury. Methanol is metabolized predominantly in the liver by ADH to formaldehyde and subsequently to formic acid1,3,18,19,20. The kidney could therefore have been affected primarily by circulating formate and the resulting systemic metabolic disturbances rather than by extensive local methanol metabolism. However, a contribution from alcohol or aldehyde metabolism in renal tissue could not be excluded, as methanol, formaldehyde, and formate concentrations, as well as renal ADH activity, were not measured. Formic acid inhibits mitochondrial cytochrome c oxidase, thereby impairing oxidative phosphorylation, reducing ATP production, and inducing histotoxic hypoxia; this process may culminate in lactic acidosis, increased reactive oxygen species generation, and membrane damage1,2,3,19,20. Compared with the liver, which is the principal site of methanol metabolism, the kidney may be particularly susceptible to the downstream effects of formate and systemic metabolic disturbances. Proximal tubular epithelial cells have high energy requirements and are particularly vulnerable to mitochondrial dysfunction, oxidative stress, and microcirculatory impairment. Consequently, formate-mediated hypoxia, metabolic acidosis, and inflammation may contribute to renal injury2,8,9,21,22,23. Clinical studies showing associations of acute kidney injury with metabolic acidosis, respiratory failure, rhabdomyolysis, sepsis, and multiple organ dysfunction suggested that renal injury may reflect the systemic toxic burden8,9,10,21. The more rapid folate-dependent oxidation of formate in rats than in humans represented an important limitation of experimental models1,11,12. Accordingly, methotrexate pretreatment was used to reduce formate clearance and increase susceptibility to methanol toxicity rather than to reproduce the complete clinical and metabolic features of human methanol poisoning.
Renal dysfunction was demonstrated through the combined evaluation of conventional biochemical parameters and renal injury biomarkers. Elevated serum urea and creatinine concentrations in the MTX + Methanol group supported impaired renal filtration and excretory capacity. Increased renal cystatin C and KIM-1 levels suggested that tubular injury accompanied functional impairment. Given the association of KIM-1 with proximal tubular injury, this increase was consistent with tubular epithelial degeneration, dilatation, and necrosis24,25. Increased cystatin C levels also supported the presence of impaired renal function26,27. The lower levels of these biomarkers in the fomepizole- and ethanol-treated groups suggested attenuation of renal injury, with a more consistent pattern observed in the fomepizole-treated group. The redox-related biomarker pattern was consistent with oxidative stress as a possible contributor to renal injury rather than evidence of a confirmed mechanism. MDA is commonly used as an index of lipid peroxidation, whereas GSH contributes to the maintenance of cellular redox homeostasis28,29. In experimental models of methanol intoxication and methanol-associated optic neuropathy, oxidative stress, lipid peroxidation, and reduced antioxidant capacity have also been associated with tissue injury10,15,20. Lower serum SOD activity, higher serum MDA concentrations, and lower blood GSH levels and CAT activity in the MTX + Methanol group were consistent with reduced antioxidant capacity and increased lipid peroxidation; however, these measurements did not establish an underlying mitochondrial or molecular mechanism. Lower serum MDA concentrations and partial recovery of serum SOD and blood CAT activities in the antidote-treated groups were compatible with a more favorable redox-related biomarker profile, with a more consistently favorable pattern observed in the fomepizole-treated group.
Higher TNF-α, IL-6, and IL-1β values in the MTX + Methanol group were consistent with a proinflammatory renal profile. Because these cytokines were not pathway-specific and MTX itself was associated with changes in selected inflammatory markers, the findings supported inflammation as a possible contributor rather than a confirmed mechanism of renal injury. Formic acid-mediated mitochondrial dysfunction, cellular hypoxia, and oxidative stress may provide a basis for activation of inflammatory pathways; therefore, oxidative stress and inflammation may progress as mutually reinforcing processes in methanol toxicity1,2,3,15. Experimental models of methanol intoxication have reported associations of methanol exposure with inflammatory cell infiltration, histopathological damage, and increased levels of proinflammatory markers such as IL-1β and TNF-α13,15. These findings were consistent with the increased proinflammatory cytokine levels and elevated scores for interstitial inflammation, tubular degeneration, and tubular necrosis observed in the MTX + Methanol group. Collectively, the findings were compatible with a multifactorial process involving toxic metabolite effects, oxidative stress, inflammation, microcirculatory impairment, and systemic toxic burden; however, these pathways were not directly assessed. Lower TNF-α, IL-6, and IL-1β levels in the antidote-treated groups suggested that inhibition of toxic metabolite formation may also have limited the inflammatory response. Histopathological findings provided tissue-level correlates of renal injury, with the MTX + Methanol group showing the highest observed injury scores across tubular, glomerular, vascular, and interstitial parameters. Both antidote-treated groups showed descriptively lower histopathological injury scores, and the fomepizole-treated group showed descriptively lower scores than the ethanol-treated group for most parameters. However, because no inferential statistical testing was performed on the histopathological scores, these observations did not establish statistically significant histopathological protection or superiority for either antidote16,17.
The antidotal effects of ethanol and fomepizole in methanol intoxication are based on suppression of alcohol dehydrogenase-mediated metabolism, thereby reducing the formation of formaldehyde and formic acid. Ethanol acts as a competitive substrate, whereas fomepizole functions as a direct and potent inhibitor of alcohol dehydrogenase1,3,4,6,7,30,31,32. The more favorable renal outcome patterns observed in both antidote-treated groups were compatible with the expected effects of alcohol dehydrogenase inhibition. Nevertheless, the current literature does not demonstrate definitive clinical superiority of fomepizole over ethanol. Although fomepizole is often preferred because of easier dosing, predictable pharmacokinetics, and a lower adverse-effect profile, ethanol remains an effective alternative1,3,4,6,7,30,32. In the mass methanol poisoning data reported by Zakharov et al., no clear difference was observed between the two antidotes in mortality, intensive care duration, or dialysis requirement; therefore, interpretations regarding clinical superiority require caution5. No statistically significant direct differences between the fomepizole- and ethanol-treated groups were identified for the biochemical outcomes using Duncan’s post hoc test. Moreover, fomepizole was administered in repeated doses, whereas ethanol was administered as a single dose. The regimens were not matched for route, dosing frequency, or systemic exposure. Consequently, the descriptively more favorable pattern associated with fomepizole could have reflected differences in dosing schedule, route of administration, or drug exposure, in addition to differences between the antidotal agents, and did not establish greater biochemical efficacy, clinical superiority, or a clinical treatment preference5,6,30,32. A major strength of the study was the integrated assessment of serum urea and creatinine, cystatin C, KIM-1, proinflammatory cytokines, redox-related biomarkers, and histopathological scores across complementary functional, tubular, inflammatory, redox-related, and structural domains. This renal injury-focused model may provide a useful preclinical framework for evaluating antidotal regimens, adjunctive renoprotective interventions, and renal injury biomarkers under conditions of reduced folate-dependent formate clearance8,9,10,21.
Several limitations affected the interpretation. Direct generalizability to clinical methanol intoxication was limited by the experimental animal model and interspecies metabolic differences. Methotrexate may independently influence renal, inflammatory, and oxidative outcomes33, and the absence of a methanol-only group prevented complete separation of methanol effects from potential MTX–methanol interactions. Serum or tissue concentrations of methanol, formaldehyde, formate, ethanol, and fomepizole were not measured, and ADH activity in the crude renal cytosolic fraction was not assessed; therefore, metabolic sensitization, toxic metabolite formation, antidote exposure, and inhibition of methanol metabolism could not be directly verified, and correlation analyses with renal biochemical outcomes could not be performed. Acid–base variables, including pH, bicarbonate, base excess, and anion gap, were not measured. The 48 h follow-up permitted evaluation only of acute renal outcomes and did not establish renal recovery, persistence, or reversibility of injury, or chronic structural changes. Masson’s trichrome staining was evaluated histomorphologically without quantitative measurement of collagen-positive area, and molecular or biochemical fibrosis markers, including α-smooth muscle actin expression, collagen content, and 4-hydroxyproline concentration, were not evaluated. Histopathological assessment by a single blinded pathologist precluded evaluation of interobserver agreement, and semiquantitative lesion grading remained potentially subject to observer-dependent classification. The antidotal regimens were pharmacologically unequal; renal tissue ELISA concentrations were not normalized to total protein concentration; molecular analyses of mitochondrial function and cell death pathways were not performed; the sample size was limited; and only male rats were included. Future studies should incorporate methanol-only and MTX-only groups, comparable antidote regimens, serial measurements of methanol, formate, and antidote concentrations, renal ADH activity, acid–base measurements, quantitative fibrosis assessment, longer follow-up, and appropriately designed clinical validation. In conclusion, methanol exposure in this methotrexate-pretreated rat model was associated with impaired renal function, increased renal injury and inflammatory biomarkers, an unfavorable redox-related profile, and histopathological injury. Both antidote-treated groups showed more favorable renal outcome patterns than the MTX + Methanol group. Fomepizole showed a more consistently favorable descriptive pattern across the evaluated domains; however, the absence of significant direct biochemical differences between the antidote groups, the descriptive nature of the histopathological comparisons, unequal antidote regimens, and the absence of toxicokinetic measurements precluded conclusions regarding superiority over ethanol. These findings are restricted to the methotrexate-pretreated rat model and do not establish the renal effects of either antidote following methanol exposure without methotrexate pretreatment or in human methanol poisoning. Further studies incorporating direct toxicokinetic measurements, mechanistic assessments, comparable antidote dosing regimens, and longer follow-up are needed to assess the reproducibility and broader applicability of these findings.
Disclosures
The authors declare that they have no competing interests. During the preparation of this manuscript, AI-assisted tools were used solely for language editing and grammar correction. No artificial intelligence tools were used for the generation, analysis, or interpretation of data, nor for the creation of any figures, tables, or graphical elements. The authors take full responsibility for the content of the manuscript.
Acknowledgements
This study was supported by the Scientific Research Projects Coordination Unit of Kırşehir Ahi Evran University (Project No: TIP.A3.26.011). The funding body had no role in the study design, data collection, data analysis, data interpretation, or manuscript writing.
Materials
| Name | Company | Catalog Number | Comments |
|---|---|---|---|
| 10% Neutral Buffered Formalin | Merck | Not recorded | Tissue fixation for histopathological processing. |
| Absolute Ethanol (≥99.8%) | Sigma-Aldrich, USA | Not recorded | Diluted with sterile distilled water to obtain a final 20% (v/v) solution; administered as a single oral-gavage dose of 0.5 g/kg 4 h after methanol administration. |
| Benchtop Centrifuge | Nüve | NF048 | Sample preparation and centrifugation. |
| Biotin-Conjugated Antibody | BT Lab ELISA Kit Components | Included in kit | Detection antibody |
| CAT (Catalase) Kit | Otto Scientific | Otto3051 | Colorimetric measurement of catalase (CAT) activity in EDTA-anticoagulated blood. |
| cOmplete Mini EDTA-free Protease Inhibitor Cocktail | Roche / Sigma-Aldrich | 11836170001 | Added to the homogenization buffer during preparation of kidney tissue homogenates for ELISA analyses. |
| Creatinine Kit | Otto Scientific | OttoBC139 | Assessment of serum creatinine levels. |
| Digital Homogenizer | Daihan Scientific | HG-15D | Tissue homogenization |
| ELx50 Auto Strip Washer | Bio-Tek Instruments, USA | ELx50 | ELISA washing |
| ELx800 Microplate Reader | Bio-Tek Instruments, USA | ELx800 | Absorbance measurement for ELISA and colorimetric assays; ELISA absorbance was read at 450 nm. |
| Eosin Y (Yellowish) | Merck | 1.15935.0025 | Histopathological staining |
| Fomepizole (4-Methylpyrazole) | Hüsnü Arsan  A. A. ., Ankara, Türkiye ., Ankara, Türkiye | Not recorded | Prepared in sterile 0.9% sodium chloride solution at a final concentration of 10 mg/mL; administered intraperitoneally as a 15 mg/kg loading dose 4 h after methanol administration, followed by 10 mg/kg maintenance doses at 12, 24, and 36 h after methanol administration. |
| GSH (Glutathione) Kit | Otto Scientific | Otto3053 | Colorimetric measurement of reduced glutathione (GSH) levels in EDTA-anticoagulated blood. |
| Harris Hematoxylin Solution | BSLAB | BS-002 | Histopathological staining |
| Hydrochloric acid (HCl) | Merck | 7647-01-0 | pH adjustment |
| IBM SPSS Statistics | IBM Corp. | IBM SPSS Statistics Version 29.0 | Statistical analysis; RRID:SCR_016479. |
| Ketamine Hydrochloride (Ketalar) | Pfizer,USA | Not recorded | General anesthesia before blood and kidney tissue collection. |
| Light Microscope | Nikon Eclipse | Ni-U | Histopathological examination |
| Masson's Trichrome Staining Kit | MOSLAB (Medical Olympus Sanayi Tic. Ltd. ti., Türkiye) | BKMTO001 | Histopathological staining |
| MDA (Malondialdehyde) Kit | Otto Scientific | Otto1001 | Colorimetric measurement of malondialdehyde (MDA) levels in serum as an index of lipid peroxidation. |
| Methanol (≥99.8%) | Sigma-Aldrich, USA | 322415 | Administered orally (3 g/kg) to induce experimental methanol intoxication. |
| Methotrexate (Emthexate 500 mg/5 mL) | Teva Pharma Belgium | Not recorded | Commercial 100 mg/mL formulation diluted with sterile 0.9% sodium chloride solution to obtain a final working concentration of 0.06 mg/mL; administered by oral gavage at 5 mL/kg, corresponding to 0.3 mg/kg, once daily for 7 consecutive days. |
| Mindray Chemistry Analyzer | Mindray | BS-400 | Measurement of serum urea and creatinine. |
| Paraffin Wax, histological grade | Not recorded | Not recorded | Tissue embedding. |
| Phosphate-buffered saline (PBS) | Merck | P4417 | tissue rinsing/washing |
| Rat Cystatin-C ELISA Kit | BT Lab, China | E0145Ra | Quantification of cystatin C levels in kidney tissue homogenates; analytical sensitivity, 0.25 ng/mL; detection range, 0.5–100 ng/mL. |
| Rat IL-1β ELISA Kit | BT Lab, China | E0119Ra | Quantification of IL-1β levels in kidney tissue homogenates; analytical sensitivity, 0.08 ng/mL; detection range, 0.2–60 ng/mL. |
| Rat IL-6 ELISA Kit | BT Lab, China | E0135Ra | Quantification of IL-6 levels in kidney tissue homogenates; analytical sensitivity, 0.052 ng/L; detection range, 0.1–40 ng/L. |
| Rat KIM-1 ELISA Kit | BT Lab, China | E0549Ra | Quantification of KIM-1 levels in kidney tissue homogenates; analytical sensitivity, 0.01 ng/mL; detection range, 0.05–10 ng/mL. |
| Rat TNF-α ELISA Kit | BT Lab, China | E0764Ra | Quantification of TNF-α levels in kidney tissue homogenates; analytical sensitivity, 2.51 ng/L; detection range, 5–1,000 ng/L. |
| RIPA Lysis and Extraction Buffer | Thermo Scientific | 89900 | Kidney tissue homogenization and lysis for ELISA analyses. |
| SOD (Superoxide Dismutase) Kit | Otto Scientific | Otto3047 | Colorimetric measurement of superoxide dismutase (SOD) activity in serum. |
| Sodium citrate | Merck | 03-04-6132 | Buffer preparation |
| Sodium hydroxide (NaOH) | Merck | 1310-73-2 | pH adjustment |
| Stainless Steel Feeding Needle (22 G Oral Gavage Cannula) | Instech Laboratories, USA | Not recorded | Reusable stainless-steel cannula used for oral gavage administration in rats. |
| Stop Solution | BT Lab ELISA Kit Components | Included in kit | ELISA reaction termination |
| Streptavidin Peroxidase | Thermo Scientific | SHRP248-B | ELISA detection system |
| TMB Substrate Solution | BT Lab ELISA Kit Components | Included in kit | Chromogenic substrate |
| Tris-HCl | Thermo Scientific | 1185-53-1 | Buffer preparation |
| Urea Kit | Otto Scientific | OttoBC157 | Measurement of serum urea levels. |
| Wash Buffer Concentrate | BT Lab ELISA Kit Components | Included in kit | Plate washing |
| Wistar albino rats | Experimental Animal Research Laboratory of Ahi Evran University,  , Türkiye , Türkiye | Breeding/production license no. 184 | Male; 8–12 weeks old; body weight, 220 ± 20 g |
| Xylazine hydrochloride (Rompun) | Bayer,Germany | Not recorded | General anesthesia before blood and kidney tissue collection. |
| Xylene, histological grade | Not recorded | Not recorded | Histological tissue processing and clearing. |
References
- Barceloux DG et al. American Academy of Clinical Toxicology practice guidelines on the treatment of methanol poisoning. J Toxicol Clin Toxicol. 2002;40(4):415-446.
- Nekoukar Z et al. Methanol poisoning as a new world challenge: a review. Ann Med Surg (Lond). 2021;66:102445.
- Mégarbane B, Borron SW, Baud FJ. Current recommendations for treatment of severe toxic alcohol poisonings. Intensive Care Med. 2005;31(2):189-195.
- McMartin K, Jacobsen D, Hovda KE. Antidotes for poisoning by alcohols that form toxic metabolites. Br J Clin Pharmacol. 2025;91(3):662-671.
- Zakharov S et al. Fomepizole versus ethanol in the treatment of acute methanol poisoning: comparison of clinical effectiveness in a mass poisoning outbreak. Clin Toxicol (Phila). 2015;53(8):797-806.
- Rietjens SJ, de Lange DW, Meulenbelt J. Ethylene glycol or methanol intoxication: which antidote should be used, fomepizole or ethanol? Neth J Med. 2014;72(2):73-79.
- Brent J. Fomepizole for ethylene glycol and methanol poisoning. N Engl J Med. 2009;360(21):2216-2223.
- Chang ST et al. Acute kidney injury and the risk of mortality in patients with methanol intoxication. BMC Nephrol. 2019;20(1):205.
- Wang C et al. Kidney outcomes after methanol and ethylene glycol poisoning: a systematic review and meta-analysis. Clin Toxicol (Phila). 2023;61(5):326-335.
- Thongprayoon C et al. Acute kidney injury in hospitalized patients with methanol intoxication: National Inpatient Sample 2003-2014. Hosp Pract (1995). 2021;49(3):203-208.
- Johlin FC, Fortman CS, Nghiem DD, Tephly TR. Studies on the role of folic acid and folate-dependent enzymes in human methanol poisoning. Mol Pharmacol. 1987;31(5):557-561.
- Noker PE, Tephly TR. The role of folates in methanol toxicity. Adv Exp Med Biol. 1980;132:305-315.
- Taşlı NG et al. Protective effects of rutin against methanol-induced acute toxic optic neuropathy: an experimental study. Int J Ophthalmol. 2018;11(5):780-785.
- Konuk ŞG et al. Evaluation of the protective role of melatonin in methanol-induced optic neuropathy. Int Ophthalmol. 2025;45(1):182.
- Gursul C et al. Amelioration of oxidative damage parameters by carvacrol on methanol-induced liver injury in rats. Exp Anim. 2022;71(2):224-230.
- Kara Ö, Kilitci A, Dağlıoğlu G. Protective effect of resveratrol on cisplatin induced damage in rat kidney. Cukurova Med J. 2022;47(3):990-995.
- Pandir D, Kara Ö. Cisplatin-induced kidney damage and the protective effect of bilberry (Vaccinium myrtillus L.): an experimental study. Turk J Med Sci. 2013;43(6):951-956.
- Jacobsen D, McMartin KE. Methanol and ethylene glycol poisonings. Mechanism of toxicity, clinical course, diagnosis and treatment. Med Toxicol. 1986;1(5):309-334.
- Alrashed M et al. The perils of methanol exposure: insights into toxicity and clinical management. Toxics. 2024;12(12):924.
- Yazgan ÜC et al. Effect of caffeic acid phenethyl ester on oxidant and anti-oxidant status of liver and serum in a rat model with acute methanol intoxication. Ir J Med Sci. 2017;186(2):519-523.
- Gharaeikhezri MH et al. Prevalence and predicting factors of acute kidney injury due to methanol intoxication; a systematic review. J Renal Inj Prev. 2024;13(2):e32195.
- Allata Y et al. The role of nephrologists in the management of methanol poisoning. Cureus. 2023;15(4):e37471.
- Mullins ME, Kraut JA. The Role of the Nephrologist in Management of Poisoning and Intoxication: Core Curriculum 2022. Am J Kidney Dis. 2022;79(6):877-889.
- Ichimura T et al. Kidney injury molecule-1 (KIM-1), a putative epithelial cell adhesion molecule containing a novel immunoglobulin domain, is up-regulated in renal cells after injury. J Biol Chem. 1998;273(7):4135-4142.
- Han WK et al. Kidney injury molecule-1 (KIM-1): A novel biomarker for human renal proximal tubule injury. Kidney Int. 2002;62(1):237-244.
- Dharnidharka VR, Kwon C, Stevens G. Serum cystatin C is superior to serum creatinine as a marker of kidney function: a meta-analysis. Am J Kidney Dis. 2002;40(2):221-226.
- Herget-Rosenthal S et al. Early detection of acute renal failure by serum cystatin C. Kidney Int. 2004;66(3):1115-1122.
- Ohkawa H, Ohishi N, Yagi K. Assay for lipid peroxides in animal tissues by thiobarbituric acid reaction. Anal Biochem. 1979;95(2):351-358.
- Sedlak J, Lindsay RH. Estimation of total, protein-bound, and nonprotein sulfhydryl groups in tissue with Ellman's reagent. Anal Biochem. 1968;25:192-205.
- Mégarbane B. Treatment of patients with ethylene glycol or methanol poisoning: focus on fomepizole. Open Access Emerg Med. 2010;2:67-75.
- Brent J et al. Fomepizole for the treatment of methanol poisoning. N Engl J Med. 2001;344(6):424-429.
- Najari F, Baradaran I, Najari D. Methanol poisoning and its treatment. Int J Med Toxicol Forensic Med. 2020;10(1):26639.
- Rajamani R, Muthuvel A, Senthilvelan M, Sheeladevi R. Oxidative stress induced by methotrexate alone and in the presence of methanol in discrete regions of the rodent brain, retina and optic nerve. Toxicol Lett. 2006;165(3):265-273.