This longitudinal protocol combines repeated Care Dependency Scale assessments with growth mixture modeling to identify distinct nursing dependency trajectories after acute myocardial infarction and evaluate demographic, clinical, and psychosocial factors associated with trajectory-class membership.
Research Article
Latent Classes of Nursing Dependency Trajectories and Associated Factors in Patients with Acute Myocardial Infarction
* These authors contributed equally
In This Article
Summary
Abstract
This study aimed to identify latent classes of nursing dependency trajectories in patients with acute myocardial infarction (AMI) and examine factors associated with trajectory-class membership. This single-center longitudinal observational study included 260 patients with AMI admitted to Linquan County People’s Hospital between January 2024 and January 2026. The study baseline was defined as the time point after successful emergency treatment and recovery of consciousness. Nursing dependency was assessed using the Care Dependency Scale (CDS) at baseline (T1), day 3 after admission (T2), discharge (T3), and 1 month after discharge (T4). Growth mixture modeling was used to identify distinct longitudinal trajectory classes. Clinical and psychosocial characteristics were subsequently evaluated using multinomial logistic regression to identify factors independently associated with trajectory-class membership. Four distinct nursing dependency trajectories were identified: High Independence-Slow Improvement Type (C1, n = 66, 25.4%), Moderate Dependency-Rapid Deterioration Type (C2, n = 54, 20.8%), High Dependency-Significant Improvement Type (C3, n = 90, 34.6%), and High Dependency-Slow Aggravation Type (C4, n = 50, 19.2%). Age, marital status, depressive and anxiety symptoms, social support, and history of underlying diseases showed independent class-specific associations with trajectory membership. Nursing dependency showed substantial interindividual heterogeneity among patients with AMI, with four distinct longitudinal trajectories identified. Factors associated with trajectory-class membership may help identify patients requiring closer nursing assessment and individualized follow-up; however, the effectiveness of interventions targeting these factors requires prospective evaluation.
Introduction
Acute myocardial infarction (AMI) is commonly caused by abrupt coronary artery occlusion, resulting in a marked reduction or interruption of myocardial blood flow and subsequent myocardial necrosis. AMI remains a major life-threatening cardiovascular condition because impaired myocardial function and acute complications can substantially affect short- and long-term outcomes1. Reperfusion strategies, including percutaneous coronary intervention and thrombolytic therapy, can restore coronary blood flow and have substantially improved the acute management of AMI. Nevertheless, even after successful acute treatment, some patients continue to experience limitations in self-care and activities of daily living and consequently require varying levels of nursing support2.
Nursing dependency can affect patients' quality of life, social participation, functional recovery, and the overall rehabilitation process3. Previous AMI research has focused predominantly on diagnostic and therapeutic strategies, prevention and management of complications, and prognostic factors. Previous cross-sectional research in patients with coronary heart disease after percutaneous coronary intervention has identified frailty, self-efficacy, and psychological status as factors associated with care dependence; however, single-time-point assessment cannot characterize within-patient changes in dependency or distinguish heterogeneous recovery patterns over time4. By repeatedly assessing nursing dependency at four time points and applying growth mixture modeling, the present study extends previous static analyses by identifying latent patient subgroups with distinct longitudinal trajectories. Identifying these heterogeneous patterns may help clinicians recognize patients with different rehabilitation profiles and provide a basis for individualized nursing assessment, follow-up, and supportive care.
Accordingly, this study aimed to identify distinct longitudinal classes of nursing dependency from the post-emergency-treatment baseline to 1 month after discharge in patients with AMI and to examine demographic, clinical, and psychosocial factors associated with trajectory-class membership. Given the exploratory nature of the study, no directional hypotheses regarding specific trajectory classes were prespecified.
Protocol
The study was conducted in the Department of Emergency Medicine, Linquan County People’s Hospital, Fuyang, Anhui, China. The study protocol was reviewed and approved by the Ethics Committee of Linquan County People’s Hospital (Approval No. 24XNLC-HL1015). Written informed consent was obtained from all participants before enrollment. All procedures involving human participants were conducted in accordance with institutional ethical requirements and applicable ethical principles.
Study setting and participant identification
The study was conducted as a single-center longitudinal observational investigation in the Department of Emergency Medicine at Linquan County People’s Hospital, Fuyang, Anhui, China. Participants were recruited between January 2024 and January 2026 and were followed from the post-emergency-treatment baseline through 1 month after discharge.
Convenience sampling was used to identify eligible patients admitted with acute myocardial infarction (AMI). The same eligibility criteria and screening procedures were applied to all potential participants. Because convenience sampling may introduce selection bias, this potential source of bias was considered when interpreting the generalizability of the findings.
A total of 287 patients were screened, of whom 27 were not enrolled. Eight patients had experienced a previous myocardial infarction, six were unable to complete the study assessments because of impaired consciousness or cognitive function, five had other organic heart diseases, four had malignant tumors, multiple organ failure, or other severe systemic diseases, and four declined participation. The remaining 260 patients were enrolled in the study.
Eligibility criteria and baseline definition
Patients were included if they had an established clinical diagnosis of AMI, were experiencing their first episode of myocardial infarction, were aged ≥18 years, had intact consciousness and cognitive function sufficient to understand and complete the study assessments, and provided written informed consent. Patients with other organic heart diseases, malignant tumors, multiple organ failure, or other severe systemic organic diseases were excluded.
Enrollment was restricted to patients with first-onset myocardial infarction to reduce heterogeneity associated with previous infarction, prior revascularization, chronic post-infarction functional impairment, and pre-existing adaptations in self-care or rehabilitation, all of which could independently influence baseline nursing dependency and subsequent trajectory patterns.
T1 was defined as the time point following successful emergency treatment and recovery of consciousness, when the participant was able to complete the required assessments reliably.
Demographic and cardiovascular-related clinical data collection
A study-specific general information questionnaire was used to collect age, sex, body mass index (BMI), marital status, cardiac function classification, myocardial infarction type, reperfusion treatment strategy, and history of underlying diseases. Demographic and psychosocial information was obtained through questionnaire assessment and medical record review, as appropriate. Cardiovascular-related clinical characteristics, including cardiac function classification, myocardial infarction type, reperfusion strategy, and history of underlying diseases, were extracted from the medical records for the index hospitalization using predefined definitions. Cardiac function classification was extracted from the index-hospitalization medical record and grouped as Class I–II or Class III–IV for analysis. Myocardial infarction type was classified as ST-segment elevation myocardial infarction (STEMI) or non-ST-segment elevation myocardial infarction (NSTEMI) based on the diagnosis recorded during the index hospitalization. History of underlying diseases was coded dichotomously as no (0) or yes (1), with “yes” indicating that at least one predefined chronic comorbid condition was documented in the medical history.
Percutaneous coronary intervention (PCI) and thrombolytic therapy were recorded according to the treatment actually received during the index hospitalization rather than the intended treatment plan. The original continuous values for age and BMI were retained for statistical analysis.
Repeated nursing dependency assessment
The Care Dependency Scale (CDS5) was administered at T1. The scale contains 15 items. Each item was rated from 1 (completely dependent) to 5 (almost independent), yielding a total score ranging from 15 to 75. Higher scores indicated greater independence and lower nursing dependency. According to the established CDS classification, scores of 60–69 indicate a limited degree of care dependency, whereas scores of 70–75 indicate near independence; therefore, a total CDS score <70 was considered indicative of nursing dependency in the present study4,5.
The CDS assessment was repeated on day 3 after admission (T2), at discharge (T3), and 1 month after discharge (T4). The same instructions, item order, scoring rules, and assistance procedures were used across all assessments to minimize measurement inconsistency. The T4 assessment was conducted during the scheduled 1-month post-discharge follow-up, either in person at the outpatient clinic or by telephone when an in-person visit was not feasible. In both settings, a trained member of the research team administered all CDS items using the same standardized instructions, item order, and scoring criteria.
All 260 enrolled participants completed the CDS at all four time points, and no participants were lost to follow-up during the 1-month observation period.
Baseline psychosocial assessment
The 17-item Hamilton Depression Rating Scale (HAMD-17)6 was administered once at T1. Items 1–3, 7–11, 15, and 17 were scored from 0 to 4, whereas items 4–6, 12–14, and 16 were scored from 0 to 2. Item scores were summed to obtain a total score ranging from 0 to 54, with higher scores indicating more severe depressive symptoms.
The Generalized Anxiety Disorder-7 (GAD-7)7 was administered once at T1. Each of the seven items was scored from 0 (not at all) to 3 (nearly every day), resulting in a total score ranging from 0 to 21. Higher scores indicated more severe anxiety symptoms.
The Social Support Rating Scale (SSRS)8 was administered once at T1. The scale consisted of 10 items. Items 1–4 and 8–10 were rated on a 4-point scale from 1 to 4; item 5 was scored from 1 to 4 according to the reported level of support; and items 6 and 7 were scored according to the number of available sources of support. The total score ranged from 12 to 66, with higher scores indicating greater social support.
All CDS and psychosocial assessments were administered or supervised by trained members of the research team. Before participant enrollment, assessors received standardized training on questionnaire administration, item interpretation, permitted assistance, and scoring procedures. The same standardized instructions, item order, and scoring criteria were used throughout the study. The same assessor was not required to evaluate an individual participant at every time point; consistency across assessors was maintained through standardized training and uniform assessment procedures. Participants were asked to complete the questionnaires independently whenever possible. When participants experienced difficulties with reading, comprehension, or writing, standardized one-to-one assistance was provided without suggesting responses, interpreting items on the participant's behalf, or altering the participant’s responses.
Data quality control and missing-data handling
Before questionnaire administration, participants were informed about the study purpose, completion procedures, and confidentiality requirements. Standardized instructions and identical assessment procedures were used for all participants. Completed questionnaires were checked immediately for omitted or clearly invalid entries. When an item was left unanswered, the participant was asked to review the omitted item and, if willing, provide a response. When questionnaire assistance was required, study staff did not suggest, interpret, or supply responses on the participant’s behalf. Clinical variables were extracted using predefined definitions, and completed forms were verified before data entry.
All 260 participants completed the CDS assessments at T1–T4, with no loss to follow-up. Longitudinal CDS data and the demographic, clinical, and psychosocial variables included in the reported analyses were complete. Therefore, all 260 participants were included in the analyses, and no data imputation was required.
Growth mixture modeling of longitudinal CDS scores
Growth mixture modeling (GMM) was performed using Mplus version 8.3. An unconditional GMM without covariates was fitted, with CDS_T1, CDS_T2, CDS_T3, and CDS_T4 entered as continuous manifest variables.
One- through five-class solutions were fitted sequentially using robust maximum likelihood estimation (MLR). To reduce the risk of convergence to a local maximum, 1,000 random sets of starting values were generated, and the best 200 were retained for final-stage optimization. For each solution, normal termination, replication of the best log-likelihood across random starts, and the absence of inadmissible parameter estimates were confirmed.
The Akaike Information Criterion (AIC), Bayesian Information Criterion (BIC), sample-size-adjusted BIC (aBIC), entropy, Lo-Mendell-Rubin adjusted likelihood-ratio test (LMR-LRT), and bootstrap likelihood-ratio test (BLRT) were recorded for each solution. Lower AIC, BIC, and aBIC values were interpreted as indicating better relative model fit, whereas entropy values closer to 1 indicated clearer class separation.
Each k-class solution was compared with the corresponding k − 1 solution using the LMR-LRT and BLRT. The final model was not selected solely on the basis of decreasing information criteria; convergence stability, class size, posterior membership probabilities, parsimony, and clinical interpretability were also considered. Each participant was assigned to the class with the highest posterior membership probability, and class-specific average posterior probabilities were calculated as an additional measure of classification quality.
Analysis of repeated CDS measurements
To evaluate within-participant changes in CDS scores across T1, T2, T3, and T4 in the overall cohort, a one-way repeated-measures analysis of variance (RM-ANOVA) was performed with assessment time as the within-subjects factor. The assumptions of approximate normality and sphericity were assessed. Sphericity was evaluated using Mauchly's test, and Greenhouse–Geisser-corrected results were used when the sphericity assumption was violated. All tests were two-sided, and P < 0.05 was considered statistically significant.
Univariate comparisons across trajectory classes
Analyses other than GMM were performed using IBM SPSS Statistics version 26.0. Age, BMI, HAMD-17, SSRS, and GAD-7 scores were analyzed as continuous variables without categorization.
Approximately normally distributed continuous variables were expressed as mean ± standard deviation and compared across the four trajectory classes using one-way analysis of variance. Categorical variables were expressed as participant counts and compared using the Pearson chi-square test. All P values were two-sided, and P < 0.05 was used as the threshold for identifying variables for inclusion in the initial multivariable model.
In the univariate analysis, age, marital status, cardiac function classification, myocardial infarction type, PCI, thrombolytic therapy, HAMD-17 score, SSRS score, GAD-7 score, and history of underlying diseases met the P < 0.05 criterion and were therefore entered into the initial multivariable model. Sex and BMI did not meet this criterion.
Multinomial logistic regression and model diagnostics
The four trajectory classes were treated as a nominal outcome, and multinomial logistic regression was performed rather than binary logistic regression. C1 (High Independence-Slow Improvement) was designated as the reference outcome category.
All variables with P < 0.05 in the univariate analyses were included in the initial model. Backward likelihood-ratio selection was then applied, with variables showing P > 0.10 sequentially removed. Statistically meaningful main effects were retained in the final model.
Multicollinearity was assessed using tolerance and variance inflation factor (VIF) values. In the final analysis, tolerance values ranged from approximately 0.81 to 0.97, and VIF values ranged from 1.03 to 1.24, indicating no substantial multicollinearity.
Interaction testing was restricted to prespecified clinically plausible terms to reduce the risk of overfitting. Three prespecified interactions—age × history of underlying diseases, marital status × SSRS score, and HAMD-17 score × GAD-7 score—were evaluated individually using likelihood-ratio tests. The corresponding P values were 0.655, 0.301, and 0.908, respectively; therefore, none of the interaction terms were retained.
Overall model performance was evaluated using the likelihood-ratio test against the intercept-only model; Pearson and deviance goodness-of-fit tests; Cox-Snell, Nagelkerke, and McFadden pseudo-R2 statistics; classification accuracy; convergence; and assessment of complete or quasi-complete separation.
Adjusted odds ratios (ORs) with 95% confidence intervals (CIs) were reported for all final predictors for the C2 versus C1, C3 versus C1, and C4 versus C1 comparisons. Wide CIs were interpreted as indicating limited precision rather than definitive evidence of large effect sizes.
Sample-size considerations and reporting
No single universal sample-size threshold was applied to the GMM. Sample adequacy was considered in relation to model complexity, class proportions, class separation, missing-data patterns, entropy, posterior probabilities, and convergence9.
No formal a priori simulation-based power calculation was performed because the study was an exploratory longitudinal investigation based on the eligible population available during the predefined recruitment period. The final four-class solution comprised 66, 54, 90, and 50 participants and yielded an entropy value of 0.879, with average posterior probabilities ranging from 0.871 to 0.927.
For multinomial logistic regression, sample adequacy was assessed with respect to the number of participants in each outcome category and the number of candidate predictor parameters10. Because some trajectory classes were relatively small, the regression analysis was interpreted as an exploratory association analysis rather than as the development of a definitive prediction model.
The observational study was reported in accordance with the Strengthening the Reporting of Observational Studies in Epidemiology (STROBE) framework, including the study design, setting, participant flow, data sources, potential sources of bias, study size, statistical methods, missing data handling, main results, limitations, and generalizability.
Results
Participant flow and completeness
During the recruitment period, 287 patients with AMI were assessed for eligibility. Twenty-seven patients were not enrolled: eight had experienced a previous myocardial infarction, six were unable to complete the study assessments because of impaired consciousness or cognitive function, five had other organic heart diseases, four had malignant tumors, multiple organ failure, or other severe systemic diseases, and four declined participation. The remaining 260 participants entered the study, completed all four CDS assessments through 1 month after discharge, and were included in the final GMM and subsequent analyses. There were no missing longitudinal CDS values, no losses to follow-up, and no missing demographic, clinical, or psychosocial data requiring imputation in the reported analyses.
Selection of the four-class GMM
Fit indices progressively improved from the one-class to the four-class solution (Table 1). The four-class solution yielded AIC = 6978.826, BIC = 7047.822, aBIC = 6978.741, entropy = 0.879, LMR-LRT P = 0.027, and BLRT P < 0.001. The model-estimated class proportions were 25.8%, 21.0%, 34.1%, and 19.1%. When a fifth class was added, AIC, BIC, and aBIC decreased modestly to 6963.213, 7038.208, and 6962.613, respectively, and entropy increased to 0.912. However, neither the LMR-LRT (P = 0.128) nor the BLRT (P = 0.063) indicated a statistically significant improvement. In addition, the fifth class comprised only 6.4% of the sample. Therefore, the four-class model was retained because it provided the preferred balance of model fit, stability, parsimony, class size, and clinical interpretability.
Convergence and classification quality
The four-class solution terminated normally, and the optimal log-likelihood was replicated 18 times across random starts. No inadmissible parameter estimates were observed. The average posterior probabilities for most-likely class membership were 0.914 for C1, 0.889 for C2, 0.927 for C3, and 0.871 for C4, indicating acceptable class separation.
Overall nursing dependency over time
The overall mean CDS scores were 48.28 ± 10.25 at T1, 54.16 ± 14.33 at T2, 52.82 ± 12.17 at T3, and 56.58 ± 15.15 at T4. A one-way repeated-measures ANOVA showed a significant overall difference in CDS scores across the four assessment time points (F = 13.692, P < 0.001). At the group level, CDS scores increased by day 3, decreased modestly at discharge, and increased again by 1 month after discharge. The greater variability observed at later time points suggested that the overall mean pattern masked substantial heterogeneity among participants.
Trajectory patterns
Most likely, the class assignment identified four trajectories: C1, High Independence-Slow Improvement (n = 66, 25.4%); C2, Moderate Dependency-Rapid Deterioration (n = 54, 20.8%); C3, High Dependency-Significant Improvement (n = 90, 34.6%); and C4, High Dependency-Slow Aggravation (n = 50, 19.2%; Figure 1). Mean CDS scores for C1 were 55.50, 59.00, 60.00, and 64.00 at T1–T4, respectively; those for C2 were 50.00, 49.00, 39.00, and 39.00; those for C3 were 43.22, 59.35, 61.86, and 70.90; and those for C4 were 46.00, 44.00, 42.00, and 40.00.
Univariate class comparisons
Age differed significantly across C1–C4 (58.20 ± 7.80, 61.50 ± 7.40, 55.80 ± 7.60, and 63.10 ± 7.20 years, respectively; F = 12.572, P < 0.001; Table 2). BMI did not differ significantly across classes (23.60 ± 2.70, 23.40 ± 2.80, 23.80 ± 2.90, and 23.50 ± 2.60 kg/m2, respectively; F = 0.270, P = 0.847), and sex distribution was also similar (χ2 = 0.142, P = 0.986). Significant differences were observed for marital status (χ2 = 14.749, P = 0.002), cardiac function classification (χ2 = 15.283, P = 0.002), myocardial infarction type (χ2 = 15.035, P = 0.002), PCI (χ2 = 12.863, P = 0.005), thrombolytic therapy (χ2 = 15.622, P = 0.001), and history of underlying diseases (χ2 = 27.903, P < 0.001).
Mean HAMD-17 scores were 10.80 ± 2.70, 13.10 ± 2.90, 11.20 ± 2.60, and 14.10 ± 3.00 across C1–C4, respectively (F = 19.040, P < 0.001). Mean SSRS scores were 43.00 ± 4.80, 38.50 ± 5.00, 42.00 ± 4.90, and 36.80 ± 5.10, respectively (F = 20.742, P < 0.001), and mean GAD-7 scores were 9.50 ± 2.50, 12.10 ± 2.80, 10.00 ± 2.60, and 13.70 ± 3.00, respectively (F = 30.585, P < 0.001).
Final multinomial regression
Candidate predictors were coded as shown in Table 3. Backward likelihood-ratio selection retained age, marital status, HAMD-17, SSRS, GAD-7, and history of underlying diseases in the final multinomial logistic regression model (Table 4). For C2 versus C1, being married was associated with lower odds of C2 membership (adjusted OR = 0.241, 95% CI = 0.095–0.612, P = 0.003), whereas higher HAMD-17 scores (OR = 1.324, 95% CI = 1.121–1.564), higher GAD-7 scores (OR = 1.374, 95% CI = 1.160–1.626), lower SSRS scores (OR = 0.787, 95% CI = 0.711–0.871), and a history of underlying diseases (OR = 3.107, 95% CI = 1.212–7.968) were associated with C2 membership. Age was not statistically significant in this comparison (P = 0.089). For C3 versus C1, age was the only statistically significant retained predictor (OR = 0.954, 95% CI = 0.912–0.997, P = 0.036).
For C4 versus C1, older age (OR = 1.077, 95% CI = 1.005–1.154), unmarried status (married: OR = 0.248, 95% CI = 0.085–0.720), higher HAMD-17 scores (OR = 1.466, 95% CI = 1.214–1.772), lower SSRS scores (OR = 0.727, 95% CI = 0.646–0.819), higher GAD-7 scores (OR = 1.605, 95% CI = 1.318–1.955), and a history of underlying diseases (OR = 4.454, 95% CI = 1.511–13.134) were associated with C4 membership.
Model diagnostics
The final multinomial model provided a significant improvement over the intercept-only model (likelihood-ratio χ2 = 190.966, df = 18, P < 0.001). The Pearson (χ2 = 745.020, df = 759, P = 0.635) and deviance (χ2 = 515.576, df = 759, P > 0.999) goodness-of-fit tests did not indicate poor model fit. The Cox-Snell, Nagelkerke, and McFadden pseudo-R2 values were 0.520, 0.557, and 0.270, respectively, and classification accuracy was 53.1%. The model converged after seven iterations, with no evidence of complete or quasi-complete separation. Some estimates for a history of underlying diseases had relatively wide 95% CIs, indicating limited precision and supporting cautious interpretation of these associations.
DATA AVAILABILITY:
The raw data supporting the findings of this study are provided with the article as Supplementary File 1.
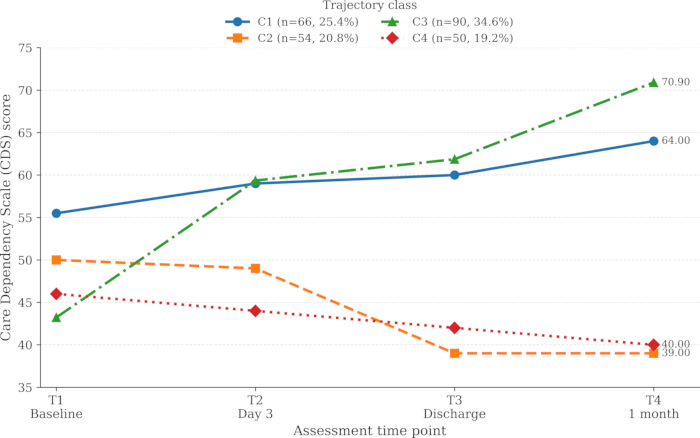
Figure 1: Longitudinal trajectories of nursing dependency in patients with acute myocardial infarction. The four latent trajectory classes identified by GMM were High Independence-Slow Improvement (C1, n = 66, 25.4%), Moderate Dependency-Rapid Deterioration (C2, n = 54, 20.8%), High Dependency-Significant Improvement (C3, n = 90, 34.6%), and High Dependency-Slow Aggravation (C4, n = 50, 19.2%). T1 represents baseline after successful emergency treatment and recovery of consciousness; T2 represents day 3 after admission; T3 represents discharge; and T4 represents 1 month after discharge. The y-axis represents the class-specific mean CDS score, with higher scores indicating greater independence and lower nursing dependency. Abbreviations: AMI = acute myocardial infarction; CDS = Care Dependency Scale; GMM = growth mixture modeling. Please click here to view a larger version of this figure.
| Model | AIC | BIC | aBIC | Entropy | LMR-LRT P value | BLRT P value | Class proportion (%) |
| 1 | 7353.11 | 7384.108 | 7355.567 | — | — | — | — |
| 2 | 7141.412 | 7184.409 | 7156.355 | 0.726 | 0.002 | <0.001 | 48.2/51.8 |
| 3 | 7032.275 | 7086.271 | 7049.704 | 0.813 | 0.015 | <0.001 | 35.1/42.7/22.2 |
| 4 | 6978.826 | 7047.822 | 6978.741 | 0.879 | 0.027 | <0.001 | 25.8/21.0/34.1/19.1 |
| 5 | 6963.213 | 7038.208 | 6962.613 | 0.912 | 0.128 | 0.063 | 29.7/31.2/20.4/12.3/6.4 |
Table 1: Fit indices for one- to five-class growth mixture models of nursing dependency trajectories. Lower information-criterion values indicate better relative model fit, whereas entropy values closer to 1 indicate clearer class separation. The LMR-LRT and BLRT compare a k-class model with the corresponding k − 1 model. Class proportions are model-estimated proportions; final participant counts and percentages are based on the most likely posterior class assignment. Abbreviations: AIC = Akaike Information Criterion; BIC = Bayesian Information Criterion; aBIC = sample-size-adjusted Bayesian Information Criterion; LMR-LRT = Lo-Mendell-Rubin adjusted likelihood-ratio test; BLRT = bootstrap likelihood-ratio test.
| Item | Classification | High Independence-Slow Improvement (C1) (n = 66) | Moderate Dependency-Rapid Deterioration (C2) (n = 54) | High Dependency-Significant Improvement (C3) (n = 90) | High Dependency-Slow Aggravation (C4) (n = 50) | Statistic | P value |
| Age (years) | − | 58.20 ± 7.80 | 61.50 ± 7.40 | 55.80 ± 7.60 | 63.10 ± 7.20 | 12.572 | <0.001 |
| Sex | Male | 43 | 35 | 58 | 31 | 0.142 | 0.986 |
| Female | 23 | 19 | 32 | 19 | |||
| BMI (kg/m²) | — | 23.60 ± 2.70 | 23.40 ± 2.80 | 23.80 ± 2.90 | 23.50 ± 2.60 | 0.27 | 0.847 |
| Marital status | Married | 46 | 24 | 64 | 25 | 14.749 | 0.002 |
| Unmarried / Divorced / Widowed | 20 | 30 | 26 | 25 | |||
| Cardiac function classification | Class I–II | 41 | 22 | 60 | 20 | 15.283 | 0.002 |
| Class III–IV | 25 | 32 | 30 | 30 | |||
| Myocardial infarction type | ST-segment elevation | 50 | 35 | 44 | 37 | 15.035 | 0.002 |
| Non-ST segment elevation | 16 | 19 | 46 | 13 | |||
| Percutaneous coronary intervention | Yes | 45 | 38 | 62 | 21 | 12.863 | 0.005 |
| No | 21 | 16 | 28 | 29 | |||
| Thrombolytic therapy | Yes | 52 | 49 | 66 | 29 | 15.622 | 0.001 |
| No | 14 | 5 | 24 | 21 | |||
| HAMD score | − | 10.80 ± 2.70 | 13.10 ± 2.90 | 11.20 ± 2.60 | 14.10 ± 3.00 | 19.04 | <0.001 |
| SSRS score | − | 43.00 ± 4.80 | 38.50 ± 5.00 | 42.00 ± 4.90 | 36.80 ± 5.10 | 20.742 | <0.001 |
| GAD-7 score | - | 9.50 ± 2.50 | 12.10 ± 2.80 | 10.00 ± 2.60 | 13.70 ± 3.00 | 30.585 | <0.001 |
| History of underlying diseases | Yes | 20 | 32 | 28 | 34 | 27.903 | <0.001 |
| No | 46 | 22 | 62 | 16 |
Table 2: Univariate analysis of characteristics across nursing dependency trajectory classes. Continuous variables are presented as mean ± standard deviation and were compared using one-way analysis of variance. Categorical variables are presented as participant counts and were compared using Pearson chi-square tests. All P values are two-sided overall comparisons across the four trajectory classes. Abbreviations: BMI = body mass index; HAMD-17 = 17-item Hamilton Depression Rating Scale; SSRS = Social Support Rating Scale; GAD-7 = Generalized Anxiety Disorder-7; PCI = percutaneous coronary intervention.
| Variable | Assignment Description |
| Age | Entered as original value |
| Marital Status | Unmarried/Divorced/Widowed = 0; Married = 1 |
| Cardiac Function Classification | Class Ⅰ, Ⅱ= 0; Class Ⅲ, Ⅳ = 1 |
| Infarction Type | Non-ST-segment elevation = 0; ST-segment elevation = 1 |
| Interventional Therapy | No = 0; Yes = 1 |
| Thrombolytic Therapy | No = 0; Yes = 1 |
| HAMD Score | Entered as original value |
| SSRS Score | Entered as original value |
| GAD-7 Score | Entered as original value |
| History of Underlying Diseases | No = 0; Yes = 1 |
Table 3: Coding of candidate predictors for multinomial logistic regression. Age, HAMD-17, SSRS, and GAD-7 were entered using their original continuous values. For dichotomous variables, the category coded as 0 served as the reference category: unmarried/divorced/widowed for marital status; cardiac function Class I–II; NSTEMI; no PCI; no thrombolytic therapy; and no history of underlying diseases. Abbreviations: HAMD-17 = 17-item Hamilton Depression Rating Scale; SSRS = Social Support Rating Scale; GAD-7 = Generalized Anxiety Disorder-7; NSTEMI = non-ST-segment elevation myocardial infarction; PCI = percutaneous coronary intervention.
| Group Comparison | Variable | β | SE | Wald χ² | P | Adjusted OR (95% CI) |
| C2 vs C1 | Age | 0.052 | 0.03 | 2.885 | 0.089 | 1.053 (0.992–1.118) |
| Married | −1.422 | 0.475 | 8.951 | 0.003 | 0.241 (0.095–0.612) | |
| HAMD-17 | 0.281 | 0.085 | 10.893 | <0.001 | 1.324 (1.121–1.564) | |
| SSRS | −0.240 | 0.052 | 21.236 | <0.001 | 0.787 (0.711–0.871) | |
| GAD-7 | 0.317 | 0.086 | 13.607 | <0.001 | 1.374 (1.160–1.626) | |
| Underlying diseases | 1.134 | 0.48 | 5.567 | 0.018 | 3.107 (1.212–7.968) | |
| C3 vs C1 | Age | −0.047 | 0.023 | 4.389 | 0.036 | 0.954 (0.912–0.997) |
| Married | 0.085 | 0.367 | 0.054 | 0.817 | 1.088 (0.531–2.233) | |
| HAMD-17 | 0.053 | 0.064 | 0.682 | 0.409 | 1.054 (0.930–1.195) | |
| SSRS | −0.048 | 0.034 | 1.982 | 0.159 | 0.953 (0.891–1.019) | |
| GAD-7 | 0.078 | 0.066 | 1.375 | 0.241 | 1.081 (0.949–1.231) | |
| Underlying diseases | 0.019 | 0.374 | 0.003 | 0.959 | 1.020 (0.490–2.123) | |
| C4 vs C1 | Age | 0.074 | 0.035 | 4.438 | 0.035 | 1.077 (1.005–1.154) |
| Married | −1.394 | 0.544 | 6.574 | 0.01 | 0.248 (0.085–0.720) | |
| HAMD-17 | 0.383 | 0.097 | 15.733 | <0.001 | 1.466 (1.214–1.772) | |
| SSRS | −0.318 | 0.06 | 27.91 | <0.001 | 0.727 (0.646–0.819) | |
| GAD-7 | 0.473 | 0.101 | 22.111 | <0.001 | 1.605 (1.318–1.955) | |
| Underlying diseases | 1.494 | 0.552 | 7.332 | 0.007 | 4.454 (1.511–13.134) |
Table 4: Multinomial logistic regression analysis of factors associated with nursing dependency trajectory membership. C1, High Independence-Slow Improvement, was specified as the reference outcome category. Adjusted ORs and 95% CIs are reported for C2 versus C1, C3 versus C1, and C4 versus C1. The final main-effects model was obtained using backward likelihood-ratio selection. The final model significantly improved over the intercept-only model (likelihood ratio χ2 = 190.966, df = 18, P < 0.001), with a Nagelkerke pseudo-R2 of 0.557 and an overall classification accuracy of 53.1%. Abbreviations: OR = odds ratio; CI = confidence interval; HAMD-17 = 17-item Hamilton Depression Rating Scale; SSRS = Social Support Rating Scale; GAD-7 = Generalized Anxiety Disorder-7.
Supplementary File 1: Raw data supporting the findings of this study.Please click here to download this file.
Discussion
The longitudinal changes in nursing dependency should be interpreted descriptively. At the full-cohort level, the mean CDS score was 48.28 ± 10.25 at T1, indicating substantial nursing care needs in the early phase after AMI11. The CDS score increased to 54.16 ± 14.33 at T2 during acute treatment and early recovery12, decreased modestly to 52.82 ± 12.17 at discharge, and increased again to 56.58 ± 15.15 at 1 month after discharge. Previous research has highlighted challenges related to participation in cardiac rehabilitation after AMI13; however, the present study did not directly assess whether participation in rehabilitation or other specific factors accounted for the observed temporal changes. Latent-class analysis further demonstrated that the overall mean pattern concealed four substantially different trajectories. This heterogeneity is broadly consistent with previous cardiovascular trajectory research, including health-related quality-of-life trajectories after AMI14 and self-care trajectories in patients with coronary heart disease15. Differences in the number and shape of classes across studies may reflect differences in the measured constructs, assessment schedules, patient populations, follow-up duration, and latent-class modeling approaches.
Several protocol steps are critical for reproducibility. First, T1 must be defined consistently. Baseline assessment should occur after successful emergency treatment and recovery of consciousness, as earlier assessment may capture transient clinical instability rather than a reliable functional state. Second, CDS administration should be standardized across all four time points because changes in instructions or assistance procedures could introduce artificial longitudinal differences. Third, baseline psychosocial assessments should be clearly distinguished from repeated CDS assessments. HAMD-17, GAD-7, and SSRS were administered once at T1, whereas the CDS was administered repeatedly at T1–T4. Finally, GMM should be fitted with sufficient random starts and evaluated by replicating the optimal log-likelihood, admissible parameter estimates, posterior probabilities, and clinically meaningful class sizes, rather than being selected solely on decreasing AIC or BIC values.
The selection of the four-class solution illustrates an important consideration in mixture modeling. Adding a fifth class modestly reduced the information criteria and increased entropy; however, the five-class solution did not demonstrate a statistically significant improvement according to either the LMR-LRT (P = 0.128) or BLRT (P = 0.063) and introduced a small subgroup comprising only 6.4% of the sample with limited additional clinical differentiation. In similar applications, every additional class should therefore not automatically be interpreted as a meaningful biological or clinical subgroup. A simpler solution should be reconsidered when a model produces a very small class, exhibits unstable convergence, yields an unreplicated optimal log-likelihood, produces implausible trajectories, or shows substantial changes in class composition in response to minor changes in starting values. Conversely, a statistically simpler model may be inappropriate if it conflates clinically distinct, well-separated longitudinal patterns.
The associated-factor analysis should be interpreted as exploratory rather than predictive or causal. Age showed class-specific associations with trajectory membership. Previous prospective studies in patients with AMI have identified older age as an important correlate of subsequent decline in health status and activities of daily living16,17. Marital status was also associated with trajectory membership, and a systematic review and meta-analysis have reported associations between marital or partner status and patient-reported outcomes after myocardial infarction18. Lower perceived social support has been associated with poorer health status and depressive symptoms after AMI19, while psychological distress after myocardial infarction is also clinically relevant20. Prospective evidence has further linked low perceived social support with poorer physical and mental health outcomes after AMI21. A history of underlying diseases was associated with several trajectory comparisons in the present study, and previous evidence has linked multimorbidity with functional impairment in patients with a history of AMI22. Nevertheless, the present analysis did not evaluate the physiological, behavioral, or psychosocial mechanisms underlying these associations. The findings should therefore not be interpreted as evidence that modifying these factors would necessarily alter trajectory-class membership.
This method has several limitations. The study was conducted at a single center using convenience sampling, which may have introduced selection bias and limited external validity. Only patients experiencing a first myocardial infarction were included; therefore, the identified trajectory structure may not generalize to patients with recurrent events. Follow-up ended 1 month after discharge, precluding assessment of whether the four trajectory classes remain stable over longer periods. Important cardiovascular variables, including left ventricular ejection fraction, Killip class, culprit vessel characteristics, procedural success, in-hospital complications, detailed medical therapy, B-type natriuretic peptide, exercise tolerance, and participation in structured cardiac rehabilitation, were not systematically incorporated. Residual confounding related to disease severity, treatment intensity, and rehabilitation status, therefore, cannot be excluded.
A further limitation concerns the precision of some class-specific regression estimates. No formal a priori simulation-based sample-size calculation was performed. Although the four-class GMM demonstrated stable convergence and satisfactory classification quality, some trajectory groups were relatively small. Wide confidence intervals for selected estimates, particularly those for a history of underlying diseases, should therefore be interpreted cautiously. Larger multicenter prospective cohorts with longer follow-up periods, more comprehensive cardiovascular phenotyping, and independent replication are needed to confirm the identified class structure and its associated factors. Despite these limitations, the combined repeated-CDS and GMM framework provides a practical approach for identifying heterogeneous early recovery patterns and may facilitate more individualized nursing assessment and follow-up in AMI populations.
Disclosures
The authors declare no competing interests. No artificial intelligence (AI) tools were used in the preparation, writing, editing, or generation of figures for this manuscript.
AUTHOR CONTRIBUTIONS:
All authors contributed to the conception and design of the study, data collection and interpretation, and preparation and revision of the manuscript. All authors reviewed and approved the final version of the manuscript and agree to be accountable for all aspects of the work
Acknowledgements
The authors thank the patients who participated in the study and the clinical staff who assisted with questionnaire administration, data collection, and follow-up. This research received no specific grant from any funding agency in the public, commercial, or not-for-profit sectors.
Materials
| Name | Company | Catalog Number | Comments |
|---|---|---|---|
| Care Dependency Scale (CDS) | Dijkstra A, Buist G, Dassen T | N/A | Original 15-item nursing-care dependency assessment scale; higher scores indicate greater independence. |
| Care Dependency Scale, Chinese version | Zhang SQ, Zhu YM, Li L, et al. | N/A | Chinese version/validation source cited in the manuscript and used to support the CDS application in this study. |
| General Information Questionnaire | Study team, Linquan County People’s Hospital | Study-developed; no catalog number | Study-specific form used to collect age, sex, BMI, marital status, cardiac function classification, MI type, reperfusion strategy, and history of underlying diseases. |
| Generalized Anxiety Disorder-7 (GAD-7) | Spitzer RL, Kroenke K, Williams JBW, Löwe B | N/A | Published 7-item anxiety scale administered once at baseline (T1). |
| Hamilton Depression Rating Scale, 17-item (HAMD-17) | Hamilton M | N/A | Published clinician-rated depression scale; the 17-item scoring approach was used at baseline (T1). |
| IBM SPSS Statistics | IBM Corp. | Version 26.0 | Statistical software used for descriptive statistics, one-way ANOVA, chi-square tests, and multinomial logistic regression. |
| IBM SPSS Statistics 26 Documentation | IBM Corp. | Version 26 documentation | Official documentation resource for IBM SPSS Statistics 26. |
| Mplus | Muthén & Muthén | Version 8.3 | Statistical software used to fit one- through five-class growth mixture models; Version 8.3 was released April 30, 2019. |
| Mplus User's Guide | Muthén & Muthén | Eighth Edition / Version 8 | Official Mplus Version 8 user documentation used as a methodological software resource. |
| Social Support Rating Scale (SSRS) | Xiao SY | N/A | Published 10-item Chinese social support scale administered once at baseline (T1). |
| STROBE Cohort Study Checklist | STROBE Initiative | Cohort-study checklist | Reporting checklist used to review completeness of the longitudinal observational study report. |
| STROBE Statement | STROBE Initiative | 2007 guideline | Reporting guideline for observational studies; used as a reporting resource for study design, participants, bias, statistical methods, results, and limitations. |
References
- Cai D, et al. Sex differences in outcomes in patients with acute myocardial infarction. BMC Cardiovasc Disord. 2025;25(1):272.
- Liu M, et al. A patient with acute myocardial infarction with electrocardiogram Aslanger's pattern. BMC Cardiovasc Disord. 2024;24(1):3.
- Yu F, Yuan X, Fu S. Optimizing emergency nursing protocols to enhance outcomes in patients with acute myocardial infarction: a retrospective study. Medicine (Baltimore). 2025;104(23):e41412.
- Guo J, Chen Y, Dai Y, Chen Q, Wang X. Influencing factors of care dependence in patients with coronary heart disease after percutaneous coronary intervention: a cross-sectional study. Nurs Open. 2023;10(1):241-251.
- Zhang SQ, Zhu YS, Li L, Ye WQ. Reliability and validity analysis of the Chinese version of the Care Dependency Scale for elderly patients. J Nurs Sci. 2014;29(3):7-9. [in Chinese].
- Li CQ, Zhong GK. Application of several commonly used mental health rating scales in psychiatry. Chin J Clin Rehabil. 2005;(12):34. [in Chinese].
- Spitzer RL, Kroenke K, Williams JBW, Löwe B. A brief measure for assessing generalized anxiety disorder: the GAD-7. Arch Intern Med. 2006;166(10):1092-1097.
- Xiao SY. The theoretical basis and research application of the Social Support Rating Scale. J Clin Psychiatry. 1994;4(2):98-100. [in Chinese].
- Muthén LK, Muthén BO. How to use a Monte Carlo study to decide on sample size and determine power. Struct Equ Modeling. 2002;9(4):599-620.
- Pate A, et al. Minimum sample size for developing a multivariable prediction model using multinomial logistic regression. Stat Methods Med Res. 2023;32(3):555-571.
- Shen Y, et al. Observation on the application effect of stressor perception and response meticulous nursing in the perioperative period of acute myocardial infarction. Altern Ther Health Med. 2024;30(1):63-67.
- Nakamura K, Ohbe H, Uda K, Fushimi K, Yasunaga H. Early rehabilitation after acute myocardial infarction: a nationwide inpatient database study. J Cardiol. 2021;78(5):456-462.
- Wang L, Liu J, Fang H, Wang X. Factors associated with participation in cardiac rehabilitation in patients with acute myocardial infarction: a systematic review and meta-analysis. Clin Cardiol. 2023;46(11):1450-1457.
- Munyombwe T, et al. Quality of life trajectories in survivors of acute myocardial infarction: a national longitudinal study. Heart. 2020;106(1):33-39.
- Ingadóttir B, Svavarsdóttir MH, Jurgens CY, Lee CS. Self-care trajectories of patients with coronary heart disease: a longitudinal, observational study. Eur J Cardiovasc Nurs. 2024;23(7):780-788.
- Hajduk AM, Dodson JA, Murphy TE, Chaudhry SI. A risk model for decline in health status after acute myocardial infarction among older adults. J Am Geriatr Soc. 2023;71(4):1228-1235.
- Hajduk AM, et al. Risk model for decline in activities of daily living among older adults hospitalized with acute myocardial infarction: the SILVER-AMI study. J Am Heart Assoc. 2020;9(19):e015555.
- Zhu C, Tran PM, Leifheit EC. Association of marital/partner status and patient-reported outcomes following myocardial infarction: a systematic review and meta-analysis. Eur Heart J Open. 2023;3(2):oead018.
- Leifheit-Limson EC, et al. The role of social support in health status and depressive symptoms after acute myocardial infarction: evidence for a stronger relationship among women. Circ Cardiovasc Qual Outcomes. 2010;3(2):143-150.
- Levine GN, et al. Post-myocardial infarction psychological distress: a scientific statement from the American Heart Association. Circulation. 2025;152(16):e298-e310.
- Bucholz EM, et al. Effect of low perceived social support on health outcomes in young patients with acute myocardial infarction: results from the VIRGO (Variation in Recovery: Role of Gender on Outcomes of Young AMI Patients) study. J Am Heart Assoc. 2014;3(5):e001252.
- Bagai A, et al. Multimorbidity, functional impairment, and mortality in older patients stable after prior acute myocardial infarction: insights from the TIGRIS registry. Clin Cardiol. 2022;45(12):1277-1286.