This protocol standardizes dialysis transition care for adults with uremic-stage chronic kidney disease by integrating eligibility screening, shared modality decision-making, initiation pathways for hemodialysis and peritoneal dialysis, early safety monitoring, and quality-improvement feedback.
Method Article
A Visual Protocol for Selecting, Initiating, and Monitoring Hemodialysis or Peritoneal Dialysis in Adults with Uremic-Stage Chronic Kidney Disease
In This Article
Summary
Abstract
Uremic-stage chronic kidney disease requires timely kidney replacement therapy, but the transition from advanced chronic kidney disease to hemodialysis (HD) or peritoneal dialysis (PD) is often fragmented. Late referral, incomplete modality education, delayed access planning, and insufficient early follow-up contribute to avoidable urgent starts, catheter exposure, hospitalization, and poor patient experience. This article describes a reproducible, visually demonstrable transition-care protocol for a hospital-based adult nephrology service. The workflow moves from eligibility screening and clinical urgency classification through balanced modality education, teach-back verification, and shared decision-making to modality-specific access planning, initiation, and early safety monitoring, and concludes with a monthly quality-improvement audit. Reviews at 7, 30, and 90 days feed a small set of predefined fidelity indicators back into that audit loop. The actions that can be filmed directly are completing the triage form, applying the modality decision matrix, verifying teach-back, working through the HD or PD initiation checklist, and reviewing the monthly quality dashboard. Implementation is illustrated with a locked, de-identified single-center dataset of 345 consecutive incident dialysis starts (305 HD, 40 PD), used to demonstrate protocol fidelity, access distribution, and early descriptive outcomes. The protocol is intended to make variation, emergency starts, access delays, and early complications visible and auditable. It is not a randomized comparison of HD and PD, it does not establish the superiority of either modality, and it does not replace clinical guidelines.
Introduction
Chronic kidney disease (CKD) is a major global health burden, and kidney failure requiring dialysis or transplantation represents one of its most complex endpoints1,2. For patients approaching uremic-stage CKD, the clinical challenge is not limited to declining kidney function; multiple time-sensitive decisions must be made within a constrained and often stressful period. Patients may present with fatigue, anorexia, pruritus, nausea, fluid overload, refractory hypertension, anemia, mineral-bone abnormalities, hyperkalemia, acidosis, or cognitive and functional decline. At the same time, clinicians must determine whether these findings are attributable to irreversible kidney failure, potentially reversible acute-on-chronic injury, active glomerular disease, heart failure, infection, medication exposure, or another concurrent illness. This complexity makes dialysis transition care vulnerable to fragmented assessment when a reproducible pathway is not used.
The timing of kidney replacement therapy should not be determined by a single estimated glomerular filtration rate (eGFR) threshold. Instead, it requires the simultaneous assessment of uremic symptoms, nutritional decline, refractory volume overload, hyperkalemia, metabolic acidosis, toxin-related complications, frailty, comorbidity, predicted kidney failure risk, access readiness, patient goals, and local service capacity3,4. The IDEAL trial and subsequent guideline discussions reinforced that planned early dialysis based solely on eGFR does not improve survival, whereas symptom-guided and preparation-focused transition care may reduce avoidable risk5. In routine practice, however, symptom-guided initiation can be difficult to implement consistently because stable outpatient referrals, hospitalized patients, and emergency presentations require different levels of education, access planning, and safety review.
HD and PD should be considered complementary modalities rather than competing endpoints. HD provides supervised solute and fluid removal and is often selected when rapid biochemical correction, staff-delivered treatment, or close intradialytic monitoring is required6,7. PD can support home-based therapy, autonomy, preservation of residual kidney function, and flexible scheduling8,9. Successful PD implementation also requires a suitable peritoneal cavity, reliable catheter placement, aseptic technique, adequate home storage, patient or caregiver training, and rapid access to the PD team10,11. Structured PD education and shared decision-making are therefore incorporated as explicit safety checkpoints12,13. Because both modalities may be clinically appropriate for many patients, modality selection should be documented as a shared decision that considers medical urgency, access feasibility, home conditions, caregiver support, health literacy, patient values, and a backup plan if the initial modality fails.
A standardized transition method is particularly relevant in high-volume regional nephrology units, where patients enter care through outpatient clinics, emergency departments, inpatient wards, and referrals from other hospitals. Existing guidance provides principles for dialysis initiation and modality selection, but these principles are not always translated into a stepwise, auditable, and visually demonstrable workflow that a multidisciplinary team can apply at the bedside. Patients with chronic glomerulonephritis may require dialysis planning while active disease status and immunosuppression remain under review14. For membranous nephropathy, contemporary trial evidence includes rituximab-, cyclosporine-, and cyclophosphamide-based approaches that may affect infection and access-planning decisions15,16. For ANCA-associated vasculitis, guideline and trial evidence support coordinating dialysis decisions with immunosuppression, glucocorticoid exposure, plasma exchange decisions, and other safety considerations17,18. The innovation of this protocol is not the creation of new dialysis indications, but the operationalization of existing transition-care principles into a visually demonstrable, role-defined, and auditable workflow with explicit safety checkpoints and early quality-feedback indicators.
The protocol is written for a hospital-based nephrology service that spans an outpatient CKD clinic, an inpatient nephrology ward, emergency and transfer admissions, an in-center HD unit, and a PD program with access to catheter placement and structured PD training. It is not intended for a stand-alone outpatient dialysis facility without inpatient backup, because the urgency classification and the access-coordination steps assume that unstable patients can be admitted and that access procedures can be scheduled locally. The intended users are nephrologists, dialysis nurses, access surgeons or interventionalists, PD trainers, data managers, and quality-improvement teams. The minimum infrastructure required to run the protocol in a smaller center is summarized at the end of the Discussion.
Two sets of terms are used throughout and are not interchangeable. Clinical urgency classification describes how quickly dialysis must begin and has three levels: planned, urgent, and crash. PD initiation technique describes how the peritoneal catheter is brought into use after placement and has two levels: conventional break-in and urgent-start PD. A patient classified as urgent on clinical grounds may still be initiated by conventional break-in, and a patient classified as planned may, in rare circumstances, be initiated by urgent-start PD. Both terms are recorded as separate fields in the case-report form.
Protocol
The study was conducted in accordance with the Declaration of Helsinki and was reviewed by the Ethics Committee of Guizhou Hospital of the First Affiliated Hospital, Sun Yat-sen University, which confirmed that the work complies with the applicable ethical regulations, involves no identifiable patient information, and is approved for publication (approval No. wz2026001, 23 June 2026). Individual informed consent was not required because the analysis used retrospective, aggregate, de-identified implementation data, and no identifiable patient-level information was accessed. The overall workflow for eligibility identification, triage, modality education, shared decision-making, modality-specific initiation, safety screening, and longitudinal follow-up is summarized in Figure 1. Table 1 maps each stage of the protocol to its approximate timing, its core action, and the corresponding filming sequence.
1. Human subjects, ethics, and data-governance preparation
- Before extracting any patient-level data or recording video, have the principal investigator create a project governance folder and record the approving ethics committee, the approval number, and the named responsible investigator.
- In the same folder, record the data-lock date, the list of permitted data elements, and the de-identification rule applied to each direct identifier.
CRITICAL STEP: The governance folder must be complete before the first extraction. Completion criterion: every field in the case-report form is marked either permitted or excluded, and no field is left unclassified. - Record the video-consent requirement as a separate entry from the data-use approval, and state which of the two applies to each planned filming scene.
- For video recording, prioritize six reproducible scenes: opening the de-identified triage form, completing the clinical urgency classification, demonstrating balanced modality education, verifying teach-back, working through the HD or PD initiation checklist, and reviewing the monthly quality dashboard. Use simulated materials or participants who have given written consent for publication of identifiable images, avoid protected health information, and keep the camera on reproducible actions such as opening the form, selecting a pathway, checking a box, documenting teach-back, and assigning a corrective action.
- Define the target population as adults aged 18 years or older with advanced CKD or kidney failure who are evaluated for maintenance HD, PD, pre-emptive transplantation, or conservative kidney management.
- Exclude patients whose acute kidney injury is expected to recover without maintenance dialysis, unless the local project explicitly studies the acute-to-chronic transition. Record an exclusion reason for every screened patient who is not entered into the registry.
- Build the secure case-report form before data collection begins. Include fixed fields for demographics, CKD etiology, comorbidities, laboratory values, uremic symptoms, education status, modality decision, access plan, dialysis start date, and initial prescription.
- Add fixed fields for complications and for the 7, 30, and 90 day outcomes. Use predefined response categories wherever possible, and reserve free-text fields for exceptions, unresolved barriers, and corrective actions.
- Lock the variable dictionary and assign a single owner to each field. Have the nephrologist verify eligibility and prescription, the nurses document education and training, the access coordinator record procedure milestones, and the data manager perform completeness checks before analysis.
PAUSE POINT: Do not begin data extraction until the variable dictionary is locked and each field has a named owner. Completion criterion for Section 1: the governance folder, the case-report form, and the locked variable dictionary all exist and carry the same version date.
2. Eligibility screen and clinical urgency classification
- Have the reviewing nephrologist open the de-identified triage form for every outpatient referral, inpatient consultation, emergency admission, and external transfer with possible uremic-stage CKD.
- On the triage form, record the referral source, the review date, the reviewer, the eGFR trigger, the symptom trigger, and the immediate safety status. Assign no pathway until all six fields are complete.
- Assess immediate dialysis indications before anything else. Treat any one of the following as a positive finding: hyperkalemia with electrocardiographic changes, pulmonary edema unresponsive to diuretics, uremic encephalopathy, uremic pericarditis, uncontrolled metabolic acidosis, or a toxin-related emergency.
- If any immediate indication is positive, classify the patient as urgent or crash on the clinical urgency scale and start stabilization or dialysis without waiting for the education steps. If all indications are negative, continue to step 2.6.
SAFETY NOTE: The six indications above are the operational definitions used by this protocol. They are adapted from the indications listed in current dialysis-initiation guidance4 rather than quoted verbatim from any single guideline, and each center should confirm them against local policy before use. - Do not delay life-saving dialysis to complete education steps. After stabilization, return to step 2.6 and complete the missed education, documentation, access planning, and follow-up components so that an emergency start does not become an undocumented long-term plan.
- Complete the reversible-factor section before declaring dependence on chronic maintenance dialysis. Mark each of the following as present, absent, or unknown: volume depletion, nephrotoxin exposure, urinary obstruction, active glomerulonephritis, infection, heart failure, medication-related hemodynamic decline, and acute kidney injury superimposed on CKD.
- If any factor is marked present, record the corrective action and the date on which the factor will be reassessed, and do not finalize the classification of irreversible kidney failure until that reassessment is documented. If all factors are absent, record the pathway as chronic maintenance dialysis.
TROUBLESHOOTING: If a factor is marked unknown at the first review, assign the missing investigation to a named clinician on the triage form and repeat step 2.6 within 72 h. An unknown entry that persists at the second review is escalated to the monthly audit as a documentation failure. - Assign the clinical urgency classification at the time of the first nephrology decision, using the following criteria.
- Planned: dialysis is expected to begin after the scheduled access is usable and after modality education has been completed.
- Urgent: dialysis must begin within days, before the definitive access is usable, but the patient is stable enough for a planned access procedure.
- Crash: dialysis must begin within hours through whatever access can be obtained immediately.
- Record the classification before stabilization, and repeat and record it after stabilization whenever the pathway changes. Record borderline cases, in which the treating team cannot separate urgent from crash at first contact, as crash and downgrade only after the poststabilization review; this convention prevents an unstable patient from being routed into a planned pathway.
CRITICAL STEP: Completion criterion for Section 2: the triage form carries a dated clinical urgency classification, a completed reversible-factor section with no unknown entries, and a named reviewer.
3. Structured modality education and shared decision-making
- Ensure that the nephrologist or the dialysis education nurse opens the scripted modality education checklist and reviews the four treatment options in a balanced, fixed sequence: HD, PD, transplantation, and conservative kidney management.
- For each of the four options, point to the corresponding checklist field and document the schedule, the access route, the home requirements, the common complications, the diet and fluid considerations, the travel or financial burden, the caregiver needs, and the rescue pathway if the first modality fails.
- Mark education as complete only when all four options carry an entry in every field. A checklist with any option left blank is treated as incomplete and is repeated.
- Before making a modality recommendation, ask the patient to state personal goals in their own words and record them on the checklist.
- Record work and family responsibilities, distance from the center, manual dexterity, vision, literacy, home cleanliness, storage space, caregiver availability, preference for home therapy, needle or procedure anxiety, and willingness to return for training.
- Place the decision matrix beside the education checklist during counseling. For each decision domain, mark exactly one of four actions: favors HD, favors PD, requires barrier correction, or requires a backup plan. The decision domains and the corresponding protocol actions are summarized in Table 2.
- Apply the following reading of the completed matrix. Favor HD when rapid solute or volume control is essential, when the home environment cannot support PD, when a major abdominal contraindication exists, or when the patient prefers staff-delivered treatment. Favor PD when the patient values home autonomy, has suitable peritoneal access conditions, retains residual kidney function, and can complete training safely.
- When any domain is marked as requiring barrier correction, name the barrier, the person responsible for correcting it, and the date of reassessment, and do not close the decision until each named barrier is either corrected or recorded as uncorrectable.
- Perform teach-back as a formal safety checkpoint. Ask the patient or caregiver to describe, in their own words, the following: the chosen modality, the access procedure, the daily or weekly treatment commitment, the warning symptoms, and the follow-up contact pathway.
- Score each of the five elements as passed or not passed using the criteria in Table 3. Mark teach-back as complete only when all five elements are passed; record which element failed and repeat the corresponding education step otherwise.
- If teach-back fails twice, apply the secondary routing rules in Table 3: transfer to a caregiver-led training pathway when a competent caregiver is available and consents, route to assisted PD or in-center HD when no caregiver is available, and re-open the conservative kidney management discussion when repeated failure reflects advanced cognitive decline and the patient or surrogate wishes to reconsider dialysis.
PAUSE POINT: The modality decision is not finalized until teach-back is recorded as passed, or until a secondary routing decision from step 3.11 is recorded with the reason. - Enter the shared decision into the medical record using the structured note template. State the available options, the clinical factors, the patient goals, the final modality, the backup modality, the access plan, the expected start date, and any unresolved barriers.
- Completion criterion for Section 3: another clinician can read the note and understand the decision without having to repeat the counseling session.
4. Hemodialysis initiation pathway
- Request vascular access evaluation at the same clinic visit at which maintenance HD becomes the working plan. Record the referral date on the access planning form.
- Protect the non-dominant forearm from the moment HD is considered. Mark the potential access arm in the record, and instruct ward and phlebotomy staff to avoid venipuncture, intravenous cannulation, and peripherally inserted central catheters in that arm.
CRITICAL STEP: Vein preservation must be ordered before, not after, the first admission. Once the potential access arm has been used for a peripherally inserted central catheter, an arteriovenous fistula in that limb is frequently no longer feasible. - Select the access type with the access surgeon or interventionalist using six recorded inputs: the patient life-plan, the clinical urgency classification, vessel anatomy on ultrasound mapping, expected dialysis duration, cardiac function, and patient preference. Choose one from arteriovenous fistula, arteriovenous graft, tunneled catheter, or temporary catheter.
- Record the referral date, the procedure date, the access type, the date on which cannulation is judged ready, and any complication on the access planning form. Allow at least 4 weeks between fistula creation and first cannulation assessment, and at least 2 weeks for exit-site or wound healing before a tunneled catheter is used for a full prescription, unless an earlier start is clinically unavoidable and the reason is recorded.
- For urgent HD without usable arteriovenous access, place a tunneled catheter rather than a temporary catheter whenever the expected duration of catheter dependence exceeds 1 week, and the patient is stable enough for a tunneled procedure.
- Use a temporary catheter only when dialysis is required within hours, and no tunneled placement slot is available. On the day of insertion, record the reason for the temporary catheter using one of five fixed categories: referral less than 90 days before initiation; arteriovenous access referred but not yet usable; no access procedure slot available; patient declined definitive access; clinical instability precluding tunneled placement.
- Convert every temporary catheter to a tunneled catheter or to arteriovenous access within 14 days of insertion when clinically feasible. Ensure that the access coordinator reviews all temporary catheters in situ once weekly and escalates any catheter still in place at 21 days to the monthly audit with a named corrective action.
SAFETY NOTE: Temporary catheter exposure is treated as a system indicator, not as an individual clinical failure. The five reason categories in step 4.6 make the monthly audit actionable, because corrective actions differ for a referral delay, a capacity constraint, and a patient decision. - Prescribe the first three HD sessions conservatively for patients who are older, frail, severely uremic, or classified as a crash start. Shorten the initial session, reduce blood flow, limit ultrafiltration, and reassess between sessions.
- When an incremental prescription is used, record the rationale and the specific triggers for escalation, such as persistent uremic symptoms, inadequate volume control, hyperkalemia, or loss of residual urine output.
- Complete the HD initiation checklist before and after each of the first three sessions. Record pre- and post-dialysis weight, blood pressure trend, ultrafiltration target and achieved volume, access function, anticoagulation, electrolytes, symptoms, and adverse events.
- Trigger same-day physician review for any of the following: access dysfunction, fever, persistent hypotension, failure to deliver the prescribed treatment, or recurrent intradialytic symptoms.
PAUSE POINT: Completion criterion for Section 4: the access planning form and three completed initiation checklists are present in the record, and any triggered physician review carries a documented outcome.
5. Peritoneal dialysis initiation pathway
- Confirm PD eligibility and record each relative contraindication as present or absent: prior extensive abdominal surgery, active inflammatory bowel disease, untreated abdominal wall hernia, severe malnutrition, ostomy, inadequate home hygiene, cognitive impairment, inability to train, and absence of caregiver support when caregiver support is required.
- Treat every modifiable barrier before excluding PD. Name the barrier, the responsible person, and the reassessment date, and record PD as excluded only when a barrier is documented as uncorrectable.
- Plan catheter insertion with the access team and record the catheter type, the insertion technique, the antibiotic prophylaxis, the planned insertion date, and the break-in plan before training or initiation begins.
- Choose the PD initiation technique and record it as a separate field from the clinical urgency classification.
- Use conventional break-in, with at least 14 days between insertion and full-volume exchanges, as the default.
- Use urgent-start PD, with low-volume supine exchanges beginning within 24–72 h of insertion, only when all six of the following conditions are met: no indication requiring solute or volume removal within hours; no major abdominal contraindication from step 5.1; a catheter can be placed within 72 h; the patient or caregiver can attend training, or an assisted-PD pathway is available; home and storage conditions can be verified within 2 weeks; and the patient consents to home therapy.
- If any condition in step 5.4 is not met, start HD through a tunneled catheter and re-evaluate the patient for PD at the 30-day review rather than abandoning PD.
CRITICAL STEP: The decision in step 5.4 is the point at which clinical urgency and PD technique must be kept apart. An urgent patient with a suitable abdomen and available catheter slot is eligible for urgent-start PD; an urgent patient who fails any single condition is routed to tunneled-catheter HD, not to an accelerated PD break-in. - Mark the proposed exit site with the patient both standing and sitting. Confirm that the site is visible to the patient, clear of the belt line and skin folds, and reachable with the hand that will perform exit-site care.
- Record the final exit-site position and any barrier requiring correction before insertion.
- Deliver PD training as a sequence of observable tasks from the structured syllabus: hand hygiene, mask use, connection preparation, the exchange sequence, exit-site care, fluid-balance recording, supply storage, and emergency contact procedures.
- Observe the patient or caregiver performing an unassisted exchange, correct each technique error at the moment it occurs, and repeat the task until one complete exchange is performed safely without prompting.
TROUBLESHOOTING: If an unassisted exchange cannot be completed after two full training cycles, apply the routing rules in Table 3 and record the outcome as caregiver-led training, assisted PD, or transfer to in-center HD. - Prescribe PD to clinical goals rather than to small-solute targets alone. Record residual urine volume, volume status, symptoms, nutritional status, serum potassium, bicarbonate, phosphate, achieved ultrafiltration, peritoneal membrane function when available, and treatment burden.
- Reassess and, if needed, revise the prescription at 1–2 weeks and again at the 30 and 90 day reviews.
6. Integrated glomerulonephritis and immunosuppression safety review
- For chronic glomerulonephritis, record the disease-activity status as one of four fixed categories: treatment ongoing, treatment recently completed, treatment contraindicated, or no longer clinically relevant because kidney failure is chronic and irreversible.
- Keep the disease-activity decision separate from the dialysis-timing decision, and record the two on separate lines of the safety dashboard so that neither is deferred while the other is discussed.
- For membranous nephropathy, record the proteinuria trend, serum albumin, anti-phospholipase A2 receptor antibody status when available, thrombotic risk, prior immunosuppression, and the planned glucocorticoid-, cyclophosphamide-, or rituximab-based regimen.
- For ANCA-associated vasculitis, classify the disease as new-onset, relapsing, refractory, or burned-out chronic kidney failure.
- Record pulmonary hemorrhage, biopsy activity, and chronicity when available, the induction regimen, infection prophylaxis, and vaccination status.
- Use this section as a dialysis-transition safety screen and not as a disease-treatment guideline. Before any access procedure, and again before any change in immunosuppression, check and record active infection, hepatitis B serology, tuberculosis screening, total leukocyte and absolute neutrophil counts, cumulative cyclophosphamide exposure, and fertility counseling when relevant.
- Defer elective access surgery or PD catheter insertion when the total leukocyte count is below 3.0 × 10⁹/L or the absolute neutrophil count is below 1.5 × 10⁹/L, and recheck the count within 7 days.
- Schedule access surgery outside the expected cytopenic nadir after an intravenous cyclophosphamide pulse, which usually occurs 10–14 days after the infusion, and place access either at least 2 weeks before or at least 4 weeks after a rituximab infusion, where the clinical situation allows.
- When the prednisone-equivalent dose exceeds 20 mg/day, prefer a tunneled catheter over immediate arteriovenous cannulation, and allow the full 14 day conventional PD break-in rather than an urgent-start break-in. Impaired wound healing is the reason for both choices.
- When rituximab, cyclophosphamide, or high-dose glucocorticoids are used, review vaccination status, antimicrobial prophylaxis, access timing, wound healing, and early fever-response instructions with the dialysis team, and record the date of that review.
SAFETY NOTE: The thresholds and intervals in steps 6.7–6.9 were adopted by the study center from current guidance on glomerular disease and ANCA-associated vasculitis14,17 rather than from any institution-specific policy. They are guideline-derived operational defaults for this protocol, not externally validated cut-points. Each center should ratify or replace them before implementation and should record the version in use.
7. Longitudinal monitoring and quality-control loop
- Perform the 7 day review after initiation. Confirm the actual modality, access function, the delivered prescription, adverse events, medication reconciliation, residual urine output, and volume status.
- At the same visit, re-check the patient's understanding of warning symptoms and of the contact pathway, and record the result as passed or repeated.
- Perform the 30-day review. Record hospitalization, infection, access procedures, missed dialysis sessions, biochemical control, the anemia plan, mineral and bone parameters, nutritional assessment, blood pressure, and patient-reported burden.
- Revise the prescription at this visit when symptoms, volume status, or residual kidney function indicate over- or under-treatment, and record the reason for any change.
- Perform the 90 day review and classify the outcome as modality persistence, death, transfer, transplantation, catheter dependence, peritonitis, bacteremia, access dysfunction, or hospitalization, and record patient satisfaction.
- Record dialysis-related infection with the site and the organism, and classify each episode as catheter-related bloodstream infection, exit-site or tunnel infection, peritonitis, or other.
NOTE: Recording the site prospectively allows the audit to distinguish access-driven infection from other sources. - Hold a monthly audit meeting and display the predefined indicators on a single dashboard: modality education completion, shared decision documentation, planned starts, temporary catheter exposure, baseline infection screening, PD training completion, 7 and 90 day review completion, infection events, hospitalization review, and 90 day outcomes.
NOTE: The indicators, thresholds, data sources, and corrective actions are listed in Table 4, and the workflow failures most often responsible for missed thresholds, along with their corrective actions and responsible roles, are listed in Table 5. - Stratify temporary catheter starts by the five reason categories recorded in step 4.6, and select the corrective action that matches the dominant category rather than the overall rate.
- Choose exactly one corrective action per month, assign one named owner and one reassessment date, and remeasure the same indicator at the next meeting.
PAUSE POINT: Completion criterion for Section 7: each month's dashboard carries one corrective action, one owner, and one reassessment date, and the previous month's action carries a recorded result.
8. Statistical reporting plan
- Extract a locked, de-identified dataset from the hospital information system, the dialysis unit registry, the access procedure log, and the PD training record, using the same inclusion window and the same denominator definitions across every table and figure. Maintain a data audit trail that records the extraction date, the responsible reviewer, the cleaning rules, and the source used to resolve any discrepancies among registry, procedure, and hospitalization records.
- Define primary implementation indicators before analysis, including modality education completion, teach-back documentation, shared decision documentation, planned initiation, access-plan documentation, baseline infection screening, temporary HD catheter exposure, PD training completion, 7 day review completion, 30 day hospitalization, 90 day infection, 90 day follow-up completion, and 90 day modality persistence.
- Use descriptive statistics as the main analysis, because this is a methods protocol. Report means with standard deviations, medians with interquartile ranges, and counts with percentages.
- Label every HD-versus-PD contrast as exploratory and describe it in neutral language. Do not perform or report significance testing between modalities, because modality assignment is clinically determined and the two groups differ systematically in age, residual kidney function, comorbidity, and urgency at presentation.
- Address missing data explicitly. Report the denominator for every indicator, describe the known mechanism of missingness, and avoid best-case imputation.
- Run a sensitivity check that treats every missing 90 day outcome as not completed for the key indicators, and report both the primary and the sensitivity value.
- Report transfer, death, and follow-up at another institution as separate categories, so that an incomplete review is never counted as successful modality persistence.
- Generate all figures, tables, and reconciliation worksheets from the same source-data worksheet, and record the numerator and denominator for every reported indicator in that worksheet.
- Label the dataset consistently as real-world, de-identified implementation data.
NOTE: Do not describe any figure or table as a demonstration, a simulation, or a replaceable example, because every value reported here is drawn from the locked clinical dataset.
Results
The locked, de-identified dataset comprised 345 consecutive adults who initiated maintenance dialysis at the study center, a single tertiary nephrology service, between 1 January 2025 and 31 May 2025; 305 initiated HD and 40 initiated PD. June 2025 was the data-lock point and is not displayed as a complete monthly observation. All patients in the dataset started dialysis, so the cohort describes incident dialysis starts rather than all patients screened in the pathway. Patients who proceeded to pre-emptive transplantation, conservative kidney management, or exclusion before dialysis initiation during the same window were not captured because the extraction was defined at the point of dialysis initiation. Baseline, initiation, and early implementation characteristics are summarized in Table 6, and the distribution by CKD etiology and initial modality is shown in Figure 2. The variable definitions, numerators, and denominators underlying the values reported in this section are given in Supplementary File 1.
The mean age was 57.8 years, 59.1% of patients were male, and the median eGFR at pathway entry was 6.3 mL/min/1.73 m2. Chronic glomerulonephritis accounted for 141 patients (40.9%), diabetic kidney disease for 106 (30.7%), hypertensive nephrosclerosis for 51 (14.8%), and other or unknown etiology for 47 (13.6%). Patients who started PD were younger on average, more often retained residual urine output above 500 mL/day (82.5% versus 44.6%), and more often had a planned start, whereas patients who started HD more often had urgent biochemical or volume indications. Because these differences reflect clinical selection, HD and PD are reported throughout as clinically selected pathways and not as comparable treatment groups.
Protocol fidelity, not modality superiority, is the primary result. Modality education was documented for 331 of 345 patients (95.9%), shared decision-making for 326 (94.5%), access planning for 318 (92.2%), baseline infection screening for 340 (98.6%), and 90-day follow-up for 319 (92.5%). Planned initiation occurred in 268 patients (77.7%), urgent initiation in 54 (15.7%), and crash initiation in 23 (6.7%). Monthly values for protocol checklist completion, shared decision documentation, planned dialysis start, and unplanned urgent or crash start are shown in Figure 3. Each monthly value uses that month's incident-start count as its denominator; because the monthly denominators were unequal, the monthly values are not expected to average to the whole-cohort percentages in Table 6. Follow-up completion and modality persistence are reported as separate indicators: follow-up completion measures whether the transition review took place, whereas modality persistence is calculated against all patients who started each modality.
Access distribution shows how the method separates clinical necessity from system delay. Among the 305 HD patients, 200 (65.6%) had usable arteriovenous access (an established arteriovenous pathway), 27 (8.9%) had a tunneled catheter, and 78 (25.6%) had a temporary catheter. Among the 40 PD patients, 28 (70.0%) were initiated on conventional break-in, and 12 (30.0%) on urgent-start PD with low-volume or supine exchanges after a shortened break-in. The PD initiation technique is recorded independently of the clinical urgency classification, so a patient deemed urgent at triage is not automatically classified as an urgent-start PD initiation.
Early outcomes are reported to show how the protocol should be read, not to compare modalities. Thirty-day all-cause hospitalization occurred in 44 of 305 HD patients (14.4%) and 4 of 40 PD patients (10.0%). Dialysis-related infection within 90 days occurred in 18 HD patients (5.9%) and 1 PD patient (2.5%). The PD group included one catheter leak as a non-infectious early complication. The locked dataset recorded dialysis-related infection as a single composite implementation indicator and did not capture infection site, organism, or catheter-related bloodstream infection adjudication; therefore, the 18 HD infection events cannot be subclassified retrospectively as catheter-related bacteremia or non-catheter infection. Site-specific classification has been added prospectively as protocol step 7.6. Ninety-day modality persistence was 90.8% in HD, and 92.5% in PD, and 90-day mortality was 2.3% overall (8 of 345), 2.6% in HD (8 of 305), and 0% in PD (0 of 40), occurring in older patients who presented with urgent or crash indications together with cardiovascular disease or severe infection. No inference about the relative safety of HD and PD should be drawn from these differences.
In practical terms, these values indicate whether the pathway functions as intended: most patients should receive education before or shortly after initiation, modality decisions should be documented, access plans should be visible, and early complications should trigger a documented corrective review. A positive protocol result is not maximal PD use or minimal HD use. It is a transparent, clinically appropriate, patient-centered modality decision accompanied by timely access, safe initiation, and completed early follow-up.
All data supporting the conclusions of this article are contained within the article and in Supplementary File 1. Supplementary File 1 contains the data dictionary; the indicator reconciliation worksheet, which provides the numerator and denominator for every indicator reported in Table 4 and Table 6; the etiology-by-modality counts underlying Figure 2; and the monthly indicator values underlying Figure 3. No new sequence, structure, or other data requiring deposition in a public repository were generated in this study. No further aggregate data exist beyond those provided here. Monthly incident-start counts were not retained as separate fields in the locked export, so worksheet 4 reports the monthly indicator values underlying Figure 3 without their individual denominators; prospective use of step 8.8 records the numerator and the denominator for every monthly value.
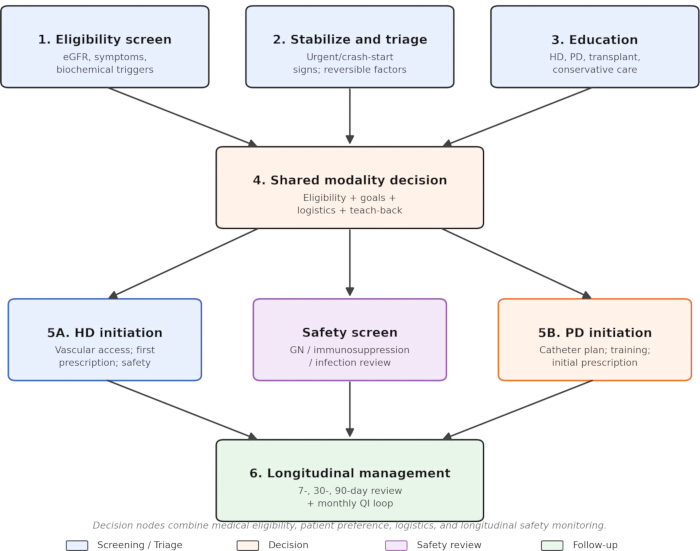
Figure 1. Protocol workflow for selecting, initiating, and monitoring dialysis in uremic-stage CKD. The schematic shows eligibility identification, stabilization, and assignment of the clinical urgency classification (planned, urgent, or crash), structured education and teach-back, shared modality decision-making, the modality-specific HD and PD initiation bundles, the combined glomerulonephritis and immunosuppression safety review, the 7, 30, and 90 day reviews, and the monthly quality-improvement feedback loop. The clinical urgency classification shown here is distinct from the PD initiation technique (conventional break-in or urgent-start PD), which is recorded separately at protocol step 5.4. Abbreviations: CKD = chronic kidney disease; HD = hemodialysis; PD = peritoneal dialysis. Please click here to view a larger version of this figure.
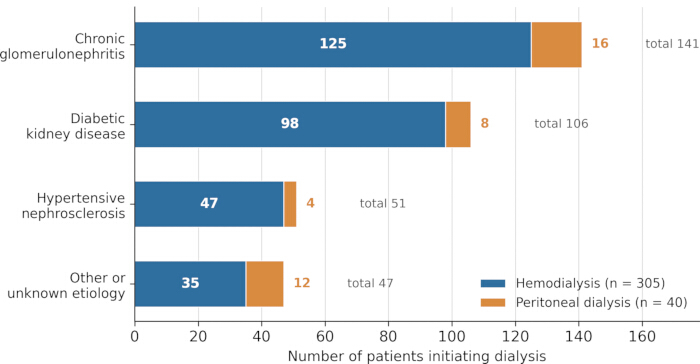
Figure 2. Cohort distribution by CKD etiology and initial dialysis modality. Values are shown for 305 HD starts and 40 PD starts from the locked, de-identified real-world implementation dataset. Etiology is reported in four mutually exclusive categories matching the source-data worksheet and Table 6: chronic glomerulonephritis, diabetic kidney disease, hypertensive nephrosclerosis, and other or unknown etiology. Abbreviation: QI = quality improvement. Please click here to view a larger version of this figure.
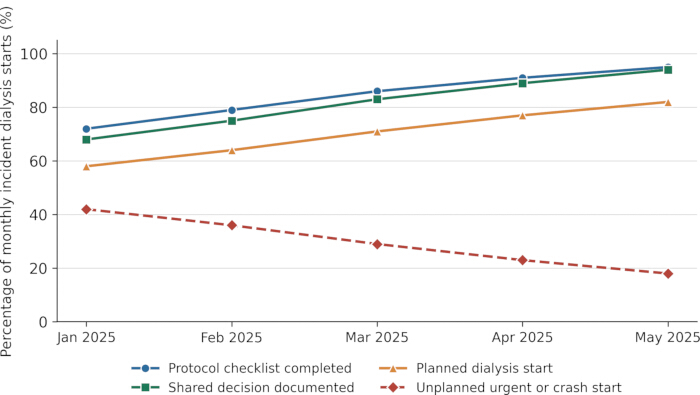
Figure 3. Monthly quality indicators during protocol implementation, January to May 2025. Lines show the percentage of each month's incident dialysis starts with protocol checklist completion, shared decision documentation, planned dialysis start, and unplanned urgent or crash start. Each percentage uses that month's incident-start count as the denominator. Monthly denominators were unequal, so the monthly values do not average to the whole-cohort percentages in Table 6, which are calculated across the entire locked dataset. June 2025 was the data-lock point and is not displayed as a complete monthly observation. Please click here to view a larger version of this figure.
| Stage | Approximate timing | Core action | Suggested JoVE visual |
| Governance | Before extraction or filming | Confirm ethics pathway, consent requirements, data lock, de-identification rules, and filming-safe forms | Show the de-identified registry template, variable dictionary, and filming-safe forms |
| Eligibility and triage | Same day as referral | Complete triage form and assign the clinical urgency classification (planned, urgent, or crash) | Film completion of the triage checklist, reversible-factor screen, and urgency-category selection |
| Education and decision | Same day to 7 days if stable | Explain HD, PD, transplant, and conservative kidney management; document teach-back and patient goals | Film decision matrix discussion and teach-back verification in the patient or caregiver's own words |
| HD pathway | Before first 3 sessions | Plan access, prescribe conservative initial sessions when needed, and complete HD safety checks | Show access plan and HD initiation checklist |
| PD pathway | Before and after catheter placement | Assess home readiness, train exchange technique, and set the PD initiation technique (conventional break-in or urgent-start PD) | Show hand hygiene, connection technique, and PD training checklist |
| GN/immunosuppression safety | Before access or immunosuppression change | Coordinate dialysis access with infection screening, vaccination, prophylaxis, and immunosuppression timing | Show de-identified safety dashboard; emphasize that it is a transition-safety screen, not a treatment guideline |
| Follow-up and audit loop | 7, 30, and 90 days; monthly audit | Review complications, access status, adherence, outcomes, and one corrective action per audit cycle | Show monthly dashboard, assigned owner, corrective action, and next-cycle remeasurement plan |
Table 1: Protocol overview, timing, and suggested filming sequence. This table identifies the most visually demonstrable steps for video production and links each scene to a reproducible action. Abbreviations: CKD = chronic kidney disease; HD = hemodialysis; PD = peritoneal dialysis; QI = quality improvement.
| Decision domain | Findings favoring HD | Findings favoring PD | Protocol action |
| Immediate safety | Life-threatening hyperkalemia, pulmonary edema, uremic encephalopathy, severe acidosis | Stable patient without emergency indication | Treat emergency first; complete education after stabilization |
| Volume and solute burden | Need for rapid ultrafiltration or high early clearance | Gradual symptoms with residual kidney function | Start with conservative HD or individualized PD |
| Access feasibility | Usable fistula/graft, feasible catheter access, unsuitable abdomen | Suitable abdomen, reachable exit site, catheter team available | Schedule access and backup plan |
| Home and caregiver capacity | Unsafe home, no storage, inability to train, or preference for staff-delivered care | Clean exchange area, storage capacity, patient ability, or caregiver support | Perform teach-back and PD readiness checklist |
| Comorbidity and anatomy | Major adhesions, ostomy, severe hernia, or need for close monitoring | Needle anxiety, travel burden, home autonomy, or hemodynamic intolerance | Discuss relative contraindications and modifiable barriers |
| Glomerulonephritis treatment | Profound immunosuppression may increase catheter or access risk | PD feasible if infection risk is controlled and training is safe | Coordinate access timing with steroids, cyclophosphamide, or rituximab |
| Patient goals | Prefers in-center professional delivery or cannot assume daily tasks | Prefers home-based care and flexibility | Document final and backup modality |
| Monitoring need | High hemodynamic, access, or infection-monitoring need | Stable symptoms and reliable self-monitoring | Assign 7-, 30-, and 90-day reviews |
Table 2: Modality selection and initiation decision matrix. This table summarizes safety, access, home, comorbidity, immunosuppression, and patient-goal factors used to select HD or PD and define the next protocol action. Abbreviations: HD = hemodialysis; PD = peritoneal dialysis.
| Scored as passed when | Scored as not passed when | Action on the first failure | Action on a second failure |
| The modality is named correctly and at least one personal reason is given in the patient's own words | The modality is named only after prompting, or the patient repeats the clinician's words without any personal reason | Repeat protocol step 3.1 for the chosen modality and the closest alternative, then rescore | Transfer to a caregiver-led pathway if a competent caregiver is available and consents; otherwise re-open the option discussion with the patient and family present |
| The site and the protective behavior are both stated correctly | The patient cannot state the site, or states a protective behavior that would endanger the access | Repeat protocol step 4.2 or step 5.6 using the marked site on the patient's own body, then rescore | Provide a written and pictorial access-care card, involve the caregiver in the repeat session, and notify the access coordinator |
| Frequency, duration, and location are all stated correctly | Any one of frequency, duration, or location is stated incorrectly | Repeat protocol step 3.2 using a written weekly schedule, then rescore | Reassess feasibility of the chosen modality; route to assisted PD or in-center HD if the commitment cannot be sustained |
| Three or more correct symptoms are named without prompting, at least one of them modality-specific | Fewer than three symptoms are named, or no modality-specific symptom is named | Repeat protocol step 3.2 using the warning-symptom card, then rescore | Give the caregiver the warning-symptom card, confirm the caregiver can state the symptoms, and record caregiver-led escalation in the note |
| The contact route and the time frame are stated correctly for both in and out of hours | Only the in-hours route is known, or no time frame is given | Repeat protocol step 3.2 and issue the contact card, then rescore | Record the contact card as issued to the caregiver and schedule a telephone check before the planned start date |
| All five elements passed. Teach-back is recorded as verified and the modality decision may be finalized (protocol step 3.10) | Any element not passed. Teach-back is recorded as not verified and the decision is not finalized | Repeat only the failed element or elements; do not repeat the whole session | Apply the secondary routing rules of protocol step 3.11: caregiver-led training, assisted PD or in-center HD, or, when repeated failure reflects advanced cognitive decline and the patient or surrogate wishes to reconsider dialysis, a renewed conservative kidney management discussion. Record which route was taken and why |
Table 3: Teach-back pass criteria and routing for repeated failure. This table specifies what the patient or caregiver must be able to state for each of the five teach-back elements to be scored as passed, the criteria for scoring an element as not passed, and the action taken on a first and on a second failure. Abbreviations: HD = hemodialysis; PD = peritoneal dialysis.
| Denominator | Audit threshold | Basis for the threshold | Primary data source |
| All patients initiating dialysis | ≥ 90% | Institutional documentation-completeness target agreed by the nephrology quality-improvement group before the audit window; not an external benchmark | Education checklist |
| All patients initiating dialysis | ≥ 90% | Institutional documentation-completeness target; not an external benchmark | Shared-decision note |
| All patients initiating dialysis | ≥ 90% | Institutional documentation-completeness target; not an external benchmark | Structured note template in the medical record |
| All patients initiating dialysis | ≥ 85% | Set below the documentation indicators because crash presentations cannot have a pre-existing access plan; institutional target | Access coordinator log |
| All patients initiating dialysis | ≥ 95% | Set above the documentation indicators because this is a safety-critical pre-procedure check; institutional target | Infection screening checklist |
| All patients initiating HD | Relative reduction against the center's own baseline | No absolute external benchmark is transferable between centers with different referral patterns and access capacity; the baseline is the rate in the center's first audit month and the target is a locally agreed relative reduction, audited by the five reason categories in step 4.6 | Dialysis start form and access coordinator log |
| All patients initiating PD | ≥ 90% | Institutional documentation-completeness target; not an external benchmark | PD readiness checklist |
| All patients initiating dialysis | ≥ 90% | Institutional documentation-completeness target; not an external benchmark | Follow-up registry |
| All hospitalizations within 30 days of initiation | 100% | Set at 100% because every early hospitalization is reviewed individually at the monthly audit; the denominator is small by design | Hospital record and registry |
| All patients initiating dialysis | 100% of episodes classified by site | Added prospectively (step 7.6). Site classification, not event rate, is the auditable quantity, because event rates depend on case mix | Dialysis registry and hospital record |
| All patients initiating dialysis | ≥ 90% | Institutional documentation-completeness target; not an external benchmark | Follow-up registry |
| All patients initiating that modality | Denominator explicitly stated | Reported as a descriptive outcome with a stated denominator rather than against a target, because persistence is influenced by death, transfer, and transplantation, which are reported separately | Dialysis registry |
| All calendar months in the implementation period | Every month | Process requirement of the protocol rather than a clinical benchmark | Audit meeting log |
Table 4: Quality indicators, audit thresholds, and data sources. This table defines each implementation indicator, its numerator and denominator, the audit threshold, and the record from which it is extracted. Thresholds are institutional implementation targets agreed by the nephrology quality-improvement group before the audit began; they express expected documentation completeness and are not derived from published outcome benchmarks. Safety-critical screening is set at a higher threshold than documentation indicators. The temporary-catheter indicator has no absolute external benchmark and is audited against a locally set relative reduction from the center's own first-month baseline. Abbreviations: HD = hemodialysis; PD = peritoneal dialysis; QI = quality improvement.
| Possible cause | Corrective action | Responsible role | Reassessment |
| Patients enter the pathway only at the point of an emergency admission, so there is no outpatient contact at which to deliver education | Add an automatic nursing referral triggered by the eGFR threshold, and deliver education at the bedside within 72 h of stabilization | Dialysis education nurse | Next monthly audit |
| Education is delivered and documented as a single event, with no separate field in which each teach-back element is scored | Require the five-element teach-back score of Table 5 as a mandatory field in the shared-decision note; the note cannot be filed while it is blank | Nephrologist and education nurse | Next monthly audit |
| Referral to the access team occurs after dialysis has become necessary, or procedure slots are unavailable | Move the access referral to the same visit at which maintenance HD becomes the working plan (step 4.1), and reserve a weekly access slot for transition patients | Access coordinator | Next monthly audit |
| Late referral, unmatured arteriovenous access, no procedure slot, patient refusal, or clinical instability — these have different remedies | Stratify by the five reason categories recorded in step 4.6 and act on the dominant category only: referral pathway for late referral, scheduling for capacity, re-counseling for refusal | Access coordinator with the nephrology lead | Next monthly audit |
| No owner is assigned to conversion, or the conversion procedure was not scheduled | Weekly review of every temporary catheter in situ, with a named owner and a booked conversion date; escalate to the monthly audit at 21 days (step 4.7) | Access coordinator | Weekly, then next monthly audit |
| Unbalanced education, limited training capacity, caregiver barriers, or clinician preference | Audit the sequence in which modalities were presented, review PD training capacity against demand, and record the specific barrier for every patient in whom PD was considered and not chosen | Nephrology lead with the PD trainer | Next monthly audit |
| Break-in period shortened without meeting the urgent-start conditions, excessive initial fill volume, or a poorly chosen exit site | Re-audit every urgent-start PD case against the six conditions of step 5.4, confirm supine low-volume exchanges, and repeat exit-site marking with the patient standing and sitting | PD trainer with the access surgeon | Next monthly audit |
| Cognitive impairment, literacy or language barrier, or absent caregiver support | Apply the routing rules of Table 5 and step 5.9: caregiver-led training, assisted PD, or transfer to in-center HD, with the reason recorded | PD trainer with the nephrologist | At the 30-day review |
| No ownership of the appointment, or no registry from which pending milestones can be identified | Book all three reviews before discharge or before the first outpatient treatment, and generate a pending-review list from the registry each week | Data manager with the transition nurse | Weekly, then next monthly audit |
| Transfer to another facility is being counted as loss to follow-up | Report transfer, death, and transplantation as separate outcome categories and exclude them from the loss-to-follow-up count (step 8.7) | Data manager | Next monthly audit |
| Infection is recorded as a single composite without site or organism | Record site and organism for every episode and classify it as catheter-related bloodstream infection, exit-site or tunnel infection, peritonitis, or other (step 7.6) | Nephrologist with the infection control link nurse | Next monthly audit |
| Different denominators or different data-lock points are being used | Regenerate every indicator from the single source-data worksheet and record the numerator and denominator alongside each value (step 8.8) | Data manager | Before the next audit meeting |
| The action addresses a symptom rather than the workflow step that fails | Return to the protocol step named in the indicator definition and change the step itself, rather than repeating the reminder | Nephrology lead | At the third monthly audit |
Table 5: Troubleshooting table for the monthly audit. This table lists the workflow failures most often responsible for a missed indicator threshold, together with the possible cause, the corrective action, the responsible role, and the point at which the corrective action is reassessed. Abbreviations: HD = hemodialysis; PD = peritoneal dialysis; QI = quality improvement.
| Characteristic | Overall (n = 345) | Hemodialysis (n = 305) | Peritoneal dialysis (n = 40) | Denominator and notes |
| Age, years, mean ± SD | 57.8 ± 14.2 | 58.7 ± 14.1 | 50.6 ± 12.8 | All patients initiating dialysis (n = 345) |
| Male sex, n (%) | 204 (59.1) | 182 (59.7) | 22 (55.0) | All patients initiating dialysis (n = 345) |
| eGFR at pathway entry, mL/min/1.73 m², median (IQR) | 6.3 (5.1–7.8) | 6.1 (4.9–7.6) | 7.0 (5.8–8.5) | All patients initiating dialysis (n = 345) |
| Residual urine > 500 mL/day, n (%) | 169 (49.0) | 136 (44.6) | 33 (82.5) | All patients initiating dialysis (n = 345) |
| Chronic glomerulonephritis, n (%) | 141 (40.9) | 125 (41.0) | 16 (40.0) | Etiology categories sum to 345 |
| Diabetic kidney disease, n (%) | 106 (30.7) | 98 (32.1) | 8 (20.0) | Etiology categories sum to 345 |
| Hypertensive nephrosclerosis, n (%) | 51 (14.8) | 47 (15.4) | 4 (10.0) | Etiology categories sum to 345 |
| Other or unknown etiology, n (%) | 47 (13.6) | 35 (11.5) | 12 (30.0) | Etiology categories sum to 345 |
| Documented modality education, n (%) | 331 (95.9) | 292 (95.7) | 39 (97.5) | Implementation fidelity indicator |
| Documented shared decision, n (%) | 326 (94.5) | 287 (94.1) | 39 (97.5) | Implementation fidelity indicator |
| Access plan documented, n (%) | 318 (92.2) | Not separately reported | Not separately reported | Overall implementation indicator; modality-specific split not extracted in the locked dataset |
| Baseline infection screening completed, n (%) | 340 (98.6) | Not separately reported | Not separately reported | Overall implementation indicator; modality-specific split not extracted in the locked dataset |
| Planned initiation, n (%) | 268 (77.7) | 232 (76.1) | 36 (90.0) | Clinical urgency classification |
| Urgent initiation, n (%) | 54 (15.7) | Not separately reported | Not separately reported | Overall split reported; modality-specific split not extracted in the locked dataset |
| Crash initiation, n (%) | 23 (6.7) | Not separately reported | Not separately reported | Overall split reported; modality-specific split not extracted in the locked dataset |
| Urgent or crash initiation, n (%) | 77 (22.3) | 73 (23.9) | 4 (10.0) | Modality-specific combined row retained for consistency |
| HD usable arteriovenous access or planned AV pathway, n (%) | 200/345 (58.0) | 200/305 (65.6) | Not applicable | HD access distribution; percentages shown with denominators |
| HD tunneled catheter at first dialysis, n (%) | 27/345 (7.8) | 27/305 (8.9) | Not applicable | HD access distribution |
| HD temporary catheter at first dialysis, n (%) | 78/345 (22.6) | 78/305 (25.6) | Not applicable | HD access distribution |
| PD conventional break-in pathway, n (%) | 28/345 (8.1) | Not applicable | 28/40 (70.0) | PD technical initiation pathway |
| PD urgent-start technical prescription, n (%) | 12/345 (3.5) | Not applicable | 12/40 (30.0) | Technical prescription after shortened break-in; distinct from urgent/crash classification |
| 30-day hospitalization, n (%) | 48 (13.9) | 44 (14.4) | 4 (10.0) | All-cause hospitalization within 30 days |
| 90-day dialysis-related infection, n (%) | 19 (5.5) | 18 (5.9) | 1 (2.5) | Dialysis-related infection within 90 days |
| 90-day follow-up completed, n (%) | 319 (92.5) | Not separately reported | Not separately reported | Follow-up completion is reported separately from modality persistence |
| 90-day modality persistence, n (%) | 314 (91.0) | 277 (90.8) | 37 (92.5) | Calculated against all initial modality starters |
| 90-day mortality, n (%) | 8 (2.3) | 8 (2.6) | 0 (0.0) | All-cause mortality within 90 days |
| Teach-back verified | Not separately extracted | Not separately extracted | Not separately extracted | Teach-back was recorded within the shared-decision note in the locked dataset and was not extracted as a discrete variable; it is a discrete field prospectively (protocol step 3.10) |
Table 6: Baseline, initiation, and early implementation characteristics. Values are reported from the hospital's locked, de-identified implementation dataset. Follow-up completion and modality persistence are reported as separate indicators, and denominators are specified in the table notes. Abbreviations: CKD = chronic kidney disease; eGFR = estimated glomerular filtration rate; HD = hemodialysis; IQR = interquartile range; PD = peritoneal dialysis; SD = standard deviation.
Supplementary File 1. Source-data workbook for the implementation dataset. This workbook contains four worksheets: a data dictionary defining each variable, its permitted values, and source record; an indicator reconciliation worksheet reporting the numerator, denominator, and percentage for each implementation indicator reported in Table 4 and Table 6; the etiology-by-modality counts underlying Figure 2; and the monthly quality-indicator values underlying Figure 3. The workbook uses the same data-lock point and variable definitions as the manuscript. Monthly values for Figure 3 are reported as percentages because the monthly incident-start denominators were not retained as separate fields in the locked export; prospective implementations should record the numerator and denominator for each monthly value, as specified in protocol step 8.8. Abbreviations: CKD = chronic kidney disease; HD = hemodialysis; PD = peritoneal dialysis. Please click here to download this file.
Discussion
This protocol translates dialysis transition care into a visual and auditable method that can be replicated by nephrology centers managing adults with uremic-stage CKD. The most critical step is early eligibility screening, because education and access planning cannot succeed if patients enter the pathway only after emergency indications have developed. The second critical step is teach-back during shared decision-making. A patient who can name a modality but cannot describe the access procedure, the warning signs, or the first month of care has not completed a reproducible decision process; this is why teach-back is scored element by element in Table 3 rather than recorded as a single yes or no. By making teach-back, access planning, early review, and monthly audit explicit protocol elements, the workflow converts an informal clinical conversation into a measurable safety process consistent with contemporary guidance on dialysis initiation and modality selection4. Vascular access and HD adequacy require dedicated KDOQI-based documentation6,7. PD prescribing and access planning require modality-specific guidance8,9. PD infection prevention and catheter-related infection monitoring should be audited as separate safety domains10,11. Teach-back, PD training, and modality-choice documentation are supported by patient-education and shared-decision literature12,19. All HD-versus-PD contrasts are descriptive and exploratory; no inference should be made about relative modality safety or effectiveness because modality assignment was clinically selected and confounded by urgency, age, residual urine output, comorbidity, home conditions, and access feasibility.
The rationale for two design choices belongs here rather than in the Protocol. First, the 7, 30, and 90 day review points were chosen because 7 days captures the technical safety of initiation, 30 days captures the first hospitalization and prescription-adjustment window, and 90 days is long enough to show whether the initial plan has become a stable treatment pattern while remaining early enough that any failure still reflects transition-care quality rather than long-term dialysis outcome. Second, the audit thresholds in Table 4 are institutional implementation targets set by consensus of the nephrology quality-improvement group before the audit window opened. They describe the documentation completeness the service considered achievable and are deliberately not presented as validated external benchmarks: safety-critical screening is held at a higher level than documentation indicators, and the temporary-catheter indicator is audited as a relative reduction from the center's own baseline because no absolute target would be transferable between centers with different referral patterns and access capacity.
Several modifications are possible without changing the core method. Smaller centers may conduct multidisciplinary meetings every 2 weeks if urgent cases can be escalated immediately. Centers with established home dialysis programs can expand PD readiness assessment into a formal home visit, whereas centers with limited PD resources can use the same decision matrix to identify candidates for referral. In settings with long access wait times, the pathway can be linked to electronic alerts triggered by eGFR, kidney failure risk, or repeated urgent clinic visits. The protocol can also be adapted to different staffing models: a nurse-led education visit, an access-coordinator call, or a physician-supervised inpatient review can all meet the same standard if the required checkpoints are completed and recorded.
Troubleshooting should focus on workflow failures rather than patient choice, and the failure modes encountered during implementation are set out in Table 5, along with their causes, corrective actions, responsible roles, and reassessment points. Three patterns deserve emphasis here. First, a high temporary-catheter rate is not a single problem: late referral, an arteriovenous access that was referred but had not matured, an unavailable procedure slot, patient refusal, and clinical instability all produce the same indicator value but require different remedies, which is why the reason category is now recorded for every temporary catheter at first dialysis (step 4.6) and the indicator is stratified before any action is taken. In this cohort, 78 of 305 HD patients (25.6%) began through a temporary catheter, and this indicator was therefore the standing first agenda item of the monthly audit, managed through a weekly review of every catheter still in situ with a named owner and a booked conversion date, and escalated at 21 days (steps 4.6 and 4.7). Second, an unclassified composite infection indicator cannot guide corrective action, which is why site and organism are now recorded for every episode (step 7.6). Until that classification is available, a center cannot state whether its early HD infections are predominantly catheter-related bloodstream infections, and neither can this dataset. Third, when the same corrective action recurs for 3 consecutive months, it addresses a symptom rather than the failing workflow step, and the protocol step specified in the indicator definition should be changed. The monthly audit should therefore avoid vague conclusions and instead assign one concrete corrective action, one responsible person, and one reassessment date.
The method has limitations. It is a structured clinical protocol, not a randomized comparison between HD and PD. Modality assignment was clinically determined, and the HD and PD groups differ systematically in age, residual kidney function, comorbidity, socioeconomic circumstances, home support, and urgency at presentation; the between-group differences in hospitalization, infection, persistence, and mortality reported above are therefore confounded by indication and must not be read as treatment effects. No adjustment, matching, or significance testing was applied, and none would be adequate at this sample size and design. Second, the implementation data come from a single center over a 5 month window, so the absolute indicator values reflect one service's referral pattern and access capacity rather than an externally generalizable standard. Third, the locked dataset was assembled at the point of dialysis initiation, so the number of patients screened, the number excluded, and the reasons for exclusion were not extracted; a participant flow diagram cannot be constructed retrospectively, and the fidelity percentages should be read as applying to patients who initiated dialysis rather than to all patients entering the pathway. Prospective use of the protocol should record screening and exclusion counts from protocol step 1.5 to generate a flow diagram. Fourth, dialysis-related infection was recorded as a composite without site or organism, which prevents any statement about catheter-related bloodstream infection specifically. Similarly, infection-site and microbiology fields were not included in the locked dataset. Future use of the protocol should classify suspected access-related bacteremia, exit-site infection, peritonitis, pneumonia, urinary infection, and other infections separately during the 30 and 90 day reviews. Fifth, the protocol requires staff time, reliable documentation, and local access to HD, PD, access procedures, and data management; some centers lack same-day catheter placement, mature PD training capacity, electronic registries, or dedicated access coordinators. These constraints do not invalidate the protocol, but they require transparent reporting of local resources so that readers can judge which results reflect the method and which reflect service capacity. Finally, patient preferences may evolve after real exposure to therapy, and the protocol therefore records a backup modality and encourages reassessment rather than treating the first decision as permanent.
The significance of the protocol lies in standardization without eliminating individualization. Existing guidance describes dialysis initiation and vascular access planning4,6. HD adequacy and incremental HD prescribing are addressed in dedicated sources7,20. Once- or twice-weekly incremental HD should be treated as an individualized strategy rather than as a default start21. PD prescribing should be goal-directed8, and incremental PD and nutritional monitoring should be individualized during early transition care22,23. PD access, peritonitis prevention, catheter-related infection monitoring, and PD teaching require modality-specific checklists9,10. Catheter-related infection guidance and PD training guidance inform early safety monitoring11,12. Shared decision-making literature supports patient-centered documentation of modality choice13,19. Glomerular disease and ANCA-associated vasculitis guidance support the immunosuppression safety-review module14,17. However, bedside implementation is often inconsistent. By linking eligibility screening, shared decision-making, access planning, modality-specific initiation, immunosuppression safety review, and early outcome audit, the protocol bridges guideline recommendations and everyday nephrology practice. It is especially suitable for visual publication because reproducible actions can be shown directly on video: completing a triage checklist, explaining a decision matrix, verifying teach-back, reviewing HD or PD initiation checklists, and feeding complications back into a quality loop.
The minimum infrastructure needed to run the protocol is modest and can be stated explicitly. A center requires an in-center HD capability or a referral agreement for HD; access to peritoneal catheter insertion, either locally or by referral within 72 h; one nephrologist responsible for urgency classification; one nurse trained to deliver scripted modality education and to score teach-back; one named access coordinator, a role that may be held part-time by a dialysis nurse; a means of scheduling and recording the 7, 30, and 90 day reviews; and a single spreadsheet or registry in which the indicator numerators and denominators are maintained. Electronic health record integration, dedicated data managers, same-day catheter placement, and a formal home-visit program improve the workflow but are not prerequisites. Centers without a PD program can still apply the eligibility screen, education, teach-back, and decision matrix to identify patients for referral.
Future applications include prospective validation, integration with electronic health records, collection of patient-reported outcomes, and comparison of pre- and post-implementation quality indicators. Centers can evaluate whether the pathway reduces crash starts, shortens the time from modality decision to access placement, increases documented patient understanding, improves PD training completion, or reduces catheter dependence at 90 days. These analyses should be interpreted cautiously unless the dataset supports a transparent before-and-after design, an interrupted time series, or a prospective registry.
Disclosures
The authors have no conflicts of interest to declare. Individual patient-level records cannot be publicly deposited or shared because the ethics review for this retrospective analysis (No. wz2026001) covers the use of aggregate de-identified data only, and because applicable hospital data-governance rules and privacy regulations prohibit the release of individual-level dialysis records.
Use of artificial intelligence: During the preparation of this revised manuscript, the authors used a generative artificial intelligence language tool to assist with English language editing.
Materials
| Name | Company | Catalog Number | Comments |
|---|---|---|---|
| Access coordinator | Institutional resource; not commercially available | Not applicable (generic specification) | Records access milestones, reviews temporary catheters weekly, and owns the conversion pathway. May be a part-time role held by a dialysis nurse. |
| Access planning form | Institutional resource; not commercially available | Not applicable (generic specification) | Records referral date, procedure date, access type, cannulation-readiness date, complications, and, for temporary catheters, the reason category (protocol steps 4.4 and 4.6). |
| Automated peritoneal dialysis cycler | Generic; any manufacturer meeting the stated specification | Not applicable (generic specification) | Optional. Required only where automated PD is offered; the protocol can be delivered entirely with continuous ambulatory PD. |
| Data manager | Institutional resource; not commercially available | Not applicable (generic specification) | Performs completeness checks, maintains the audit trail, and generates the monthly dashboard. |
| De-identified triage form | Institutional resource; not commercially available | Not applicable (generic specification) | Records referral source, review date, reviewer, eGFR trigger, symptom trigger, immediate safety status, reversible factors, and the clinical urgency classification (protocol steps 2.1–2.9). |
| Diagnostic ultrasound system with a linear vascular probe | Generic; any manufacturer meeting the stated specification | Not applicable (generic specification) | Linear probe of at least 7 MHz, used for pre-operative vein and artery mapping in protocol step 4.3 and for ultrasound-guided catheter placement. |
| Dialysis education nurse | Institutional resource; not commercially available | Not applicable (generic specification) | Delivers scripted modality education and scores teach-back. |
| Dialysis transition registry | Institutional resource; not commercially available | Not applicable (generic specification) | Secure institutional database or access-controlled spreadsheet holding milestones and outcomes. A single spreadsheet is sufficient for a smaller center. |
| Dialyzer, single-use hollow-fiber | Generic; any manufacturer meeting the stated specification | Not applicable (generic specification) | Surface area selected for the individual patient. Used for the conservative first sessions of protocol step 4.8. |
| Exit-site dressing and antiseptic skin preparation | Generic; any manufacturer meeting the stated specification | Not applicable (generic specification) | Used in the exit-site care taught and observed in protocol step 5.8. |
| Extracorporeal bloodline set and dialysis needles | Generic; any manufacturer meeting the stated specification | Not applicable (generic specification) | Needle gauge selected according to the access type and maturation status. |
| Filming script and simulated patient forms | Institutional resource; not commercially available | Not applicable (generic specification) | Scene-by-scene script covering the six reproducible scenes listed in the protocol note. Simulated or fully consented participants only; no real identifiers are displayed. |
| HD initiation checklist | Institutional resource; not commercially available | Not applicable (generic specification) | Completed before and after each of the first three HD sessions (protocol step 4.10). |
| Hemodialysis machine | Generic; any manufacturer meeting the stated specification | Not applicable (generic specification) | Volumetric ultrafiltration control, conductivity and temperature monitoring, blood-leak and air detectors, and single-patient delivery. The protocol is workflow-based and vendor-independent; record the model in use at the implementing center. |
| Immunosuppression safety dashboard | Institutional resource; not commercially available | Not applicable (generic specification) | Pre-procedure safety screen for glomerulonephritis and vasculitis patients, covering infection screening, counts, cumulative exposure, and access timing (protocol steps 6.6–6.10). A safety screen, not a disease registry. |
| Locked data dictionary | Institutional resource; not commercially available | Not applicable (generic specification) | Variable definitions, permitted values, numerators, denominators, and missing-data categories. Published in full as worksheet 1 of Supplementary File 1. |
| Modality selection and initiation decision matrix | Institutional resource; not commercially available | Not applicable (generic specification) | The decision domains and corresponding actions are published in full as Table 2 of this article. |
| Monthly quality dashboard | Institutional resource; not commercially available | Not applicable (generic specification) | Displays the indicators defined in Table 4 with one corrective action, one owner, and one reassessment date per month (protocol steps 7.7–7.9). |
| Nephrologist | Institutional resource; not commercially available | Not applicable (generic specification) | Verifies eligibility, assigns the clinical urgency classification, and signs the prescription. |
| Non-tunneled temporary hemodialysis catheter | Generic; any manufacturer meeting the stated specification | Not applicable (generic specification) | Used only when dialysis is required within hours and no tunneled slot is available; conversion within 14 days is audited (protocol steps 4.6–4.7). |
| PD home readiness checklist and training syllabus | Institutional resource; not commercially available | Not applicable (generic specification) | Sequence of observable training tasks with a supervised unassisted exchange as the completion criterion (protocol steps 3.5, 5.4, and 5.8–5.9). |
| PD trainer | Institutional resource; not commercially available | Not applicable (generic specification) | Delivers and signs off the PD training sequence. |
| Peritoneal dialysis catheter, double-cuffed Tenckhoff-type | Generic; any manufacturer meeting the stated specification | Not applicable (generic specification) | Insertion technique, prophylaxis, and break-in plan recorded before training begins (protocol step 5.3). |
| Peritoneal dialysis solutions, transfer set, and disconnect caps | Generic; any manufacturer meeting the stated specification | Not applicable (generic specification) | Glucose concentration and fill volume prescribed to clinical goals (protocol step 5.10). Low fill volumes are used for urgent-start PD. |
| Scripted modality education checklist | Institutional resource; not commercially available | Not applicable (generic specification) | Balanced HD, PD, transplantation, and conservative kidney management script with a fixed field set for each option (protocol steps 3.1–3.3). Reviewed annually. |
| Shared-decision note template | Institutional resource; not commercially available | Not applicable (generic specification) | Structured note or electronic health record phrase recording options, clinical factors, patient goals, final modality, backup modality, access plan, expected start date, and unresolved barriers (protocol step 3.12). |
| Source-data and indicator reconciliation worksheet | Institutional resource; not commercially available | Not applicable (generic specification) | Single worksheet from which every figure and table is generated. Published in full as worksheets 2 to 4 of Supplementary File 1. |
| Spreadsheet software | Generic; any manufacturer meeting the stated specification | Not applicable (generic specification) | Any spreadsheet application capable of reading .xlsx files. No proprietary statistical package is required, because the analysis is descriptive (protocol step 8.3). |
| Teach-back scoring record | Institutional resource; not commercially available | Not applicable (generic specification) | Five-element pass or fail record with routing for repeated failure. The criteria are published in full as Table 5 of this article. |
| Tunneled cuffed central venous hemodialysis catheter | Generic; any manufacturer meeting the stated specification | Not applicable (generic specification) | Preferred over a non-tunneled catheter whenever expected catheter dependence exceeds 1 week (protocol step 4.5). |
| Water treatment system for hemodialysis | Generic; any manufacturer meeting the stated specification | Not applicable (generic specification) | Reverse-osmosis system delivering dialysis water and dialysis fluid that meet the chemical and microbiological limits of the ISO 23500 series. Required for any in-center HD program. |
| Weighing scale, calibrated, with 0.1 kg resolution | Generic; any manufacturer meeting the stated specification | Not applicable (generic specification) | Used for the pre- and post-dialysis weights recorded on the HD initiation checklist in protocol step 4.10. |
References
- Kidney Disease: Improving Global Outcomes (KDIGO) CKD Work Group. KDIGO 2024 clinical practice guideline for the evaluation and management of chronic kidney disease. Kidney Int. 2024;105(4 Suppl):S117-314.
- GBD Chronic Kidney Disease Collaborators. Global, regional, and national burden of chronic kidney disease, 1990-2017: a systematic analysis for the Global Burden of Disease Study 2017. Lancet. 2020;395(10225):709-33.
- Tangri N, et al. A predictive model for progression of chronic kidney disease to kidney failure. JAMA. 2011;305(15):1553-9.
- Chan CT, et al. Dialysis initiation, modality choice, access, and prescription: conclusions from a Kidney Disease: Improving Global Outcomes (KDIGO) Controversies Conference. Kidney Int. 2019;96(1):37-47.
- Cooper BA, et al. A randomized, controlled trial of early versus late initiation of dialysis. N Engl J Med. 2010;363(7):609-19.
- Lok CE, et al. KDOQI clinical practice guideline for vascular access: 2019 update. Am J Kidney Dis. 2020;75(4 Suppl 2):S1-164.
- National Kidney Foundation. KDOQI clinical practice guideline for hemodialysis adequacy: 2015 update. Am J Kidney Dis. 2015;66(5):884-930.
- Brown EA, et al. International Society for Peritoneal Dialysis practice recommendations: prescribing high-quality goal-directed peritoneal dialysis. Perit Dial Int. 2020;40(3):244-53.
- Crabtree JH, et al. Creating and maintaining optimal peritoneal dialysis access in the adult patient: 2019 update. Perit Dial Int. 2019;39(5):414-36.
- Li PKT, et al. ISPD peritonitis guideline recommendations: 2022 update on prevention and treatment. Perit Dial Int. 2022;42(2):110-53.
- Chow KM, et al. ISPD catheter-related infection recommendations: 2023 update. Perit Dial Int. 2023;43(3):201-19.
- Figueiredo AE, et al. A syllabus for teaching peritoneal dialysis to patients and caregivers. Perit Dial Int. 2016;36(6):592-605.
- Yu X, et al. Shared decision-making for a dialysis modality. Kidney Int Rep. 2022;7(1):15-27.
- Kidney Disease: Improving Global Outcomes (KDIGO) Glomerular Diseases Work Group. KDIGO 2021 clinical practice guideline for the management of glomerular diseases. Kidney Int. 2021;100(4 Suppl):S1-276.
- Fervenza FC, et al. Rituximab or cyclosporine in the treatment of membranous nephropathy. N Engl J Med. 2019;381(1):36-46.
- Scolari F, et al. Rituximab or cyclophosphamide in the treatment of membranous nephropathy: the RI-CYCLO randomized trial. J Am Soc Nephrol. 2021;32(4):972-82.
- Kidney Disease: Improving Global Outcomes (KDIGO) ANCA Vasculitis Work Group. KDIGO 2024 clinical practice guideline for the management of antineutrophil cytoplasmic antibody (ANCA)-associated vasculitis. Kidney Int. 2024;105(3 Suppl):S71-116.
- Walsh M, et al. Plasma exchange and glucocorticoids in severe ANCA-associated vasculitis. N Engl J Med. 2020;382(7):622-31.
- Ghodsian S, Ghafourifard M, Ghahramanian A. Comparison of shared decision making in patients undergoing hemodialysis and peritoneal dialysis for choosing a dialysis modality. BMC Nephrol. 2021;22(1):67.
- Murea M, Moossavi S, Garneata L, Kalantar-Zadeh K. Narrative review of incremental hemodialysis. Kidney Int Rep. 2020;5(2):135-48.
- Obi Y, Kalantar-Zadeh K. Incremental and once- to twice-weekly hemodialysis: from experience to evidence. Kidney Int Rep. 2017;2(5):781-4.
- Cheetham MS, et al. Incremental versus standard (full-dose) peritoneal dialysis. Kidney Int Rep. 2022;7(2):165-76.
- Ikizler TA, et al. KDOQI clinical practice guideline for nutrition in CKD: 2020 update. Am J Kidney Dis. 2020;76(3 Suppl 1):S1-107.