This randomized, balanced crossover study compared seated wakefulness with 30- and 90-min afternoon nap opportunities in female collegiate basketball players. The 90 min condition was associated with differences in four of nine outcomes after controlling for multiple testing; actual sleep duration was not objectively verified.
Research Article
Effects of 30- and 90-Minute Afternoon Nap Opportunities on Field-Test Performance in Female Collegiate Basketball Players
* These authors contributed equally
In This Article
Summary
Abstract
Afternoon napping is used as a recovery strategy in sport, but a scheduled nap opportunity is not equivalent to objectively verified sleep. This study compared no-nap seated wakefulness (N0), a 30-minute scheduled nap opportunity (N30), and a 90-minute scheduled nap opportunity (N90) in 18 female collegiate basketball players using a randomized, fully counterbalanced, three-period within-participant crossover design. Conditions were separated by at least 72 h and ended at 14:30, followed by a common 60 min wakefulness buffer, a standardized 15 min warm-up, and a fixed basketball field-test battery. Linear mixed-effects models included condition, period, and sequence as fixed effects, with participant as a random intercept; the nine omnibus condition tests were controlled for using the Benjamini–Hochberg false discovery rate procedure. Four of nine outcomes remained significant after false-discovery-rate correction: the modified-505 first 10 m split, combined modified-505 completion time, three-quarter-court sprint time, and 30–15 Intermittent Fitness Test final velocity. N90 differed from both N0 and N30 for these outcomes, whereas N30 did not differ from N0. The other five outcomes did not meet the false-discovery-rate threshold. Sensitivity analyses, including reanalysis of the pre-correction modified-505 data, preserved the same four-outcome pattern. Because sleep onset and duration were not objectively measured, the findings estimate the effects of assigned recovery-opportunity conditions rather than a physiological sleep-duration dose-response.
Introduction
Basketball performance is multidimensional. Match play requires repeated accelerations, short sprints, decelerations, lateral movement, jumping, and intermittent high-intensity running, and the contribution of these capacities varies by task and competitive context1,2. A recovery intervention may therefore affect one field-test domain without producing a uniform response across the full battery. Separating linear sprinting, modified-505 components, lane-based multidirectional movement, countermovement-jump height, and intermittent-running capacity provides a task-specific assessment rather than a single composite performance score.
Sleep is an important component of athletic recovery, and inadequate sleep can impair physical, cognitive, and perceptual performance3,4. Basketball players are exposed to travel, academic demands, late training or competition, and irregular schedules that may disturb recovery5. Daytime napping is consequently used both to supplement nocturnal sleep and to create a low-stimulation recovery period. Reviews of physically active and athletic populations report possible benefits for selected physical and cognitive outcomes, but also substantial heterogeneity related to prior sleep, opportunity duration, wake interval, and test modality6,7,8. Sleep inertia may also influence performance when testing follows awakening too closely9.
The distinction between a scheduled nap opportunity and verified sleep is central to interpretation. Without polysomnography, electroencephalography, or validated actigraphy, a nominal 30- or 90-min opportunity does not establish sleep onset, sleep latency, total sleep time, sleep efficiency, or sleep-stage composition. Darkness, recumbency, sensory reduction, device restriction, passive recovery, and expectation may also contribute to a condition effect. Accordingly, a study without objective sleep monitoring should estimate the effect of assignment to the recovery-opportunity condition rather than attribute observed differences specifically to sleep quantity or sleep stage6,9.
Female athletes remain underrepresented in sport and exercise science10. Meta-analytic evidence suggests that average menstrual-cycle effects on exercise performance are small and methodologically heterogeneous, whereas individual symptom burden may be more informative than the nominal phase alone11,12. The present study, therefore, evaluated female collegiate basketball players using a randomized, fully balanced three-condition crossover design with identical condition endpoints, a common 60 min wakefulness buffer, trial-level validity rules, and decomposition of the modified 505. We hypothesized that the effects of the assigned recovery conditions would be task-specific, with larger differences expected for running-based outcomes under N90 than under N0 or N30, while effects on jump height, Lane Agility, and turning-specific performance could differ by task.
Protocol
All procedures involving human participants were conducted in accordance with the Declaration of Helsinki and institutional requirements. The Ethics Committee of Wuhan Sports University approved the protocol (approval number 2023070). All participants provided written informed consent. The approved consent framework permitted public sharing of the deposited deidentified research data.
Participants and cohort characterization
Eighteen female collegiate basketball players from the same team roster who were available to complete all three experimental conditions were recruited. All athletes were classified as National First-Class athletes and completed the protocol during the January 2026 preseason preparatory phase. The sample represented the available eligible roster; no prospective sample size or power calculation was conducted. Age, height, body mass, body-fat percentage, training experience, playing position, competitive classification, habitual daytime-nap behavior, habitual caffeine or energy-drink use, and hormonal-contraceptive use were recorded. All participants in this cohort self-reported a regular daytime-nap habit; none reported habitual coffee or energy-drink consumption, and none used hormonal contraceptives.
The complete Chinese-language 19-item Morningness–Eveningness Questionnaire, Pittsburgh Sleep Quality Index, and 18-item Athlete Sleep Behavior Questionnaire-2 were administered during each athlete’s N0 session. Participants completed the questionnaires independently, and the study team scored them using the Chinese-language scoring instructions used for the project13,14,15. These scores were treated as descriptive measures of recent or habitual sleep-related characteristics, not as day-level exposure measures or randomized covariates. Previous-night sleep duration, experimental-nap duration, menstrual-cycle phase, and menstrual symptoms were not inferred from these questionnaires. In the present study, previous-night sleep logs, day-level sleepiness or vigilance, menstrual-cycle phase, and menstrual symptoms were not recorded.
Randomization, sequence balance, and condition spacing
A randomized, fully counterbalanced, three-period within-participant crossover design was used. The conditions were defined as N0 (no nap seated wakefulness), N30 (30 min scheduled afternoon nap opportunity), and N90 (90 min scheduled afternoon nap opportunity). The six possible sequences—N0–N30–N90, N0–N90–N30, N30–N0–N90, N30–N90–N0, N90–N0–N30, and N90–N30–N0—were assigned to three athletes each. Allocation was determined by lot drawing. Contemporaneous staffing documentation was not preserved, so personnel-role details and assessor-masking status could not be independently verified from a source record.
Successive condition days for each athlete were separated by at least 72 h. All three conditions were completed during the same preseason training phase, in the same indoor basketball arena, on the same wooden court, within the same afternoon time window, and with the same test order, equipment positions, air-conditioning settings, footwear, and testing personnel. The same pair of basketball shoes was used by each athlete across all three conditioning days. Venue and environmental control procedures were standardized, but day-level temperature and humidity data were not archived.
Participants necessarily knew whether they had been assigned to seated wakefulness or a nap opportunity. The study hypothesis and expected direction of effects were not disclosed. Condition labels were not displayed on the performance forms, but contemporaneous documentation sufficient to verify assessor masking was unavailable. Accordingly, the study was not characterized as formally assessor-blinded.
Training, dietary, and stimulant standardization
During the 48 h before each trial, the same coach-planned training content was used across condition days. The morning session remained low to moderate in intensity and included stretching, light jogging, ball handling, technical shooting, and light basketball-specific drills. Additional high-intensity training or strenuous non-prescribed exercise was prohibited during the final 24 h. Because internal and external training-load metrics were not recorded, this procedure was described as schedule and content standardization rather than quantified load matching.
The same cafeteria lunch was provided on every day of the week. The menu was estimated by the cafeteria and a nutrition professional to provide approximately 1,050 kcal, with an approximate energy distribution of 60% carbohydrate, 20% protein, and 20% fat. Food type and portions were kept as similar as practicable, with small body-mass-related adjustments allowed. Minor leftovers were permitted, but additional snacks and caloric beverages were prohibited. From lunch until completion of testing, only water was allowed. Alcohol and caffeine were prohibited during the final 24 h, and coffee and energy drinks were prohibited on the day of the trial. Because individual food intake was not weighed, the menu was reported as an estimate rather than the exact amount ingested.
Recovery-condition timeline and environmental control
All three recovery conditions ended at 14:30 so that the interval from condition completion to warm-up and testing was identical. For N90, athletes were placed in the nap room from 13:00 to 14:30. For N30, supervised seated wakefulness was maintained from 13:00 to 14:00, followed by a nap opportunity from 14:00 to 14:30. During the pre-nap N30 hour, printed reading, quiet conversation, or music was permitted, but recumbency, sleep, and prolonged eye closure were prohibited. For N0, supervised seated wakefulness was maintained from 13:00 to 14:30. Quiet conversation and reading from print were permitted, but lying down, sleep, and prolonged eye closure were prohibited. A researcher remained in the N0 room throughout the condition.
The same darkened, noise-controlled, air-conditioned nap room was used for N30 and N90. The air-conditioning setting was approximately 21 °C; this was a set point or practical estimate rather than a continuously measured temperature, and humidity was not recorded. Four athletes were accommodated per room, with one bed per athlete. Pillows, blankets, eye masks, and earplugs were provided. Mobile phones and personal electronic devices were collected before the nap opportunity. During N30 and N90, music, conversation, food, caffeine, and energy drinks were prohibited.
At 14:30, N30 and N90 participants were awakened using the same low-arousal verbal instruction. A yes/no procedural question was asked regarding whether the athlete believed she had slept; these individual responses were not retained in the archived analysis dataset and did not constitute objective sleep verification. Subjective sleep duration was not estimated because it had not been collected. After N30 and N90 only, perceived sleep quality was obtained using a 100 mm horizontal visual analog scale anchored by 0 mm (“slept very poorly”) and 100 mm (“slept very well”). This scale was not collected after N0. The scale was treated as a subjective descriptor and not as evidence of sleep onset, total sleep time, sleep efficiency, or sleep stage.
Wakefulness buffer, familiarization, warm-up, and fixed test order
Supervised wakefulness was maintained from 14:30 to 15:30 in all conditions. During this buffer, sleep, recumbency, caffeine, energy drinks, additional food, and vigorous unsupervised activity were prohibited. A standardized 15 min group warm-up was conducted from 15:30 to 15:45 using the same lead researcher, verbal instructions, and sequence. The warm-up included light jogging, dynamic stretching, progressive footwork, movements to increase body temperature, and basic basketball-specific actions. An additional individual warm-up was not allowed. Warm-up content and duration were standardized, but intensity was not objectively quantified. The first countermovement-jump trial began approximately 1–2 min after the warm-up.
A full familiarization session was completed 72 h before the first experimental trial. The same venue, equipment, court layouts, test order, start rules, within-test recovery intervals, invalid-trial criteria, and verbal instructions planned for the experimental sessions were used. Familiarization values were not used in the final analysis because they had not been archived for reliability assessment. The test battery was administered in the following fixed order: countermovement jump without arm swing, countermovement jump with arm swing, three-quarter-court sprint, modified 505, Lane Agility Test, and 30–15 Intermittent Fitness Test. This order placed the exhaustive intermittent-running test last1,2,16.
Countermovement-jump assessment
Jump height was measured with a photoelectric jump system; manufacturer and model information were provided in the Table of Materials. The system was checked before every session, and the same hardware and software configuration was used across conditions. For the no-arm-swing countermovement jump, both hands were maintained on the hips, a self-selected countermovement depth was used, take-off and landing were performed with both feet simultaneously, and the knees were kept extended during flight without tucking. For the arm-swing condition, natural arm movement was allowed while simultaneous take-off and landing criteria were retained. Three valid trials per condition were completed with 30 s of passive recovery; invalid attempts were repeated after the prescribed interval, and the highest valid jump height was retained17.
Timing-gate setup and running tests
The same photocell timing-gate system was used for the three-quarter-court sprint, modified 505, and Lane Agility Test; manufacturer and model information were provided in the Table of Materials. The beam height was set to 80 cm, and the gates were verified before every session. For every running test, a stationary start was used, with the lead foot 20 cm behind the start line or the first timing gate, to reduce premature beam interruption. Invalid attempts were recorded, the prescribed recovery was provided, and the trial was repeated.
For the three-quarter-court sprint, the distance from one baseline to the opposite free-throw line was measured as approximately 22.86 m. Two valid trials separated by 45 s were completed, and the fastest time was retained. A false start, premature gate trigger, or start error was treated as invalid.
For the modified 505, the first timing line was placed at the start, the second timing line 10 m from the start, and the turn line 5 m beyond the second timing line. Athletes began with the lead foot 20 cm behind the first line, accelerated through the second line, continued 5 m to the turn line, completed a 180° turn, and returned 5 m through the second line. During familiarization, each athlete was allowed to select a preferred turning direction and plant limb; the same direction and plant limb were required in both trials and all three conditions. The plant foot was required to contact or cross the turn line. Attempts involving failure to reach the line, route error, premature timing activation, or equipment interference were invalidated. Two valid trials separated by 45 s were completed.
The first 10 m split was defined as the interval from the first timing line to the first passage through the second line. The turn/second-10 m segment was defined as the interval from the first to the second passage through the second line, encompassing the 5 m entry, 180° turn, and 5 m return. The combined modified-505 completion time was calculated as the first split plus the turn/second 10 m segment. The turn-segment–approach difference was calculated as the turn/second 10 m segment minus the first split. The physical trial with the fastest valid combined time was selected, and all four modified-505 variables were retained from that same trial. The segment difference was not labeled as a standard change-of-direction deficit because its distances and construction differed from the conventional metric18,19.
For the Lane Agility Test, standard basketball-lane dimensions and the same prescribed movement direction were used for all athletes. Cones were placed at the four corners of the lane. From a stationary start 20 cm behind the gate, athletes completed the sequence of forward sprinting, lateral shuffling, backpedaling, and lateral shuffling around the marked lane, then reversed the route and returned to the finish. Three valid trials separated by 60 s were completed, and the fastest time was retained. Attempts involving apparatus contact, a missed required area, an incorrect movement sequence, or timing interference were invalidated.
30–15 Intermittent fitness test
The 30–15 Intermittent Fitness Test (30–15IFT) was administered on a 28 m shuttle layout using the same audio source, speaker position, court surface, markings, and verbal instructions across conditions. The test began at 10 km·h⁻1 and continued until the athlete voluntarily stopped because of exhaustion or could no longer maintain the prescribed pace and reach the designated zones. Final velocity was recorded as the stopping speed minus 0.5 km·h⁻1, corresponding to the last fully completed stage. This test was administered last16.
Trial retention, data handling, and timing correction
The highest valid trial was retained for each countermovement-jump condition, the fastest valid trial was retained for the three-quarter-court sprint and Lane Agility Test, and the valid modified-505 trial with the fastest combined time was retained. Every modified-505 component was retained from that same selected physical trial. Attempts invalidated for rule violations, false starts, premature gate activation, missed lines or areas, apparatus contact, route error, movement-sequence error, or device interference were excluded. Missing performance values were not estimated, simulated, interpolated, or back-calculated. Ten participant-condition records contained at least one invalid attempt, but a valid repeat was available in each record. Seven participant-condition observations carried a recorded protocol-deviation flag and were retained in the primary analysis; a sensitivity analysis excluded these observations (Table 1).
Retained data were reorganized into one row per participant per condition. The final analysis dataset contained 18 participants, three conditions per participant, 54 participant-condition rows, three participants in each sequence, no missing retained outcomes, and arithmetic agreement among modified-505 variables. Modified-505 derived variables were recalculated from the retained split values of the same selected trial. Native device exports were unavailable for independent source-file verification.
A fixed 0.02 s device-related timing adjustment associated with the SWIFT G4 timing-processing procedure was applied to the N0 turn/second-10 m component. In the dataset, 18 N0 turn/second 10 m values received +0.02 s; the corresponding 18 turn-segment–approach differences and 18 combined times were recalculated, while the first 10 m split values were unchanged. The native SWIFT export and contemporaneous device-level record could not be recovered, so the adjustment could not be independently reverified against the original source file. The corrected and pre-correction datasets were preserved separately, and all nine outcome analyses were repeated with both versions (Table 1).
Statistical analysis
Each of the nine outcomes was analyzed using a linear mixed-effects model with condition, experimental period, and assigned sequence as fixed effects and participant as a random intercept. Models were estimated by restricted maximum likelihood, and Type III fixed-effect tests with Satterthwaite denominator degrees of freedom were obtained using R, lme4, and lmerTest20,21.
Unadjusted means and standard deviations were presented for description. The false-discovery rate across the nine prespecified omnibus condition tests was controlled using the Benjamini–Hochberg procedure22. For outcomes that remained significant after this adjustment, N0 versus N30, N0 versus N90, and N30 versus N90 were compared using estimated marginal means. p values were adjusted using the Holm procedure across the three pairwise contrasts within each outcome23, and Bonferroni-adjusted simultaneous 95% confidence intervals were reported for the same family of three contrasts. Participant-matched Cohen’s dz was calculated from within-participant raw differences24.
Two-sided tests and an adjusted significance threshold of 0.05 were used.
Optimizer messages, singularity, residual-versus-fitted plots, residual Q–Q plots, standardized residuals, and Shapiro–Wilk tests were inspected. Sensitivity analyses were conducted using a period-adjusted mixed model, a condition-only mixed model, a Friedman test with Benjamini–Hochberg correction across the nine outcomes, a mixed model excluding the seven protocol-deviation observations, and a complete corrected-versus-pre-correction rerun. For the paired N30/N90 perceived sleep-quality ratings, a paired t-test and a Wilcoxon signed-rank sensitivity analysis using the normal approximation with continuity correction were used. Diagnostic disagreement was treated as a reason for cautious interpretation rather than as a basis for selecting the most favorable analysis. The final analysis code, software environment, analysis datasets, diagnostic output, and figure-source data were archived in the repository.
Results
Participant completion, study fidelity, and subjective sleep-quality ratings
All 18 athletes completed N0, N30, and N90, yielding 54 participant-condition observations and three athletes in each of the six randomized sequences (Figure 1). The fixed field-test battery and trial structure are summarized in Figure 2. Cohort characteristics and sleep-related descriptors are reported in Table 2. No retained outcome was missing. Ten participant-condition records contained at least one invalid attempt, with a valid repeat available in every record. Seven observations carried a recorded protocol-deviation flag: P03 had insufficient warm-up in N0 and N30, P09 arrived 2 min late in N0 and N30, and P15 reported mild cold symptoms in N0, N30, and N90.
Perceived sleep-quality scores were 79.0 ± 5.3 mm after N30 and 81.2 ± 6.5 mm after N90. The paired mean difference was 2.22 mm. Neither the paired t-test (p = 0.344) nor the Wilcoxon signed-rank sensitivity analysis using the normal approximation with continuity correction (p = 0.514) indicated a condition difference. These ratings describe perceived sleep quality only and do not establish sleep onset or duration.
Omnibus condition effects and pairwise contrasts
Four of the nine prespecified outcomes remained significant after Benjamini–Hochberg false-discovery-rate correction: the modified-505 first 10 m split, combined modified-505 completion time, three-quarter-court sprint time, and 30–15IFT final velocity (Table 3; Figures 3 and 4). The other five outcomes did not meet the false-discovery-rate threshold. Full pairwise contrasts for the four significant outcomes are reported in Table 4. For these comparisons, p values were Holm-adjusted within each outcome, and the reported 95% confidence intervals were Bonferroni-adjusted simultaneous intervals for the same three-contrast family.
For the modified 505, condition affected the first 10 m split (F(2, 32) = 17.00, false discovery rate (FDR)-adjusted p < 0.001) and combined completion time (F(2, 32) = 10.38, FDR-adjusted p < 0.001). N90 was faster than N0 by 0.124 s for the first split (95% CI, 0.063–0.184; Holm-adjusted p < 0.001; dz = 1.38) and by 0.206 s for combined time (95% CI, 0.091–0.321; Holm-adjusted p < 0.001; dz = 1.25). N90 was also faster than N30 by 0.118 s for the first split (95% CI, 0.057–0.178; Holm-adjusted p < 0.001; dz = 1.20) and by 0.127 s for combined time (95% CI, 0.012–0.242; Holm-adjusted p = 0.018; dz = 0.60). N0 and N30 did not differ for either outcome. The turn/second 10 m segment and turn-segment–approach difference were not significant after FDR correction (both FDR-adjusted p = 0.173).
Condition also affected three-quarter-court sprint time (F(2, 44) = 15.35, FDR-adjusted p < 0.001). N90 was faster than N0 by 0.250 s (95% CI, 0.110–0.390; Holm-adjusted p < 0.001; dz = 1.16) and faster than N30 by 0.287 s (95% CI, 0.147–0.428; Holm-adjusted p < 0.001; dz = 0.97). N0 and N30 did not differ. Lane Agility time (FDR-adjusted p = 0.173), CMJ without arm swing (FDR-adjusted p = 0.428), and CMJ with arm swing (FDR-adjusted p = 0.858) did not meet the FDR threshold.
For 30–15IFT final velocity, the condition effect was F(2, 32) = 25.33 (FDR-adjusted p < 0.001). For contrasts expressed as the first-listed condition minus the second-listed condition, N0 − N90 was −1.639 km·h⁻1 (95% CI, −2.247 to −1.031; Holm-adjusted p < 0.001; dz = −2.05) and N30 − N90 was −1.250 km·h⁻1 (95% CI, −1.858 to −0.642; Holm-adjusted p < 0.001; dz = −1.28). N0 and N30 did not differ.
Model diagnostics and sensitivity analyses
The three-quarter-court sprint model was singular because the estimated participant random-intercept variance was effectively zero; residual normality was acceptable (Shapiro–Wilk p = 0.952), and the condition effect was reproduced by the period-adjusted, condition-only, Friedman, and protocol-deviation-exclusion analyses. The turn-segment–approach difference model was singular, and its residuals were non-normal (Shapiro–Wilk p = 0.006); its primary mixed-model effect did not meet the FDR threshold, whereas the Friedman sensitivity analysis did (FDR-adjusted p = 0.020). This derived outcome was therefore treated as method-sensitive rather than as evidence of a stable condition effect. Residuals for CMJ with arm swing also departed from normality (Shapiro–Wilk p = 0.002), but parametric and non-parametric analyses remained non-significant. Lane Agility reached FDR-adjusted p = 0.051 in the Friedman analysis and was not classified as significant after FDR correction.
Excluding the seven protocol-deviation observations left 47 observations from 17 athletes and preserved the same four outcomes significant after Benjamini–Hochberg (BH) false discovery rate (FDR) correction. Period-adjusted and condition-only mixed models also reproduced this four-outcome pattern.
0.02 s timing-correction sensitivity analysis
Repeating the complete nine-outcome analysis with the pre-correction dataset did not change any FDR-level inference. For combined modified-505 time, the corrected analysis yielded F (2, 32) = 10.38, raw p = 0.000335, and FDR-adjusted p = 0.000753; the pre-correction analysis yielded F (2, 32) = 8.68, raw p = 0.000973, and FDR-adjusted p = 0.002190. The turn/second-10 m segment remained non-significant after FDR correction (0.173 corrected; 0.411 pre-correction), as did the turn-segment–approach difference (0.173 corrected; 0.189 pre-correction). For the combined-time N0 − N90 contrast, the corrected estimate was 0.206 s (95% CI, 0.091–0.321; Holm-adjusted p = 0.000242), and the pre-correction estimate was 0.186 s (95% CI, 0.071–0.301; Holm-adjusted p = 0.000846). Thus, none of the FDR-level conclusions depended on the 0.02 s adjustment (Table 1).
Conclusions derived from the results
The result was selective rather than generalized. Assignment to N90 was associated with differences in four of the nine outcomes, all of which involved sprinting or intermittent running. The modified-505 pattern reflected a faster first split and faster combined completion, not a stable improvement in the turn/return segment. N30 did not outperform N0 for any outcome that survived multiplicity control. These findings describe differences among assigned recovery-opportunity conditions and do not identify verified sleep duration as the causal exposure.
Data Availability
The deidentified study repository is available in Zenodo at doi:10.5281/zenodo.21349170. It contains the final corrected trial-level workbook used for the primary analysis, pre-correction analysis datasets, crossover sequence and period mapping, N30/N90 visual-analog-scale values, protocol-deviation flags, the N0 modified-505 timing-correction record, final R code and statistical outputs, software environment information, and figure source data. Final retained 30–15IFT velocities are available. No direct identifiers, exact test dates, or individual baseline-characteristic combinations are included.
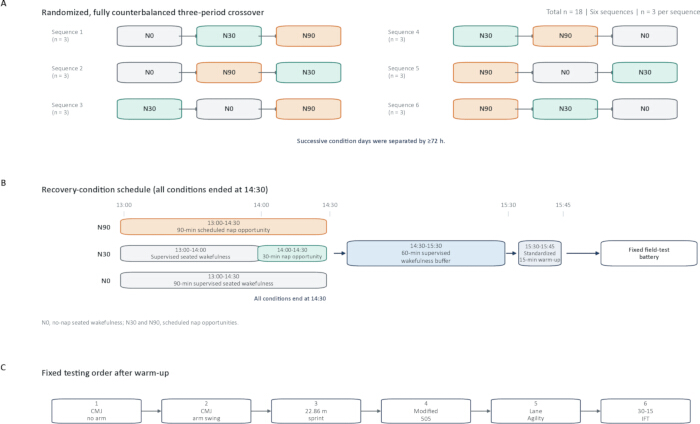
Figure 1: Experimental design and standardized testing workflow. Eighteen athletes completed N0, N30, and N90 in six fully balanced sequences, with three athletes per sequence and at least 72 h between trials. All conditions ended at 14:30 and were followed by a common 60 min wakefulness buffer, a standardized 15 min warm-up, and the fixed field-test battery. N0 = no nap seated wakefulness; N30 = 30 min scheduled nap opportunity; N90 = 90 min scheduled nap opportunity. Please click here to view a larger version of this figure.
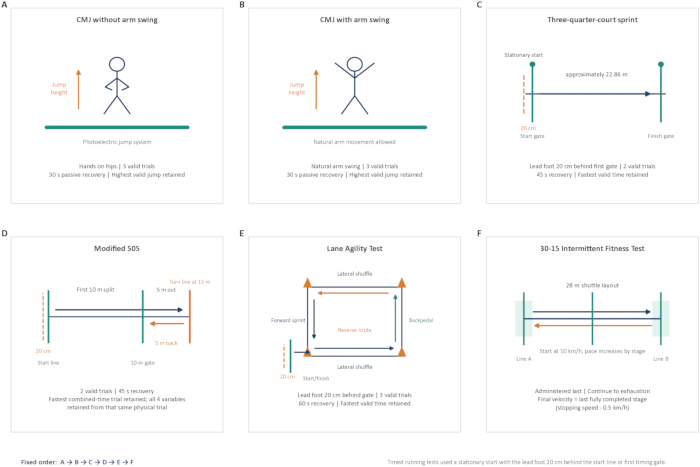
Figure 2: Basketball field-test battery and fixed testing sequence. (A) countermovement jump (CMJ) without arm swing, (B) CMJ with arm swing, (C) the approximately 22.86 m three-quarter-court sprint, (D) the modified 505, (E) the Lane Agility Test, and (F) the 28 m 30–15 Intermittent Fitness Test (30–15 IFT). The figure identifies trial numbers, within-test recovery intervals, the 20 cm stationary start offset for timed running tests, timing-line or route positions, and the retained-score rule. Generic equipment terminology is used in the artwork; manufacturer and model information are provided in the Table of Materials. Please click here to view a larger version of this figure.
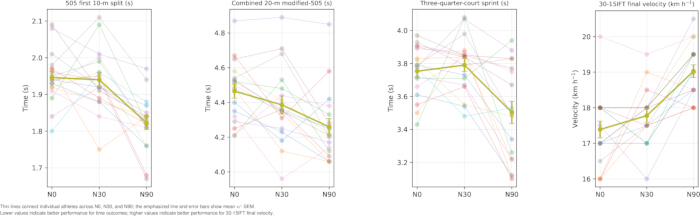
Figure 3: Individual within-athlete trajectories for the four outcomes that remained significant after Benjamini–Hochberg false-discovery-rate correction. Thin lines show individual athletes across N0, N30, and N90; the bold summary line and error bars show mean ± standard error of the mean (SEM). N0 = no nap seated wakefulness; N30 = 30 min scheduled nap opportunity; N90 = 90 min scheduled nap opportunity; 30–15 IFT = 30–15 Intermittent Fitness Test. Lower values indicate better performance for the three-time outcomes; higher values indicate better performance for final velocity. Please click here to view a larger version of this figure.
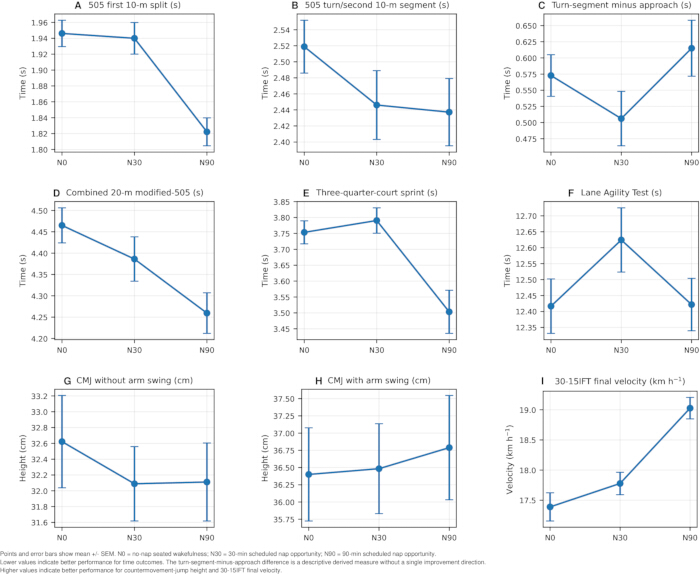
Figure 4: Condition means for all nine prespecified outcomes. Points and error bars show mean ± standard error of the mean (SEM) for N0 (no nap seated wakefulness), N30 (30 min scheduled nap opportunity), and N90 (90 min scheduled nap opportunity). (A) Modified-505 first 10 m split; (B) modified-505 turn/second-10 m segment; (C) turn-segment–approach difference; (D) combined modified-505 completion time; (E) three-quarter-court sprint; (F) Lane Agility Test; (G) countermovement jump (CMJ) without arm swing; (H) CMJ with arm swing; and (I) 30–15 Intermittent Fitness Test (30–15 IFT) final velocity. Lower values indicate better performance for time outcomes. The turn-segment–approach difference is a descriptive, derived measure without a single direction of improvement. Higher values indicate better performance for CMJ height and 30–15 IFT final velocity. Please click here to view a larger version of this figure.
| Domain | Item | Final accounting / definition | Handling / interpretation |
| Study fidelity | Completion and sequence balance | All 18 athletes completed N0, N30, and N90, yielding 54 participant-condition observations. The six possible crossover sequences each included three athletes. No retained outcome was missing. | Primary analysis used all 54 observations. |
| Study fidelity | Recorded protocol deviations | Seven participant-condition observations were flagged: P03 had insufficient warm-up in N0 and N30; P09 arrived 2 min late in N0 and N30; P15 reported mild cold symptoms in N0, N30, and N90. | These observations were retained in the primary analysis and examined in a sensitivity analysis. |
| Study fidelity | Protocol-deviation sensitivity analysis | Excluding the seven flagged observations left 47 observations from 17 athletes. | The same four outcomes remained significant after BH false-discovery-rate correction: modified-505 first 10-m split, combined modified-505 time, three-quarter-court sprint, and 30-15IFT final velocity. |
| Trial retention and invalid attempts | Retained-trial rule | For each CMJ condition, the highest valid jump was retained. For the three-quarter-court sprint and Lane Agility Test, the fastest valid trial was retained. For the modified 505, the valid trial with the fastest combined time was retained, and all modified-505 components were taken from that same trial. | A retained outcome was never assembled from components belonging to different modified-505 trials. |
| Trial retention and invalid attempts | Invalid-attempt criteria | Attempts were excluded for rule violations, false starts, premature timing-gate activation, missed lines or required areas, apparatus contact, route or movement-sequence error, or device/timing interference. | Missing performance values were not simulated, interpolated, or back-calculated. |
| Trial retention and invalid attempts | Invalid-attempt accounting | Ten participant-condition records contained at least one invalid attempt; a valid repeat was available in every such record. | All retained outcomes were observed valid trials; the original separate invalid-trial log is no longer recoverable. |
| Modified-505 derivation | Derived variables | First 10-m split = approach segment. Turn/second-10-m segment = return segment. Turn-segment–approach difference = turn/second-10-m segment minus first 10-m split. Combined modified-505 time = first 10-m split plus turn/second-10-m segment. | Derived values were recalculated from the two retained split values of the same selected modified-505 trial. |
| Data handling | Final analysis dataset | The final analysis dataset contained 54 participant-condition rows (18 athletes × 3 conditions), with no missing retained outcomes. Modified-505 derived variables were recalculated from the retained split values of the same selected trial. | The analysis dataset was checked for structural completeness and arithmetic consistency; native device exports were unavailable for independent source-file verification. |
| 0.02-s timing correction | Correction and source-data limitation | A fixed 0.02-s device-related timing adjustment associated with the SWIFT G4 timing-processing procedure was applied to the N0 turn/second-10-m component. | The native SWIFT export and contemporaneous device-level record could not be recovered, so the adjustment cannot be independently reverified against the original source file. |
| 0.02-s timing correction | Affected values and recalculation | The correction affected 18 N0 turn/second-10-m values (+0.02 s). The corresponding turn-segment–approach differences and combined times were recalculated; first 10-m split values were unchanged. | Corrected and pre-correction analysis datasets were preserved separately. |
| 0.02-s timing correction | Sensitivity analysis | All nine outcome analyses were repeated using the pre-correction data. | No BH-FDR-level inference changed. The same four outcomes remained significant after BH FDR correction with and without the adjustment. |
| Source-data preservation | Recoverable records | The study repository contains the final corrected trial-level workbook, corrected and pre-correction analysis datasets, crossover sequence/period mapping, N30/N90 VAS values, protocol-deviation flags, the N0 modified-505 correction record, final R code and statistical outputs/diagnostics/software environment, and figure-source data. | These materials document the reported analyses and the timing-correction sensitivity analysis. |
| Source-data preservation | Irretrievable source records | Native SWIFT G4 timing-system exports, native Microgate OPTOJUMP exports, the original separate invalid-trial log, and complete stage-by-stage 30-15IFT records could not be recovered. | The manuscript distinguishes unavailable native source records from the curated analysis data used for the reported analyses. |
Table 1: Study fidelity, recorded protocol deviations, invalid-trial handling, modified-505 derivation, 0.02 s timing correction, and source-data preservation. Seven participant-condition observations carried a protocol-deviation flag; ten participant-condition records included at least one invalid attempt but had a valid repeat available. The timing correction affected the 18 N0 turn/second 10 m values (+0.02 s), and the corresponding derived variables were recalculated; sensitivity analysis showed that no FDR-level inference depended on the adjustment. Abbreviations: N0 = no-nap seated wakefulness; N30 = 30 min scheduled nap opportunity; N90 = 90 min scheduled nap opportunity; BH FDR = Benjamini–Hochberg false-discovery-rate correction.
| Variable | Value |
| Age (yr) | 19.6 ± 1.4 |
| Height (cm) | 179.5 ± 6.2 |
| Body mass (kg) | 74.1 ± 5.2 |
| Body fat (%) | 21.5 ± 2.6 |
| Training experience (yr) | 8.2 ± 2.7 |
| Point guards, n (%) | 4 (22.2) |
| Shooting guards, n (%) | 1 (5.6) |
| Small forwards, n (%) | 5 (27.8) |
| Power forwards, n (%) | 3 (16.7) |
| Centers, n (%) | 5 (27.8) |
| MEQ score | 43.3 ± 3.3 |
| PSQI score | 6.8 ± 2.3 |
| ASBQ-2 score | 27.7 ± 4.2 |
| Sleep-quality VAS after N30 (0–100 mm) | 79.0 ± 5.3 |
| Sleep-quality VAS after N90 (0–100 mm) | 81.2 ± 6.5 |
| Regular daytime nap habit, n (%) | 18 (100) |
Table 2: Participant characteristics and sleep-related descriptors (n = 18). Values are mean ± SD unless otherwise stated. Abbreviations: MEQ = Morningness–Eveningness Questionnaire; PSQI = Pittsburgh Sleep Quality Index; ASBQ-2 = Athlete Sleep Behavior Questionnaire-2; VAS = visual analog scale; N30 = 30 min scheduled nap opportunity; N90 = 90 min scheduled nap opportunity.
| Outcome | N0 | N30 | N90 | F (df) | Raw p | FDR p |
| Modified-505 first 10 m split (s) | 1.95 ± 0.07 | 1.94 ± 0.08 | 1.82 ± 0.07 | 17.00 (2, 32) | <0.001 | <0.001 |
| Modified-505 turn/second 10 m segment (s) | 2.52 ± 0.14 | 2.45 ± 0.18 | 2.44 ± 0.18 | 2.13 (2, 32) | 0.135 | 0.173 |
| Turn-segment–approach difference (s) | 0.57 ± 0.14 | 0.51 ± 0.18 | 0.61 ± 0.18 | 2.19 (2, 44) | 0.124 | 0.173 |
| Combined modified-505 completion time (s) | 4.46 ± 0.17 | 4.39 ± 0.22 | 4.26 ± 0.20 | 10.38 (2, 32) | <0.001 | <0.001 |
| Three-quarter-court sprint time (s) | 3.75 ± 0.15 | 3.79 ± 0.17 | 3.50 ± 0.29 | 15.35 (2, 44) | <0.001 | <0.001 |
| Lane Agility Test time (s) | 12.42 ± 0.36 | 12.62 ± 0.43 | 12.42 ± 0.35 | 2.22 (2, 32) | 0.125 | 0.173 |
| CMJ without arm swing (cm) | 32.62 ± 2.48 | 32.09 ± 2.00 | 32.11 ± 2.09 | 1.00 (2, 32) | 0.381 | 0.428 |
| CMJ with arm swing (cm) | 36.40 ± 2.87 | 36.48 ± 2.77 | 36.79 ± 3.21 | 0.15 (2, 32) | 0.858 | 0.858 |
| 30-15IFT final velocity (km·h⁻¹) | 17.39 ± 0.99 | 17.78 ± 0.79 | 19.03 ± 0.76 | 25.33 (2, 32) | <0.001 | <0.001 |
Table 3: Descriptive statistics and crossover-adjusted omnibus condition effects for all nine outcomes. Values are unadjusted mean ± SD. Mixed-effects models included condition, period, and sequence as fixed effects and participant as a random intercept. FDR p-values were adjusted across the nine condition tests using the Benjamini–Hochberg procedure. Abbreviations: N0 = no nap seated wakefulness; N30 = 30 min scheduled nap opportunity; N90 = 90 min scheduled nap opportunity; CMJ = countermovement jump; 30–15 IFT = 30–15 Intermittent Fitness Test; FDR = false discovery rate.
| Outcome | Contrast | Mean difference | Simultaneous 95% CI | Holm p | Cohen’s dz |
| Modified-505 first 10 m split (s) | N0 − N30 | 0.006 | -0.054 to 0.067 | 0.800 | 0.06 |
| Modified-505 first 10 m split (s) | N0 − N90 | 0.124 | 0.063 to 0.184 | <0.001 | 1.38 |
| Modified-505 first 10 m split (s) | N30 − N90 | 0.118 | 0.057 to 0.178 | <0.001 | 1.20 |
| Combined modified-505 completion time (s) | N0 − N30 | 0.079 | -0.036 to 0.194 | 0.093 | 0.40 |
| Combined modified-505 completion time (s) | N0 − N90 | 0.206 | 0.091 to 0.321 | <0.001 | 1.25 |
| Combined modified-505 completion time (s) | N30 − N90 | 0.127 | 0.012 to 0.242 | 0.018 | 0.60 |
| Three-quarter-court sprint time (s) | N0 − N30 | -0.037 | -0.178 to 0.103 | 0.513 | -0.16 |
| Three-quarter-court sprint time (s) | N0 − N90 | 0.250 | 0.110 to 0.390 | <0.001 | 1.16 |
| Three-quarter-court sprint time (s) | N30 − N90 | 0.287 | 0.147 to 0.428 | <0.001 | 0.97 |
| 30-15IFT final velocity (km·h⁻¹) | N0 − N30 | -0.389 | -0.997 to 0.219 | 0.116 | -0.33 |
| 30-15IFT final velocity (km·h⁻¹) | N0 − N90 | -1.639 | -2.247 to -1.031 | <0.001 | -2.05 |
| 30-15IFT final velocity (km·h⁻¹) | N30 − N90 | -1.250 | -1.858 to -0.642 | <0.001 | -1.28 |
Table 4: Pairwise comparisons for the four outcomes that remained significant after false-discovery-rate correction. Contrasts are expressed as the first-listed condition minus the second-listed condition. Positive differences for time outcomes and negative differences for 30–15 IFT final velocity favor the second-listed condition. Pairwise contrasts are based on estimated marginal means. P-values were Holm-adjusted across the three pairwise contrasts within each outcome, and 95% confidence intervals are Bonferroni-adjusted simultaneous intervals for the same family of three contrasts. Cohen’s dz was calculated from participant-matched raw differences. Abbreviations: N0 = no nap seated wakefulness; N30 = 30 min scheduled nap opportunity; N90 = 90 min scheduled nap opportunity; CI = confidence interval; dz = participant-matched Cohen’s d.
Supplementary Coding File 1. R scripts used for statistical analysis and figure generation. The supplementary coding file contains the R scripts used for the final statistical analyses, analysis of visual analog scale (VAS) data, and generation of Figure 4. The scripts include data-integrity checks, primary mixed-effects modeling, multiple-comparison correction, sensitivity analyses, model diagnostics, and generation of statistical and graphical outputs.Please click here to download this file.
Discussion
The central finding is selective rather than generalized. Four of nine prespecified outcomes remained significant after BH FDR correction, and all four involved sprinting or intermittent running. Relative to both N0 and N30, N90 was associated with a faster modified-505 first 10 m split, faster combined modified-505 completion, faster three-quarter-court sprinting, and higher 30–15 IFT final velocity. N30 did not outperform N0 for any outcome that survived multiplicity control. The data therefore support a domain-specific condition effect rather than a uniform enhancement across the basketball field-test battery.
The exposure boundary is equally important. N30 and N90 were scheduled nap-opportunity/recovery-condition packages, not verified 30- and 90-min sleep doses. N90 provided more time in the nap setting, as well as in darkness, recumbency, sensory reduction, device-free rest, and the possibility of sleep. Because sleep onset, latency, duration, efficiency, and stages were not objectively measured, the N90–N30 contrast cannot establish that 90 min of actual sleep is superior to 30 min. The present result should therefore be interpreted as an effect of assignment to standardized recovery opportunities, consistent with the heterogeneous napping literature6,7,8,9.
The modified-505 decomposition narrows the scope of performance interpretation. N90 improved the first 10 m approach component and combined completion time, but not the turn/second-10 m segment. Conventional 505 performance is influenced by approach speed, braking, plant mechanics, reacceleration, and lower-limb strength18,19. A faster combined time can therefore occur without a demonstrable improvement in turning-specific ability. The derived turn-segment–approach difference was also method sensitive: it was non-significant in the primary mixed model but significant in the Friedman sensitivity analysis. Lane Agility and both CMJ conditions likewise did not survive multiplicity control. These null domains should be weighted alongside the four positive findings rather than treated as secondary exceptions.
The statistical checks support the stability of the four FDR-significant outcomes while identifying where inference is fragile. The same four outcomes were retained by the period-adjusted and condition-only mixed models, exclusion of the seven protocol-deviation observations, the Friedman sensitivity analysis for the four main outcomes, and the corrected-versus-pre-correction rerun. The sprint model was singular because the estimated participant random-intercept variance was effectively zero, but alternative analyses reproduced the condition effect. By contrast, the segment-difference outcome showed disagreement between the model and the data and was interpreted conservatively. The 0.02 s N0 modified-505 timing correction is limited by the unavailability of the original native device export, which prevents independent verification of the adjustment against the device-level source. However, the complete pre-correction rerun yielded the same four FDR-significant outcomes, and no FDR-level inference depended on the adjustment.
Several limitations remain. The cohort comprised 18 habitual nappers from one female collegiate team; no prospective sample-size calculation was performed, and the estimates require replication rather than broad population generalization. Previous-night sleep, trial-day sleepiness or vigilance, menstrual-cycle phase and symptoms, objective training load, exact dietary intake, and day-level environmental measurements were not collected. Participants could not be blinded to whether they were seated or given the opportunity to nap. Contemporaneous staffing documentation is insufficient to verify formal assessor masking; accordingly, the study is not characterized as assessor-blinded. The fixed test order improved procedural consistency but did not permit separation of task-specific responses from potential order-related accumulated fatigue. Native device exports, the original separate invalid-trial log, and complete stage-level 30–15 IFT records are no longer recoverable. Future work should combine balanced crossover scheduling with validated actigraphy or polysomnography, standardized previous-night sleep assessment, day-level sleepiness or vigilance measures, menstrual symptom tracking, quantified training load, larger multi-team samples, and prospectively preserved native device records. Within these limits, the present protocol provides a reproducible framework for testing whether assigned afternoon recovery opportunities alter specific components of later-day basketball field performance.
Disclosures
The authors declare no competing interests. No generative AI was used to conduct the experiment or collect study data. During revision, OpenAI ChatGPT was used to assist with language editing, organization of responses to reviewers, literature discovery, statistical-code development and review, statistical consistency checking, table and figure preparation, and manuscript restructuring. The authors executed the final statistical analyses in R, reviewed the source data and outputs, verified the final tables and figures, and took full responsibility for the submitted work.
Acknowledgements
The authors thank the participating athletes, coaching staff, and personnel who assisted with scheduling and data collection. This research received no specific grant from any funding agency in the public, commercial, or not-for-profit sectors.
Materials
| Name | Company | Catalog Number | Comments |
|---|---|---|---|
| 30-15IFT audio application and speaker | Application/provider and speaker manufacturer not recoverable from archived records | Application version unavailable; speaker model unavailable | Administered the 28-m 30-15 Intermittent Fitness Test using the same audio source and speaker position across conditions. The exact historical application version and speaker model could not be recovered from archived records. |
| Air-conditioning system | Existing facility; manufacturer not recorded | Model not recorded | Used to standardize the recovery-room environment. The room was maintained at approximately 21 °C; day-level temperature and humidity were not archived. |
| Basketball court and markings | Existing indoor facility; manufacturer not applicable / not recorded | N/A | Standard wooden indoor basketball court with fixed field-test layouts and markings; the same venue and court surface were used across conditions. |
| Beds for nap-opportunity conditions | Existing facility; manufacturer not recorded | Model not recorded | Separate bed for each athlete during N30 and N90 recovery opportunities in the darkened recovery room. |
| Cones and floor tape | Manufacturer not recorded | Model/catalog not recorded | Used to define field-test routes, lines, and required areas. |
| Digital clock / synchronized timing source | Manufacturer not recorded | Model not recorded | Used to enforce the fixed clock-time schedule for N0, N30, and N90 recovery conditions and common testing timeline. |
| Eye masks and earplugs | Manufacturer not recorded | Model/catalog not recorded | Standardized eye masks and earplugs were used during N30 and N90. |
| Microgate OPTOJUMP photoelectric jump system | Microgate S.r.l., Bolzano, Italy | OPTOJUMP; exact historical device/software version unavailable | Used to assess countermovement-jump height with and without arm swing. Native OPTOJUMP export files are no longer recoverable. |
| R packages | R ecosystem / CRAN | lme4 2.0-1; lmerTest 3.2-1; emmeans 2.0.3; ggplot2 4.0.3; readxl 1.5.0 | Used for linear mixed-effects models, Satterthwaite Type III tests, estimated marginal means, multiplicity-adjusted pairwise comparisons, sensitivity analyses, spreadsheet import, and figure-source calculations. |
| R statistical software | R Foundation for Statistical Computing | Version 4.5.3 | Used for the reported analyses: linear mixed-effects models with condition, period, and sequence fixed effects and participant random intercept; BH FDR adjustment across nine omnibus tests; Holm-adjusted pairwise p values; Bonferroni simultaneous 95% confidence intervals; sensitivity analyses; and figure generation. |
| SWIFT G4 timing gates | Swift Performance Equipment, Australia | G4 Timing Gates; exact historical software version unavailable | Single- and dual-beam timing-gate configurations used for the three-quarter-court sprint, modified 505, and Lane Agility Test. Timing-gate beam height was 80 cm and timed tests used a 20-cm start offset. Native SWIFT timing-system exports are no longer recoverable. |
| Visual analog scale form | Author-developed study form | 100-mm VAS; N/A | Subjective perceived sleep-quality rating completed after N30 and N90. The rating does not establish sleep onset or actual sleep duration. |
References
- Stojanovic E, et al. The activity demands and physiological responses encountered during basketball match-play: a systematic review. Sports Med. 2018;48(1):111-35. doi:10.1007/s40279-017-0794-z.
- Gal-Pottyondy A, et al. Collection and advice on basketball field tests: a literature review. Appl Sci. 2021;11(19):8855. doi:10.3390/app11198855.
- Fullagar HHK, et al. Sleep and athletic performance: the effects of sleep loss on exercise performance, and physiological and cognitive responses to exercise. Sports Med. 2015;45(2):161-86. doi:10.1007/s40279-014-0260-0.
- Walsh NP, et al. Sleep and the athlete: narrative review and 2021 expert consensus recommendations. Br J Sports Med. 2021;55(7):356-68. doi:10.1136/bjsports-2020-102025.
- Ochoa-Lacar J, et al. How sleep affects recovery and performance in basketball: a systematic review. Brain Sci. 2022;12(11):1570. doi:10.3390/brainsci12111570.
- Lastella M, et al. To nap or not to nap? A systematic review evaluating napping behavior in athletes and the impact on various measures of athletic performance. Nat Sci Sleep. 2021;13:841-62. doi:10.2147/NSS.S315556.
- Boukhris O, et al. The impact of daytime napping following normal night-time sleep on physical performance: a systematic review, meta-analysis and meta-regression. Sports Med. 2024;54(2):323-45. doi:10.1007/s40279-023-01920-2.
- Mesas AE, et al. Is daytime napping an effective strategy to improve sport-related cognitive and physical performance and reduce fatigue? Br J Sports Med. 2023;57(7):417-26. doi:10.1136/bjsports-2022-106355.
- Hilditch CJ, McHill AW. Sleep inertia: current insights. Nat Sci Sleep. 2019;11:155-65. doi:10.2147/NSS.S188911.
- Cowley ES, Olenick AA, McNulty KL, Ross EZ. “Invisible sportswomen”: the sex data gap in sport and exercise science research. Women Sport Phys Act J. 2021;29(2):146-51. doi:10.1123/wspaj.2021-0028.
- McNulty KL, et al. The effects of menstrual cycle phase on exercise performance in eumenorrheic women: a systematic review and meta-analysis. Sports Med. 2020;50(10):1813-27. doi:10.1007/s40279-020-01319-3.
- Kullik L, et al. The impact of menstrual cycle phase and symptoms on sleep, recovery, and stress in elite female basketball athletes: a longitudinal study. Front Physiol. 2025;16:1663657. doi:10.3389/fphys.2025.1663657.
- Buysse DJ, et al. The Pittsburgh Sleep Quality Index: a new instrument for psychiatric practice and research. Psychiatry Res. 1989;28(2):193-213. doi:10.1016/0165-1781(89)90047-4.
- Horne JA, Ostberg O. A self-assessment questionnaire to determine morningness-eveningness in human circadian rhythms. Int J Chronobiol. 1976;4(2):97-110.
- Driller MW, Mah CD, Halson SL. The revised Athlete Sleep Behavior Questionnaire (ASBQ-2): aligning with the latest in sleep science research. Int J Sports Sci Coach. 2025;20(6):2681-6. doi:10.1177/17479541251374806.
- Buchheit M. The 30-15 Intermittent Fitness Test: accuracy for individualizing interval training of young intermittent sport players. J Strength Cond Res. 2008;22(2):365-74. doi:10.1519/JSC.0b013e3181635b2e.
- Glatthorn JF, et al. Validity and reliability of Optojump photoelectric cells for estimating vertical jump height. J Strength Cond Res. 2011;25(2):556-60. doi:10.1519/JSC.0b013e3181ccb18d.
- Nimphius S, Callaghan SJ, Spiteri T, Lockie RG. Change of direction deficit: a more isolated measure of change of direction performance than total 505 time. J Strength Cond Res. 2016;30(11):3024-32. doi:10.1519/JSC.0000000000001421.
- Spiteri T, et al. Mechanical determinants of faster change of direction and agility performance in female basketball athletes. J Strength Cond Res. 2015;29(8):2205-14. doi:10.1519/JSC.0000000000000876.
- Bates D, Machler M, Bolker B, Walker S. Fitting linear mixed-effects models using lme4. J Stat Softw. 2015;67(1):1-48. doi:10.18637/jss.v067.i01.
- Kuznetsova A, Brockhoff PB, Christensen RHB. lmerTest package: tests in linear mixed effects models. J Stat Softw. 2017;82(13):1-26. doi:10.18637/jss.v082.i13.
- Benjamini Y, Hochberg Y. Controlling the false discovery rate: a practical and powerful approach to multiple testing. J R Stat Soc Series B. 1995;57(1):289-300. doi:10.1111/j.2517-6161.1995.tb02031.x.
- Holm S. A simple sequentially rejective multiple test procedure. Scand J Stat. 1979;6(2):65-70.
- Lakens D. Calculating and reporting effect sizes to facilitate cumulative science: a practical primer for t tests and ANOVAs. Front Psychol. 2013;4:863. doi:10.3389/fpsyg.2013.00863.