This study examined the serum miR-3619-5p expression levels in patients with type 2 diabetes and investigated the regulatory role of this molecule in pancreatic β-cell function. miR-3619-5p is downregulated in T2DM and may be involved in the regulation of pancreatic β-cell function by targeting MTA3.
Research Article
Clinical Significance of miR-3619-5p Expression in Patients with Type 2 Diabetes and Its Regulation of Pancreatic β-Cell Proliferation
In This Article
Summary
Abstract
The core pathological feature of type 2 diabetes mellitus (T2DM) is pancreatic β-cell failure; therefore, the identification of effective circulating biomarkers and molecular targets that regulate pancreatic β-cell homeostasis is of significant practical importance. As key regulatory molecules of gene expression, miRNAs play an important role in the proliferation, apoptosis, and insulin secretion of pancreatic β-cells. The purpose of this study is to investigate the expression patterns and clinical value of miR-3619-5p in the serum of T2DM and to clarify its regulatory role in pancreatic β-cell proliferation. RT-qPCR was used to detect the expression of miR-3619-5p and MTA3. ROC curves were used to evaluate diagnostic performance. Bioinformatics and dual-luciferase assays were used to validate the target-ligand relationship. Cell proliferation was measured by CCK-8 assay, while apoptosis was examined via flow cytometry. Insulin secretion levels were measured using ELISA. The results showed that miR-3619-5p and MTA3 were downregulated in T2DM patients and pancreatic β-cells. miR-3619-5p might be a biomarker for the diagnosis of T2DM; its overexpression promotes cell proliferation, inhibits apoptosis, and enhances insulin secretion. miR-3619-5p targets and regulates MTA3, and the two are significantly positively correlated. miR-3619-5p mimic can reverse the damage caused by si-MTA3 to pancreatic β-cell function. In short, miR-3619-5p is downregulated in T2DM and has diagnostic value. miR-3619-5p may participate in the regulation of pancreatic β-cell function by targeting MTA3.
Introduction
Chronic metabolic disorder type 2 diabetes mellitus (T2DM) is mainly manifested as insulin resistance accompanied by a progressive loss of insulin secretory function, and it accounts for more than 80% of all diabetes cases1. Its pathogenesis is complex, involving a combination of genetic and environmental factors, as well as abnormalities in cellular and molecular regulation2,3. Given that pancreatic β-cells are the primary cells responsible for insulin secretion, an abnormal decline in their proliferative capacity is a key cause of insufficient insulin secretion in T2DM4. Currently, the clinical diagnosis of T2DM primarily relies on traditional indicators such as blood glucose and glycated hemoglobin (HbA1c); however, their sensitivity for early screening and predicting disease progression is limited5. There is an urgent need to identify sensitive, specific biomarkers and key regulatory targets to provide novel strategies for the precise diagnosis and treatment of T2DM.
Under the influence of glucotoxicity induced by prolonged hyperglycemia, pancreatic β-cell proliferation is restricted and apoptosis increases, leading to a gradual loss of glucose-dependent insulin secretion; this process is a key factor driving the continued progression of the disease6,7. MicroRNAs (miRNAs) are implicated in diverse physiological processes in cells8, and exert a crucial regulatory effect on physiological processes, including pancreatic islet cell proliferation, apoptosis, and insulin secretion9,10. Multiple studies have demonstrated that various miRNAs are abnormally expressed in T2DM and are closely implicated in the pathogenesis of the disease11,12,13. miR-3619-5p participates in biological processes, including cell proliferation and apoptosis, and current research on it has primarily focused on the field of oncology14,15. Abnormal expression of miR-3619-5p has been observed in malignant tumors, including squamous cell carcinoma of the skin, lung cancer, colorectal cancer, and gastric cancer, where it regulates target genes to influence tumor cell proliferation, metastasis, and apoptosis16,17,18,19. However, there remains a clear gap in research regarding the clinical expression characteristics, clinical relevance, and mechanisms of regulation of pancreatic function of miR-3619-5p in T2DM.
As a major member of the MTA family, MTA3 mediates protein-protein interactions and gene transcriptional regulation, and is extensively involved in key physiological processes, including cell proliferation, apoptosis, and metabolism20. Current research on MTA3 has primarily focused on oncology21,22,23, with limited studies investigating its role in metabolic diseases, particularly T2DM. Some studies have found that MTA3, as a diabetes-associated gene, participates in the regulation of hyperglycemia-induced liver fibrosis24. This suggests that MTA3 may be involved in the progression of T2DM; however, whether it is regulated by miR-3619-5p in the context of T2DM remains to be confirmed.
In summary, existing research on miR-3619-5p has largely been confined to tumor and inflammatory models; its clinical expression profile in T2DM and its role in pancreatic β-cell homeostasis and glucose metabolism disorders remain to be explored. Therefore, this study aims to verify the target relationship between miR-3619-5p and MTA3 by assessing the expression and clinical significance of miR-3619-5p in the serum of patients with T2DM, and to investigate its regulatory role in pancreatic β-cell proliferation, thereby providing a new theoretical basis for research into the pathogenesis of T2DM and for clinical diagnosis and treatment.
Protocol
This study was approved by the TongzhouBay People's Hospital Medical Ethics Committee (Approval No. 2024122001). The procedures used in this study adhere to the tenets of the Declaration of Helsinki. Informed consent was obtained from all individual participants included in the study. Consent for publication was obtained for every individual person’s data included in the study.
Research subjects
This study retrospectively selected 102 patients with T2DM diagnosed at our hospital between January 2022 and June 2023. Eligible participants met the diagnostic criteria for T2DM, including fasting blood glucose ≥7.0 mmol/L and 2-h postprandial blood glucose ≥11.1 mmol/L, had not received treatment with insulin or new-generation antidiabetic drugs within the previous 3 months, had no severe complications involving the heart, liver, kidneys, or other organs and no history of malignant tumors, autoimmune diseases, or infectious diseases, and had complete clinical records. Patients with type 1 diabetes or other specific types of diabetes, those in a state of stress due to severe infection, trauma, surgery, or other causes, those who had used glucocorticoids, immunosuppressants, or similar medications within the previous 3 months, and pregnant or lactating women were excluded. A control group comprising 80 individuals undergoing routine health examinations at our hospital during the same period was also included.
Sample collection
All study participants fasted for at least 8–12 h; 5 mL of venous blood was collected first thing in the morning and dispensed into RNase-free EP tubes, centrifuged (3000 × g, 10 min) to separate the serum, and stored at -80 °C for future use.
Cell culture and treatment
The rat pancreatic islet β-cell line INS-1 was cultured in RPMI 1640 medium containing 10% FBS and 1% penicillin-streptomycin. INS-1 cells were cultured in medium containing 25 mM glucose to establish a high-glucose (HG)-induced cellular damage model25. In the untreated group, INS-1 cells were cultured in RPMI 1640 medium (containing 11.1 mM glucose).
Transfection was performed using the transfection kit with miR-3619-5p mimics, miRNA blank control (miR-NC), si-MTA3, and a blank control (si-NC). The miR-3619-5p mimic, miR-3619-5p inhibitor, siRNA and corresponding negative controls were all purchased from RiboBio. miRNA mimic concentration: 50 nM; miRNA inhibitor concentration: 100 nM; siRNA concentration: 50 nM. Subsequent experiments were carried out 48 h after transfection. The relevant sequences are shown in Supplementary Table 1.
Quantitative reverse transcription polymerase chain reaction (RT-qPCR)
TRIzol reagent was used to extract total RNA from serum, while the miRNeasy Mini Kit was used to extract total RNA from cells. For the detection of miR-3619-5p, reverse transcription was performed using a reverse transcription kit; following cDNA synthesis, a miRNA quantification kit was employed, with U6 as the internal control. For the detection of MTA3, reverse transcription to cDNA was performed using an mRNA reverse transcription kit, and RT-qPCR was carried out using an mRNA quantification kit, with GAPDH as the internal control. The changes in the expression of miR-3619-5p and MTA3 were analyzed using the 2-ΔΔCt method. Primer sequences are shown in Supplementary Table 1.
Dual luciferase reporter (DLR) assay
Wild-type (WT) and mutant (MUT) 3'-UTRs of MTA3 containing the miR-3619-5p binding site were cloned into the pmirGLO vector. The vector was co-transfected with the miR-3619-5p mimic and miR-3619-5p inhibitor into 293T cells using transfection reagents. The transfection control groups included: the empty reporter plasmid group (Control) and the miRNA negative control transfection group (miR-NC). After 48 h, relative luciferase activity was measured using a dual-luciferase reporter system, with Renilla luciferase activity serving as an internal control. Each group comprises three independent biological replicates, with each biological replicate consisting of three technical replicates.
Cell proliferation assay
Seed the transfected cells into a 96-well plate. After culturing for 0 h, 24 h, 48 h, and 72 h, respectively, add 10 μL of CCK-8 reagent to each well, incubate at 37 °C for 2 h, and measure the absorbance at 450 nm using a microplate reader.
Apoptosis assay
Wash the cells three times with PBS, then resuspend them in 200 μL of binding buffer containing 10 μL of Annexin V-FITC and 5 μL of PI. Incubate for 15 min at room temperature in the dark. Add 300 μL of binding buffer, then immediately analyze the cells using a flow cytometer to calculate the apoptosis rate.
Enzyme-linked immunosorbent assay (ELISA)
Transfected cells were seeded into a 96-well plate and starved overnight at 37 °C. The culture medium was replaced with a solution containing 25 mM glucose and the cells were cultured for 1 h; the culture medium from the treated INS-1 cells was then collected to measure insulin secretion. The INS-1 cells were resuspended in acidic methanol, sonicated, and the supernatant was collected to determine the total insulin content. The Rat Insulin ELISA Kit was used, and the assay was performed according to the manufacturer’s instructions. The assay utilizes the reference standards supplied with the test kit to construct a calibration curve; the absolute concentration of insulin is calculated based on the absorbance values of the samples, with the unit of absolute concentration being μIU/mL. Finally, insulin secretion capacity was assessed by normalizing the levels of insulin measured in the culture medium against the total intracellular insulin content. The data in the statistical graphs are presented as fold changes, calculated relative to the control group.
Western blot
Transfected cells from each group were harvested, and RIPA lysis buffer was added. The total protein concentration was determined using the BCA method. 50 μg of total protein was mixed with 5× loading buffer and boiled for 10 min. Following 10% SDS-polyacrylamide gel electrophoresis, transfer the proteins to a polyvinylidene fluoride membrane. Block with 5% skimmed milk for 1 h; add the primary antibodies MTA3 (1:1000) and GAPDH (1:1000) and incubate overnight at 4 °C; wash the membrane with TBST, then add the HRP-labeled goat anti-rabbit IgG secondary antibody (1:1000) and incubate at room temperature for 1 h; visualize using the ECL chemiluminescence method.
Statistical analysis
Quantitative data are expressed as mean ± standard deviation. Before conducting statistical analysis, the Shapiro–Wilk test was used to verify the normality of the data, and Levene’s test was used to assess the homogeneity of variances, to determine the suitability of parametric tests. The results of these tests indicated that all quantitative data in this study followed a normal distribution and satisfied the assumption of homogeneity of variances; therefore, parametric tests were employed for statistical analysis. An independent samples t-test was used to analyze data from two groups, while one-way analysis of variance (ANOVA) with Tukey’s post-hoc test was employed for comparisons between multiple groups. Scatter plots were used to assess linear relationships between variables. Pearson correlation analysis was applied, where the assumptions of normality and linearity were met. The Pearson correlation analysis included all 102 participants; no outliers were excluded. The clustering of points observed in the scatter plot is due to the overlap of sample observations. All experiments included three replicate samples, and each experiment was repeated three times. The p-value of <0.05 was considered statistically significant.
Results
Comparison of demographic characteristics and clinical metabolic parameters among study participants
The comparison results showed that FBG and HbA1c levels were markedly elevated in patients with T2DM (P < 0.001), while there were no significant differences in other parameters (P > 0.05) (Table 1).
Expression and clinical significance of miR-3619-5p
RT-qPCR analysis revealed that the expression of miR-3619-5p in the serum of T2DM patients was significantly reduced (P < 0.001; Figure 1A). ROC curve analysis showed that the AUC for miR-3619-5p in diagnosing T2DM was 0.871 (95% CI: 0.820–0.922) (Figure 1B). Furthermore, the results of a Pearson correlation analysis conducted on 102 patients with T2DM showed that miR‑3619‑5p expression was markedly and inversely related to FBG (Figure 1C) and HbA1c (Figure 1D).
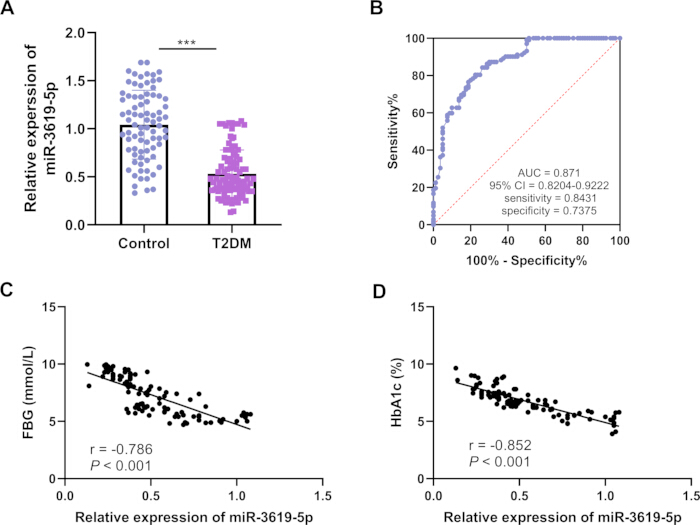
Figure 1: Expression and clinical significance of miR-3619-5p. (A) RT-qPCR analysis of miR-3619-5p expression in the serum of patients with T2DM. (B) ROC curve for the diagnosis of T2DM using miR-3619-5p. (C) Pearson correlation analysis between the relative expression of miR-3619-5p and fasting blood glucose (FBG). (D) Pearson correlation analysis between the relative expression of miR-3619-5p and HbA1c. The error bars represent the standard deviation (SD); Control, n = 80; T2DM, n = 102. ***P < 0.001 Please click here to view a larger version of this figure.
The effect of miR-3619-5p on pancreatic β-cell function
We conducted cellular functional assays on INS-1 pancreatic β-cells treated with HG to mimic the progression of T2DM. The results revealed that the expression of miR-3619-5p was significantly reduced after HG treatment (P < 0.001), whereas transfection with a miR-3619-5p mimic markedly upregulated its expression (P < 0.01; Figure 2A). Regarding cell proliferation and apoptosis, HG treatment markedly inhibited cell proliferation and promoted apoptosis (P < 0.001), whereas the miR-3619-5p mimic promoted proliferation and inhibited apoptosis following HG treatment (P < 0.01; Figure 2B,C). ELISA results showed that insulin secretion was significantly reduced after HG treatment (P < 0.001), whereas the miR-3619-5p mimic increased insulin secretion following HG treatment (P < 0.01; Figure 2D).
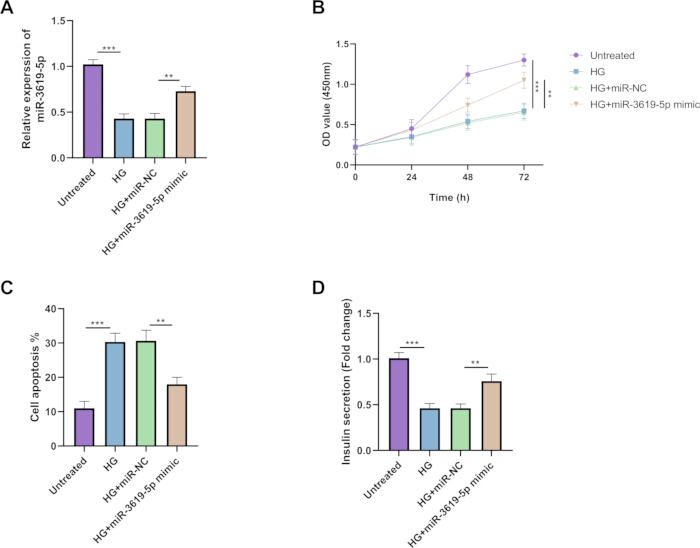
Figure 2: Effect of miR-3619-5p on pancreatic β-cell function. INS-1 pancreatic β-cells were treated with HG to simulate the progression of T2DM. (A) RT-qPCR was used to detect the expression of miR-3619-5p in the cells. (B) Cell proliferation was assessed using the CCK-8 assay. (C) Flow cytometry was used to assess cell apoptosis. (D) ELISA was used to measure insulin secretion levels (normalized by total intracellular insulin content). The error bars represent the standard deviation (SD), n = 3. ***P < 0.001; **P < 0.01 Please click here to view a larger version of this figure.
Validation of miR-3619-5p targets
Bioinformatics predictions revealed a total of 174 target genes across four databases (Figure 3A), and the MTA3 binding site exhibits a high degree of conservation (Context++ score: -0.31; Context++ score percentile: 98). A complementary binding site between miR-3619-5p and the 3'-UTR region of MTA3 (Figure 3B) was identified. DLR results showed that the relative luciferase activity of MTA3 WT was significantly increased in the miR-3619-5p mimic group, indicating that miR-3619-5p can bind to MTA3 (Figure 3C).
The expression of MTA3 was markedly reduced in the serum of T2DM patients (Figure 3D); its expression was also significantly reduced in HG-treated INS-1 cells, whereas the miR-3619-5p mimic upregulated MTA3 expression (Figure 3E). Western blot results showed that the miR-3619-5p mimic upregulated the protein levels of MTA3, while the miR-3619-5p inhibitor significantly downregulated its expression (Supplementary Figure 1). Pearson correlation analysis revealed a significant positive correlation between miR-3619-5p and MTA3 levels in the serum of 102 patients with T2DM (Figure 3F). These results further validate the positive regulatory role of miR-3619-5p on MTA3.
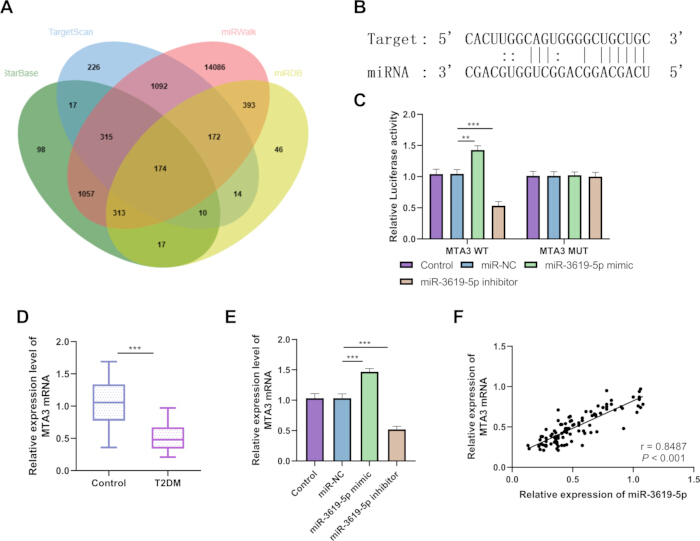
Figure 3: Validation of miR-3619-5p targets. (A) Common target genes of miR-3619-5p identified in the four databases: TargetScan, miRWalk, StarBase and miRDB. (B) Binding site of miR-3619-5p to the 3’-UTR of MTA3. (C) DLR assay (n = 3). (D) RT-qPCR analysis of MTA3 expression in the serum of patients with T2DM (Control, n = 80; T2DM, n = 102). (E) RT-qPCR analysis of MTA3 expression in cells (n = 3). (F) Pearson correlation analysis of miR-3619-5p and MTA3 expression in the serum of patients with T2DM (Control, n = 80; T2DM, n = 102). The error bars represent the standard deviation (SD). ***P < 0.001; **P < 0.01 Please click here to view a larger version of this figure.
The effects of MTA3 on pancreatic β-cell function
The results showed that si-MTA3 further reduced MTA3 expression following HG treatment, whereas co-transfection with miR-3619-5p mimic reversed this effect (Figure 4A). si-MTA3 further inhibited the proliferation of HG-treated cells, promoted apoptosis, and exacerbated the impairment of insulin secretion; whereas co-transfection with the miR-3619-5p mimic reversed the aforementioned cellular phenotypes mediated by si-MTA3, restoring cell proliferation, reducing apoptosis, and alleviating the inhibition of insulin secretion (Figure 4B–D).
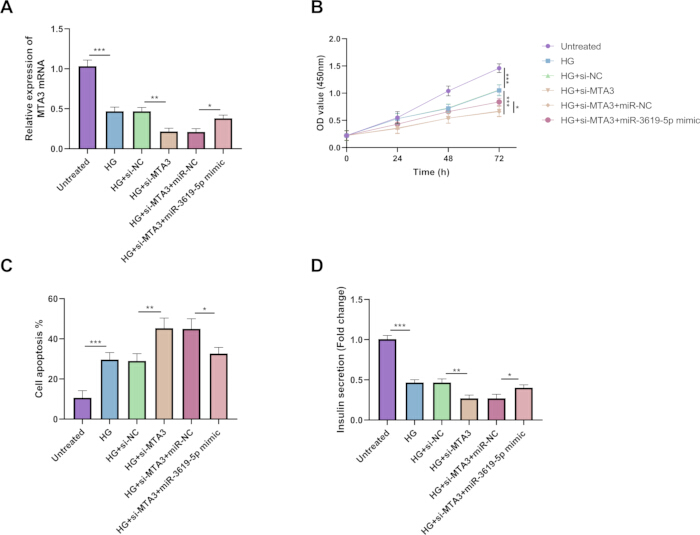
Figure 4: Effect of MTA3 on pancreatic β-cell function. si-MTA3 and miR-3619-5p mimic were transfected into cells further to investigate the effect of MTA3 on pancreatic β-cell function. (A) RT-qPCR analysis of MTA3 expression in cells. (B) Cell proliferation was assessed using the CCK-8 assay. (C) The apoptosis rate was determined by flow cytometry. (D) ELISA measured insulin secretion levels (normalized by total intracellular insulin content). The error bars represent the standard deviation (SD), n = 3. ***P < 0.001; **P < 0.01; *P < 0.05 Please click here to view a larger version of this figure.
In summary, the results from clinical samples show that serum miR-3619-5p expression is significantly downregulated in patients with T2DM, and that miR-3619-5p is significantly correlated with FBG and HbA1c; cell-based experiments confirmed that miR-3619-5p can specifically regulate MTA3, thereby influencing the viability and insulin secretory function of INS-1 rat pancreatic β-cells. Taken together, these results suggest that miR-3619-5p is involved in the regulation of pancreatic β-cell function, thereby preliminarily fulfilling the research objective of this study to investigate the role of miR-3619-5p in type 2 diabetes and its potential regulatory mechanisms.
DATA AVAILABILITY:
All raw and processed datasets supporting the conclusions of this study are uploaded as Supplementary File 1.
| Indicators | Control group (n = 80) | T2DM group (n = 102) | P value |
| Age (years) | 51.41 ± 9.70 | 52.29 ± 7.03 | 0.478 |
| Gender (male/female) | 43/37 | 54/48 | 0.914 |
| BMI (kg/m2) | 24.04 ± 3.10 | 24.81 ± 3.04 | 0.093 |
| TC (mmol/L) | 4.60 ± 0.64 | 4.78 ± 0.65 | 0.068 |
| TG (mmol/L) | 1.61 ± 0.18 | 1.67 ± 0.26 | 0.093 |
| HDL-C (mmol/L) | 1.43 ± 0.13 | 1.38 ± 0.18 | 0.085 |
| LDL-C (mmol/L) | 2.55 ± 0.29 | 2.63 ± 0.31 | 0.067 |
| FBG (mmol/L) | 4.96 ± 0.97 | 7.16 ± 1.64 | <0.001 |
| HbA1c (%) | 4.42 ± 0.49 | 6.77 ± 1.16 | <0.001 |
Table 1: Comparison of clinical parameters among subjects. T2DM, type 2 diabetes mellitus; BMI, body mass index; TC, total cholesterol; TG, triglyceride; HDL, high-density lipoproteins; LDL, low-density lipoproteins; FBG, fasting blood glucose; HbA1c, glycosylated hemoglobin.
Supplementary Table 1: Primer and reagent sequences used in this study.Please click here to download this file.
Supplementary Figure 1: Protein expression of MTA3. Western blot analysis of MTA3 protein levels. (A) MTA3 protein levels. (B) Raw Western blot images of MTA3. (C) Raw Western blot images of GAPDH. The error bars represent the standard deviation (SD), n = 3. ***P < 0.001; **P < 0.01Please click here to download this file.
Supplementary File 1: Raw data.Please click here to download this file.
Discussion
The core pathological features of T2DM are insulin resistance and pancreatic β-cell dysfunction, with reduced proliferative capacity and decreased numbers of pancreatic β-cells as the key drivers of abnormal insulin secretion and the primary drivers of disease progression26. Identifying key molecules that can regulate pancreatic β-cell proliferation and improve their function is of great significance for the precision diagnosis and treatment of T2DM.
As key regulatory molecules of gene expression, miRNAs exert a critical function in pancreatic β-cell proliferation, apoptosis, and insulin secretion. Numerous miRNAs are closely associated with the pathogenesis of T2DM27,28,29. Song et al. found that knockdown of miR-3619-5p inhibits cell migration in colorectal cancer30. Other studies have found that miR-3619-5p is downregulated in patients with diabetes undergoing peritoneal dialysis31. However, the role and mechanisms of miR-3619-5p in T2DM have not yet been reported. This study found that serum miR-3619-5p expression in patients with T2DM was significantly lower than in the healthy control group, consistent with the findings of Costa et al.31, indicating that decreased miR‑3619‑5p expression may be closely linked to the initiation and development of T2DM. Correlation analysis indicated that miR-3619-5p expression was negatively correlated with FBG and HbA1c, indicating that lower miR-3619-5p expression is associated with poorer glycemic control in patients. This further confirms that miR-3619-5p may be implicated in the metabolic dysregulation process of T2DM, and its expression level may reflect the severity of the disease; this is consistent with the findings of Chen et al., who reported that differentially expressed RNAs may be involved in lipid metabolism, insulin secretion, and glucose regulation32. The findings from the ROC curve analysis suggest that it may be a biomarker for T2DM diagnosis, compensating for the lack of sensitivity in early diagnosis associated with traditional blood glucose indicators.
Abnormal decline in pancreatic β-cell proliferative capacity is a central component of pancreatic islet failure in T2DM; promoting pancreatic β-cell proliferation and increasing cell numbers is key to improving insulin secretion function33,34. This study demonstrated through cellular experiments that miR-3619-5p markedly promotes INS-1 cell proliferation and inhibits apoptosis, thereby increasing insulin secretion. This suggests that miR-3619-5p may improve insulin secretion function by promoting pancreatic β-cell proliferation and inhibiting apoptosis, thereby participating in the pathogenesis of T2DM. This is consistent with the regulatory mechanisms of miRNAs in pancreatic β-cell proliferation described in prior studies, such as miR-26a-5p and miR-765, which promote pancreatic β-cell proliferation and differentiation by regulating the expression of target genes35,36.
This study utilized bioinformatics predictions and DLR assays to confirm that MTA3 is a target gene of miR-3619-5p. As a metastasis-associated protein, MTA3 is extensively involved in key physiological processes such as cell proliferation, apoptosis, and metabolism20. Research has found that MTA3 participates in the regulation of high-glucose-induced liver fibrosis24. T2DM-mediated suppression of MTA3 is linked to increased oxidative stress in the testes37. In this study, MTA3 was downregulated in HG-treated cells. Taken together with the results of cell proliferation assays, it is hypothesized that si-MTA3 may contribute to the pathogenesis of T2DM by inhibiting pancreatic β-cell proliferation, whereas miR-3619-5p may alleviate this inhibition by regulating MTA3 expression, thereby improving pancreatic β-cell function. The clarification of this mechanism further refines the molecular network of miRNA regulation of pancreatic β-cell proliferation and provides a new perspective for research on the pathogenesis of T2DM.
The findings of this study have potential clinical and translational value. Serum miR-3619-5p can be detected in peripheral venous blood; if validated in subsequent large-scale cohort studies, it holds promise as an auxiliary biological marker to assist clinicians in identifying individuals at risk of pancreatic β-cell dysfunction, thereby enabling earlier risk stratification. miR-3619-5p can mitigate hyperglycemia-induced damage to pancreatic β-cells by targeting and regulating the MTA3 pathway to maintain β-cell survival and insulin secretion. This suggests that the miR-3619-5p/MTA3 axis has the potential to serve as a new target for islet protection in diabetes, providing fundamental experimental insights for the subsequent development of nucleic acid-based drugs or small-molecule inhibitors to protect islet function.
Several limitations should be noted in the present study: Firstly, our research was conducted at a single center; selection bias may be present, and inter-individual variability among participants is relatively limited. Future investigations should expand the sample size and perform multicenter studies to verify the expression profile and clinical value of miR‑3619‑5p. Secondly, this study validated the regulatory function of miR-3619-5p in pancreatic β-cell proliferation only at the cellular level and did not conduct further validation through animal experiments. Future studies should establish a T2DM animal model to explore its in vivo mechanisms of action further. Thirdly, miRNAs generally exhibit multifunctional characteristics, and miR-3619-5p may also regulate a variety of related genes. At the same time, in vitro transfection systems using miRNA mimics or inhibitors are subject to potential off-target effects; artificial intervention at high doses may non-specifically activate or inhibit multiple signaling pathways, making it difficult to replicate the mode of action observed under physiological conditions fully. Future research requires more comprehensive whole-transcriptome target screening to distinguish between specific targeted regulation and the non-specific biological effects resulting from off-target effects. Fourthly, while this study utilized a 25 mM glucose intervention in its in vitro high-glucose model, no mannitol osmotic control group was established; consequently, it was not possible to fully distinguish between glucose-specific metabolic effects and those resulting from osmotic stress. Future experiments should incorporate osmotic control to further elucidate the mechanism by which high glucose levels affect INS-1 cells. Finally, there is a species mismatch between clinical samples and in vitro cell models; although INS-1 cells are a classic in vitro model for studying the functional maturation of pancreatic β-cells, the regulatory mechanisms observed in rat cells cannot be directly equated with actual biological processes in humans. Therefore, caution should be exercised when interpreting the miR-3619-5p/MTA3 regulatory relationship identified at the in vitro cellular level in this study for clinical applications. Future studies will need to utilize human pancreatic β-cell models or human primary islets to further validate the species conservation of this pathway.
miR-3619-5p is downregulated in the serum and pancreatic β-cells of patients with T2DM; by targeting MTA3, miR-3619-5p can alleviate hyperglycemia-induced pancreatic β-cell dysfunction, promote pancreatic β-cell proliferation, inhibit apoptosis, and improve insulin secretion. This study suggests that miR-3619-5p may be useful in assisting with the stratification of diabetes risk, and that the miR-3619-5p/MTA3 axis is a potential target for islet protection. In the future, we will conduct a larger-scale cohort study to validate its clinical value and carry out in vivo functional validation using animal models of diabetes; at the same time, we will conduct an in-depth analysis of the signaling pathways downstream of MTA3 that mediate changes in islet function and further evaluate the translational potential of this target for islet protection therapy.
Disclosures
The authors have no relevant financial or non-financial interests to disclose.
Acknowledgements
This study was supported by Prevention Strategies for Patients with Diabetes and Urinary Tract Infections (No. MSZ2025119).
Materials
| Name | Company | Catalog Number | Comments |
|---|---|---|---|
| Annexin V-FITC/PI Apoptosis Detection Kit | Roche, Switzerland | 11684795910 | Annexin V-FITC (10 µL) and PI (5 µL) staining; 15 min incubation in dark |
| Cell Counting Kit-8 (CCK-8) | Dojindo, Japan | CK04 | Colorimetric assay for cell viability; 10 µL per well, 2 h incubation, OD450 measurement |
| D-Glucose | Sigma-Aldrich | G7021 | Added to culture medium at 25 mM to establish high-glucose (HG)-induced cellular damage model |
| Dual-Luciferase Reporter Assay System | Promega, USA | E1910 | Sequential measurement of firefly and Renilla luciferase activities |
| Fetal bovine serum (FBS) | Gibco, USA | 10437028 | Supplement at 10% final concentration |
| Flow cytometer | Beckman Coulter, USA | CytoFLEX | Flow cytometry analysis for apoptosis rate calculation |
| GAPDH antibody | Abcam, UK | ab181602 | Western blot |
| GAPDH primers | Sangon Biotech, China | Custom synthesis | Housekeeping gene for mRNA normalization |
| Goat Anti-Rabbit IgG H&L (HRP) | Abcam, UK | ab6721 | Western blot |
| HEK293T cell line | ATCC, USA | CRL-3216 | Human embryonic kidney cells; high transfection efficiency for luciferase assays |
| INS-1 cell line | Sunncell, China | SNL-332 | Rat insulinoma cell line; cultured in RPMI 1640 with 10% FBS and 1% penicillin-streptomycin |
| LightCycler 480 II Real-Time PCR System | Roche, Switzerland | 5015278001 | Real-time PCR amplification; 96-well or 384-well plate format |
| Lipofectamine 3000 | Invitrogen, USA | L3000001 | Lipid-based transfection reagent |
| Microplate reader | BioTek, Agilent | Synergy H1 | Absorbance measurement; sample concentrations interpolated from standard curves |
| miR-3619-5p inhibitors | RiboBio, China | miR20017999-1-5 | Chemically synthesized single-stranded RNA to inhibit miR-3619-5p function |
| miR-3619-5p mimics | RiboBio, China | miR10017999-1-5 | Chemically synthesized double-stranded RNA for miR-3619-5p overexpression |
| miR-3619-5p primers | Sangon Biotech, China | Custom synthesis | Specific primers for miR-3619-5p detection |
| miR-NC (miRNA blank control) | RiboBio, China | miR2N0000001-1-5 | Non-targeting negative control for miRNA mimic/inhibitor experiments |
| miRNeasy Mini Kit | Qiagen, Germany | 217004 | Total RNA extraction from cell samples |
| miScript II RT Kit | Qiagen, Germany | 218160 | Reverse transcription for miRNA; uses poly(A) tailing and oligo-dT priming |
| miScript SYBR Green PCR Kit | Qiagen, Germany | 218073 | SYBR Green-based qPCR for miRNA detection |
| MTA3 antibody | Invitrogen, USA | PA5-100022 | Western blot |
| MTA3 primers | Sangon Biotech, China | Custom synthesis | Specific primers for MTA3 mRNA detection |
| NanoDrop 2000 spectrophotometer | Thermo Fisher Scientific, USA | ND-2000 | RNA concentration and purity assessment |
| Penicillin-Streptomycin | Gibco, USA | 15140122 | Antibiotic solution at 1% to prevent bacterial contamination |
| pmirGLO Dual-Luciferase miRNA Target Expression Vector | Promega, USA | E1330 | Dual-luciferase reporter vector for miRNA target validation; contains firefly and Renilla luciferase genes |
| PrimeScript RT Reagent Kit with gDNA Eraser | TaKaRa, Japan | RR047A | Reverse transcription with genomic DNA elimination step |
| Rat Insulin ELISA Kit | Invitrogen, USA | ERINS | Quantitative detection of insulin secreted by INS-1 cells into culture medium |
| RPMI 1640 medium | Gibco, USA | 11875093 | Basal culture medium; supplemented with 10% FBS and 1% penicillin-streptomycin |
| si-MTA3 | RiboBio, China | siB170209084646-1-5 | Small interfering RNA targeting MTA3 for gene knockdown |
| si-NC (blank control for siRNA) | RiboBio, China | siB06525141922-1-5 | Non-targeting siRNA control |
| SYBR Green Master PCR Mix | TaKaRa, Japan | RR820A | SYBR Green-based qPCR amplification |
| TRIzol Reagent | Invitrogen, USA | 15596026 | Total RNA extraction from serum samples |
| U6 primers | Sangon Biotech, China | Custom synthesis | Endogenous reference for miRNA normalization |
References
- Wang L, et al. Associated factors and principal pathophysiological mechanisms of type 2 diabetes mellitus. Front Endocrinol (Lausanne). 2025;16:1499565.
- Wan Z, et al. The role of systemic inflammation in the association between serum 25-hydroxyvitamin D and type 2 diabetes mellitus. Clin Nutr. 2021;40(6):3661–7.
- Okamoto A, et al. Efficacy and safety of semaglutide in glycemic control, body weight management, lipid profiles and other biomarkers among obese type 2 diabetes patients initiated or switched to semaglutide from other GLP-1 receptor agonists. J Diabetes Metab Disord. 2021;20(2):2121–8.
- Aguayo-Mazzucato C, et al. β Cell Aging Markers Have Heterogeneous Distribution and Are Induced by Insulin Resistance. Cell Metab. 2017;25(4):898–910.e5.
- Goshrani A, Lin R, O'Neal D, Ekinci EI. Time in range-A new gold standard in type 2 diabetes research Diabetes Obes Metab. 2025;27(5):2342–62.
- Niu F, et al. β-cell neogenesis: A rising star to rescue diabetes mellitus. J Adv Res. 2024;62:71–89.
- Zhang Y, et al. THADA inhibition in mice protects against type 2 diabetes mellitus by improving pancreatic β-cell function and preserving β-cell mass. Nat Commun. 2023;14(1):1020.
- Ho PTB, Clark IM, Le LTT. MicroRNA-Based Diagnosis and Therapy. Int J Mol Sci. 2022;23(13).
- Poy MN, et al. A pancreatic islet-specific microRNA regulates insulin secretion. Nature. 2004;432(7014):226–30.
- Karagiannopoulos A, Cowan E, Eliasson L. miRNAs in the Beta Cell-Friends or Foes Endocrinology. 2023;164(5).
- Hu H, et al. Plasma miR-193b-3p Is Elevated in Type 2 Diabetes and Could Impair Glucose Metabolism. Front Endocrinol (Lausanne). 2022;13:814347.
- Benko J, et al. MiR-126 and miR-146a as markers of type 2 diabetes mellitus: a pilot study. Bratisl Lek Listy. 2023;124(7):527–33.
- Liu C, Gao Y, Wu J, Zou J. Exosomal miR-23a and miR-192, Potential Diagnostic Biomarkers for Type 2 Diabetes. Clin Lab. 2021;67(2).
- Liu Y, Li J, Wang S, Song H, Yu T. STAT4-mediated down-regulation of miR-3619-5p facilitates stomach adenocarcinoma by modulating TBC1D10B. Cancer Biol Ther. 2020;21(7):656–64.
- Ma J, et al. M2 macrophage facilitated angiogenesis in cutaneous squamous cell carcinoma via circ_TNFRSF21/miR-3619-5p/ROCK axis. Kaohsiung J Med Sci. 2022;38(8):761–71.
- Zhang M, Luo H, Hui L. MiR-3619-5p hampers proliferation and cisplatin resistance in cutaneous squamous-cell carcinoma via KPNA4. Biochem Biophys Res Commun. 2019;513(2):419–25.
- Ge L, Tan W, Li G, Gong N, Zhou L. Circ_0026134 promotes NSCLC progression by the miR-3619-5p/CHAF1B axis. Thorac Cancer. 2022;13(4):582–92.
- Sun Z, Li X, Shi Y, Yao Y. LncRNA PVT1 facilitates the growth and metastasis of colorectal cancer by sponging with miR-3619-5p to regulate TRIM29 expression. Cancer Rep (Hoboken). 2024;7(6):e2085.
- Wu C, et al. Long Noncoding RNA Plasmacytoma Variant Translocation 1 Regulates Cisplatin Resistance via miR-3619-5p/TBL1XR1 Axis in Gastric Cancer. Cancer Biother Radiopharm. 2020;35(10):741–52.
- Tang Y, et al. Mechanisms of MTA3 in cancer and related diseases and its clinical applications. Front Oncol. 2025;15:1731799.
- Lau P, et al. Sphingosine kinase 1 promotes tumor immune evasion by regulating the MTA3-PD-L1 axis. Cell Mol Immunol. 2022;19(10):1153–67.
- Du L, et al. MTA3 Represses Cancer Stemness by Targeting the SOX2OT/SOX2 Axis. iScience. 2019;22:353–68.
- Liu Y, et al. Discovery of Jaspamycin from marine-derived natural product based on MTA3 to inhibit hepatocellular carcinoma progression. Sci Rep. 2024;14(1):25294.
- Li Q, et al. High glucose promotes hepatic fibrosis via miR‑32/MTA3‑mediated epithelial‑to‑mesenchymal transition. Mol Med Rep. 2019;19(4):3190–200.
- Pu M, Kong L, Li J, Su L, Chen Y. LncRNA NBR2 affects pancreatic β-cell function in type 2 diabetes mellitus by targeting miR-646. Diabetol Metab Syndr. 2025;17(1):454.
- Galicia-Garcia U, et al. Pathophysiology of Type 2 Diabetes Mellitus. Int J Mol Sci. 2020;21(17).
- Wang J, et al. Extracellular vesicles mediate the communication of adipose tissue with brain and promote cognitive impairment associated with insulin resistance. Cell Metab. 2022;34(9):1264–79.e8.
- Rosado JA, Diez-Bello R, Salido GM, Jardin I. Fine-tuning of microRNAs in Type 2 Diabetes Mellitus. Curr Med Chem. 2019;26(22):4102–18.
- Taheri M, Eghtedarian R, Ghafouri-Fard S, Omrani MD. Non-coding RNAs and type 2 diabetes mellitus. Arch Physiol Biochem. 2023;129(2):526–35.
- Song B, et al. LINC00882 Plays a Tumor-promoter Role in Colorectal Cancer by Targeting miR-3619-5p to Up-regulate CTNNB1. Arch Med Res. 2022;53(1):29–36.
- Costa NA, et al. Peritoneal dialysis influences microRNA expression and pro-inflammatory response: results from a cross-sectional study. J Bras Nefrol. 2026;48(1):e20240218.
- Chen J, et al. Identification of the LncRNA PRNCR1/miR-642a-5p/SSTR3 CeRNA network and its diagnostic value in type 2 diabetes mellitus. Diabetol Metab Syndr. 2025;18(1):39.
- Elizabeth MM, et al. Pancreatic β-Cells and Type 2 Diabetes Development. Curr Diabetes Rev. 2017;13(2):108–21.
- Kerper N, Ashe S, Hebrok M. Pancreatic β-Cell Development and Regeneration. Cold Spring Harb Perspect Biol. 2022;14(5).
- Yang F, Zhao S, Zhang X, Ding S, Xu Y. RNF6 Targeted by miR-26a-5p Protects Pancreatic β-Cell Function Against Type 2 Diabetes. Diabetes Metab Syndr Obes. 2022;15:93–102.
- Zheng L, et al. miR-765 targeting PDX1 impairs pancreatic β-cell function to induce type 2 diabetes. Arch Physiol Biochem. 2023;129(6):1279–88.
- Liu F, et al. T2DM-elicited oxidative stress represses MTA3 expression in mouse Leydig cells. Reproduction. 2022;163(5):267–80.