This study presents the Physics-Adaptive Reflectance Harmonization Index (PARHI) for rapid photovoltaic localization using multispectral satellite imagery. The approach combines physically motivated spectral relationships with adaptive weighting to distinguish photovoltaic installations from surrounding surfaces and evaluates its performance across multiple environmental and acquisition conditions.
Research Article
A Physics-Motivated Spectral Index for Cross-Regional Photovoltaic Localization
In This Article
Summary
Abstract
Effective large-scale monitoring is needed as photovoltaic (PV) systems expand across urban and rural areas. Remote sensing provides a practical approach for wide-area PV detection; however, variations in panel materials, climatic conditions, and background surfaces may affect detection performance. Spectral indices may be region-specific or require empirical calibration, restricting their applicability across different settings. This study introduces the Physics-Adaptive Reflectance Harmonization Index (PARHI), a spectral index for cross-regional PV localization using multispectral satellite imagery. PARHI distinguishes PV installations from surrounding surfaces using physically motivated spectral relationships and adaptive weighting of visible, near-infrared (NIR), and short-wave infrared (SWIR) responses. PV localization is performed by applying an empirically selected decision threshold to the PARHI response. Experimental evaluation across the examined locations demonstrated 96.42% accuracy, 95.87% precision, 94.96% recall, a 95.41% F1-score, and a 91.23% Intersection over Union (IoU). Threshold-sensitivity, ablation, seasonal, illumination, and cross-sensor assessments further evaluated performance under the investigated conditions. Thus, PARHI provides an interpretable, training-independent spectral approach for rapid PV localization across the evaluated environments and acquisition conditions. Further validation across broader climatic and geographic settings is required to establish wider generalizability.
Introduction
The global transition toward renewable energy has increased the implementation of photovoltaic (PV) systems in residential, commercial, and utility-scale settings1. Solar power is becoming increasingly important to governments and energy agencies as a means of reducing carbon emissions, enhancing energy security, and supporting sustainable development2. With the continuing rapid growth of PV installations, the need for accurate, scalable, and cost-effective approaches to monitor the distribution and capacity of such installations is increasing3. PV localization is therefore important for grid planning, energy forecasting, policy analysis, and environmental impact assessment4.
Remote sensing has become a feasible approach for large-scale PV detection because it provides consistent, periodic, and extensive spatial coverage5. High-resolution satellite imagery can be used to detect solar panels across different geographical locations without requiring extensive ground surveys6. The spectral properties of PV modules can vary with panel materials, installation angles, weathering conditions, and surrounding land-cover characteristics7. Such variations present challenges for traditional spectral indices, which are often designed for specific environments or depend on empirical thresholds8. Consequently, their performance can decrease when they are applied across different climatic conditions, urban environments, or surface backgrounds9.
Some studies have sought to improve PV detection through machine learning (ML) and deep learning (DL) methods10. Although these approaches can achieve high accuracy, they may require large labeled datasets, substantial computational resources, and retraining when applied to new regions11. Simpler and more interpretable alternatives include physics-guided spectral indices12. These indices can provide detection at reduced computational cost by exploiting the intrinsic reflectance and absorption characteristics of PV materials13. However, existing indices continue to face challenges in maintaining reliable performance across diverse terrains and weather conditions14.
To address these limitations, this study proposes the Physics-Adaptive Reflectance Harmonization Index (PARHI), a spectral index for rapid PV localization15. The proposed approach combines physically motivated reflectance relationships with adaptive spectral weighting to represent the characteristic optical responses of PV modules16. PARHI is designed to balance visible and near-infrared responses to support PV detection across a range of terrains and environmental conditions17. The approach is intended to provide a scalable, interpretable, and efficient framework to support solar monitoring and energy-planning applications at large spatial scales18.
PV research is increasingly integrating physics-guided and artificial intelligence (AI)-driven approaches to improve performance analysis, forecasting, and system monitoring across diverse climates. Prior studies demonstrate the use of physics-guided ML (PGML), DL, and hybrid (HB) modelling to address challenges such as data scarcity, environmental variability, and computational complexity. Existing methods primarily focus on performance prediction rather than spatial localization, highlighting the need for a physics-motivated spectral index for rapid PV detection.
The PV technology landscape is changing rapidly. To forecast the potential and scalability of emerging PV technologies, it is important to understand their performance across different regions. Experimental and computational research activities at large national research centers have often focused on PV performance under specific regional climatic conditions. These regional studies can be difficult to synthesize when evaluating broader performance potential. Because experimental data can be costly to obtain, and because coordinating experiments across national laboratories and addressing data-access and privacy constraints can be challenging, alternative data-efficient approaches have been investigated. One study presented a PGML method for PV applications and showed that the world could be partitioned into several PV-specific climate regions, termed PVZones19.
Urban surface radiometric temperatures, which approximate near-surface kinetic temperatures, are commonly retrieved using satellites or unmanned aerial vehicles (UAVs) and can exhibit substantial spatiotemporal variation. Although both empirical and physical models have been used with UAV data to monitor urban microscale surface radiometric temperatures, their application can involve practical and methodological challenges. Against this background, a study presented a simplified method for obtaining spatially distributed radiometric temperatures under sunny conditions without requiring detailed knowledge of complex radiative-transfer processes or low-altitude atmospheric parameters20.
Diffuse solar radiation (DSR) is important for ecosystem carbon uptake and clean-energy applications. Obtaining spatially continuous and highly accurate all-sky DSR remains challenging because of the limited number of DSR observation stations. To estimate DSR using limited observational information, a physics-guided DL algorithm was developed by combining the strengths of a radiative transfer model (RTM) and DL. The approach used Himawari-8 top-of-atmosphere (TOA) reflectance and angular data as inputs for DSR prediction. Validation using observations from the Baseline Surface Radiation Network (BSRN) and Wuhan University stations indicated strong model performance21.
Solar-cell device characterization, material-parameter extraction, and optimization can be time-consuming and complex. A surrogate, physics-embedded, neural-network-based approach was proposed for extracting limiting material parameters in solar-cell devices. The surrogate model, implemented using an autoencoder network trained on a physical numerical model, enabled estimation of device parameters under specific process conditions using a limited number of illumination-dependent current-voltage (JV) measurements. The model was designed to connect material parameters under a given process condition with the resulting device efficiency22.
Many cyber-physical system (CPS) applications, including design, control, diagnosis, and prognostics, rely on the availability of models. Two broad modeling approaches are physics- or equation-based modeling, also referred to as model-based (MB) modeling, and ML. Increasing attention has been given to combining data-driven ML methods with prior scientific or physics-based knowledge to model CPS. These hybrid learning approaches combine MB and ML methods. HB modeling techniques have therefore emerged as a growing research area within the ML and scientific communities23.
Scientific ML (SciML) has also emerged as an alternative to conventional wave-propagation modeling, which often relies on computationally intensive numerical simulations based on physical equations. SciML enables artificial-neural-network-based models to learn wave physics. Physics-informed neural networks (PINNs), physics-guided neural networks (PgNNs), and neural operators (NOs) represent different approaches within this area. In contrast to PINNs and PgNNs, which are commonly formulated for partial differential equations (PDEs) with associated boundary conditions, NOs can be applied to families of PDEs and may accommodate a range of boundary conditions24.
AI is gaining increasing attention across different areas of PV systems because of continuing growth in computational capabilities and data availability. Conventional techniques used for PV-related tasks such as design, forecasting, control, and maintenance may have limitations in accuracy and precision. AI-based approaches have therefore been investigated for these applications. Previous work has examined available AI technologies across the PV value chain, their potential future applications, and their advantages and limitations relative to conventional approaches13.
Real-time grid operation depends on accurate ultra-short-term PV power prediction, which remains challenging because of substantial seasonal variation and the need to maintain physically consistent predictions. PhyMADformer was proposed as a physics-based hybrid DL framework that incorporates physical knowledge into a dual-input Transformer architecture. The framework suppresses physically implausible nighttime predictions and uses seasonal modulation with diurnally guided attention control to reduce unwanted seasonal effects on meteorological inputs. Experiments across multiple plants and input horizons showed that PhyMADformer outperformed several baseline methods, with a mean decrease in mean squared error (MSE) of 21.87% and a 14.21% decrease in MSE under cross-station transfer conditions without retraining25. Satellite-based PV localization can also use multispectral Earth-observation imagery available through platforms such as the Copernicus Data Space Ecosystem26.
Recent advances in PV detection from remote-sensing imagery have increasingly adopted ML and DL architectures. Yao et al. developed PVSAM by adapting geometric prompts to the Segment Anything Model for PV detection in remote-sensing imagery27. Hafdaoui et al. investigated AI-based detection of PV power plants in satellite imagery28. Alkhatib et al. evaluated attention-integrated U-Net architectures for PV panel segmentation, demonstrating the potential of deep feature learning for extracting PV structures from complex backgrounds29. Table 1 summarizes the existing methods.
| Study | Research Objective | Methodology | Dataset / Data Source | Study Area / Application | Main Parameters | Validation Approach | Key Finding / Contribution |
| Zhong et al.²⁰ | Spatial retrieval of urban surface radiometric temperature | Unmanned aerial vehicle (UAV)-based empirical and physical modeling | UAV observations and atmospheric parameters | Urban environments | Surface radiometric temperature; radiative characteristics | Spatial temperature comparison | Simple retrieval of spatially distributed radiometric temperature under sunny conditions |
| Wang et al.²¹ | Accurate diffuse solar radiation estimation | Physics-guided deep learning combined with radiative transfer modeling | Himawari-8 top-of-atmosphere (TOA) reflectance and angular data | Solar radiation estimation | TOA reflectance; viewing geometry; diffuse solar radiation (DSR) | Baseline Surface Radiation Network (BSRN) and Wuhan University observations | Physics-guided learning improved spatially continuous DSR estimation |
| Ren et al.²² | Solar-cell material parameter extraction | Physics-embedded surrogate neural network | Simulated physical model and illumination-dependent current–voltage (J–V) measurements | Solar-cell devices | Material parameters; J–V characteristics; device efficiency | Numerical model and device measurements | Rapid estimation of limiting material parameters with reduced measurements |
| Rai et al.²³ | Integration of physical and data-driven modeling | Hybrid physics-based and machine-learning modeling | Application-dependent cyber-physical system (CPS) data | Cyber-physical systems | Physical constraints; machine-learning (ML) parameters | Model-based and ML comparison | Established hybrid physics–ML modeling as a complementary framework |
| Mehtaj et al.²⁴ | Physics-aware scientific modeling | Physics-guided neural networks and neural operators | Physics-based simulation data | Wave propagation / partial differential equation (PDE) systems | Governing equations; boundary conditions | Numerical simulation comparison | Demonstrated physics-aware learning for computationally intensive physical systems |
| Kurukuru et al.¹³ | Artificial intelligence applications across the photovoltaic value chain | Machine-learning and artificial intelligence (AI) techniques | Photovoltaic (PV) operational and application-specific datasets | PV design, forecasting, control, and maintenance | Prediction, control, and system-performance parameters | Conventional-method comparison | Highlighted the expanding role and benefits of AI in PV applications |
| Cong et al.²⁵ | Ultra-short-term PV power forecasting | Physics-based hybrid Transformer (PhyMADformer) | Multi-plant PV and meteorological data | PV power forecasting | Seasonal factors; meteorological inputs; physical constraints | Multi-plant and cross-station evaluation | Improved forecasting through physics-guided attention and seasonal modulation |
| Yao et al.²⁷ | PV detection and segmentation | Photovoltaic Segment Anything Model (PVSAM) with geometric prompts and Segment Anything Model (SAM) | Multiple remote-sensing PV datasets | PV remote sensing | Geometric prompts; segmentation features | Cross-dataset evaluation | Improved PV segmentation using prompt-guided foundation models |
| Hafdaoui et al.²⁸ | PV power-plant detection | AI-based detection using deep features and classification | Sentinel-2 satellite imagery | PV installations | Spectral features; convolutional neural network (CNN) representations; classifier parameters | Reference-installation validation | Demonstrated AI-based PV detection from satellite imagery |
| Alkhatib et al.²⁹ | PV panel segmentation | Attention-integrated U-Net architectures | PV01 / UAV-based imagery | Rooftop PV installations | Attention mechanisms; segmentation features | Comparative segmentation evaluation | Improved extraction of PV structures using attention-enhanced deep learning |
| Present study | Rapid cross-regional PV localization | Physics-motivated Physics-Adaptive Reflectance Harmonization Index (PARHI) using visible reflectance, near-infrared (NIR) attenuation, short-wave infrared (SWIR) suppression, and adaptive spectral weighting | Sentinel-2 Level-2A multispectral imagery | Urban, rural, and arid environments | Visible, NIR, and SWIR reflectance relationships; adaptive weighting; decision threshold | Multi-region evaluation; separability analysis; ablation analysis; threshold-sensitivity analysis | Provides interpretable, training-independent spectral localization with reduced computational requirements |
Table 1: Comparison of existing methods and the present study. Representative physics-guided, machine-learning, deep-learning, and photovoltaic (PV) detection approaches are compared with the present Physics-Adaptive Reflectance Harmonization Index (PARHI) study according to research objective, methodology, dataset or data source, study area or application, principal parameters, validation approach, and key finding or contribution.
The current PV literature is largely focused on performance prediction, power forecasting, and material optimization using physics-directed or AI-based techniques. Physics-motivated spectral indices for spatial localization of PV installations across different environments have received comparatively little attention. Many conventional indices are characterized by empirical calibration, background interference, and region sensitivity. Many AI-based methods require large labeled datasets and substantial computational resources. Thus, a scalable and interpretable spectral index is needed for robust, large-scale PV identification across different sensor and environmental conditions.
Protocol
This article does not contain any studies involving human participants or animals performed by the authors.
The spectral properties of PV panels and nearby materials are crucial for accurate object detection using remote sensing. Differences in reflectance with wavelength, viewing angle, and environmental conditions affect the performance of spectral indices. Spatial PV distributions, laboratory experimental settings, and spectral responses of various materials in the visible, NIR, and SWIR regions provide the physical and experimental basis for the development of physics-motivated spectral indices for PV localization.
The unique spectral response of PV modules relative to common background surfaces motivated the PARHI formulation. PV modules consist of multilayer semiconductor and encapsulation structures designed to absorb incident solar radiation, resulting in reduced reflectance in selected NIR and SWIR regions. In contrast, surrounding materials such as concrete, bare soil, and conventional roofing surfaces generally exhibit different NIR–SWIR reflectance characteristics. PARHI uses these relative spectral differences rather than relying on a single absolute reflectance threshold. The NIR attenuation component represents the reduction in NIR reflectance associated with strong radiation absorption by PV materials, whereas the SWIR term provides complementary spectral suppression that improves discrimination from vegetation, soil, and artificial surfaces. The visible-band contribution provides additional contrast with highly reflective urban and non-PV surfaces. The adaptive weighting mechanism balances these physically motivated spectral responses according to their relative discriminatory contribution within each analyzed scene. Consequently, PARHI should be interpreted as a physics-motivated spectral index rather than a complete radiative-transfer or electromagnetic model of PV materials.
Algorithm 1: Physics-Motivated PARHI Computation with Adaptive Spectral Weighting
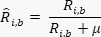
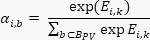
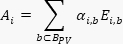
Algorithm 1 computes PARHI for PV localization using physically motivated adaptive spectral weighting. First, the spectral reflectance of each pixel is normalized to reduce multiplicative variations caused by illumination and acquisition conditions. A physics-guided spectral weight vector is then applied to emphasize wavelength regions identified from the laboratory spectral characterization as informative for PV discrimination, particularly the visible, NIR, and SWIR responses associated with PV attenuation and reflectance characteristics. The resulting weighted spectral representation is used to calculate an adaptive spectral response in which wavelengths with stronger PV-discriminative responses contribute more strongly to the final PARHI score. Unlike a conventional trainable multi-head Transformer, PARHI does not employ independently learned query, key, and value projection matrices. The adaptive weighting is calculated directly from the normalized spectral reflectance and the predefined physics-guided spectral weights. Therefore, no additional neural-network training stage is required for PARHI computation. The adaptive spectral response is subsequently combined using the same spectral components and mathematical formulation defined in the PARHI equations presented below, ensuring consistency between Algorithm 1 and the analytical PARHI index. For each pixel, the resulting PARHI score is compared with a decision threshold to distinguish PV from non-PV pixels. Threshold selection is performed using independent validation samples rather than the evaluation scenes. Candidate PARHI thresholds ranging from 0.30 to 0.70 are evaluated, and the threshold providing the highest class-separation performance on the validation samples is selected. The PARHI decision threshold was determined exclusively from the independent validation samples. Candidate thresholds ranging from 0.30 to 0.70 in increments of 0.01 were evaluated, and the threshold yielding the maximum Youden index, J = Sensitivity + Specificity − 1, was selected as the optimal operating point. The maximum Youden index was obtained at τ = 0.50; therefore, 0.50 was selected as the final PARHI threshold and subsequently fixed for all independent evaluation scenes. This procedure prevents threshold selection from being influenced by the test data and provides a reproducible criterion for converting the continuous PARHI response into a binary PV/non-PV classification. PARHI therefore uses a fixed validation-derived threshold of 0.50 throughout the study. Thresholds for the conventional comparison indices were determined separately according to their respective index responses and threshold-sensitivity analyses, as specified for each experiment. The same PARHI spectral formulation and fixed weighting scheme were applied to all evaluated regions without site-specific recalibration.
Algorithm 1
Input: Spectral reflectance matrix R ∈ ℝn × B, physics-guided spectral weight vector w ∈ ℝB, PV-sensitive wavelength set BPV, validation samples V, candidate threshold set T
Output: PARHI score vector S and PV localization vector Ŷ
- Normalize the spectral reflectance for each pixel:
- Calculate the physics-guided spectral representation:

- Extract the PV-sensitive spectral components:

- Calculate the adaptive spectral weighting:
- Calculate the adaptively weighted PV spectral response:
- Calculate the complementary background spectral response using the corresponding non-PV spectral components
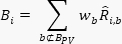
- Calculate the PARHI response using the same spectral components and weighting formulation defined in the subsequent PARHI equations:

- Define the candidate threshold set:

- For each τ∈T, classify the validation pixels:
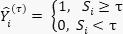
- Evaluate the predefined validation class-separation criterion for each candidate threshold.
- Select the threshold providing the maximum validation separation:

- Set the selected PARHI threshold:

- Apply the fixed threshold to all evaluation pixels:
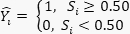
- Return S and Ŷ.
Spectral Reflectance Normalization
The spectral reflectance data used in Equation 1 are normalized to reduce variations induced by illumination and sensor characteristics.
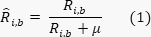
Here, Ri,b denotes the measured reflectance and μ is a small positive stabilization constant. In the implementation, μ = 10−6 was used consistently across all spectral bands and datasets. The normalized spectra were subsequently used to construct the physics-guided spectral components of PARHI. The weighting coefficients were determined from the characteristic spectral response of photovoltaic surfaces relative to representative background materials. Higher weights were assigned to spectral regions providing stronger PV-to-background discrimination, while less informative or highly variable regions received lower weights. The resulting weighted spectral components were combined according to the PARHI formulation to generate a continuous PV-response score Si for each pixel. Finally, the response score was converted into a binary PV localization map using a threshold selected from the validation samples. The same spectral formulation and weighting parameters were retained across the evaluated sites without site-specific recalibration.
Experimental Setup for Spectral Reflectance
Spectral reflectance measurements were conducted under controlled laboratory conditions using a laboratory spectroradiometer configured for measurements over the 300–2600 nm wavelength range with a spectral sampling interval of 1 nm. A 500 W halogen lamp was positioned approximately 70 cm from the sample and oriented at an incidence angle of 40°. Each sample was mounted on a platform inclined at approximately 47°. Reflected radiation was collected using an optical-fiber probe with a 5° field of view positioned approximately 15 cm above the sample surface and 30 cm above the reference level, consistent with the measurement geometry. Before sample acquisition, the instrument was stabilized and calibrated using white-reference and dark-reference measurements under the same illumination and measurement geometry. For each investigated material, five independent measurements were obtained from representative surface locations using the same experimental configuration. The final reflectance spectrum for each material was obtained by averaging the five measurements at each wavelength after reference and dark-current correction. The resulting reflectance profiles were subsequently used for spectral normalization, derivative analysis, adaptive spectral weighting, and PARHI computation.
Visible-Band Reflectance Component
Calculate the visible-band response by combining the visible bands according to Equation 2:

Here, RB2, RB3, and RB4 represent blue, green, and red reflectance, respectively. Their average emphasizes brightness differences that can be used to differentiate PV surfaces from water and asphalt.
NIR Attenuation Component
Equation 3 represents the decreased NIR reflectance behavior of PV panels:

Here, RB8 indicates near-infrared reflectance. PV materials exhibit greater NIR attenuation than vegetation and roofing materials.
SWIR Suppression Component
False-positive responses associated with highly reflective urban materials in the SWIR region are suppressed using Equation 4:

Here, RB11 represents short-wave infrared reflectance. Materials such as plastic and metal roofs can exhibit high SWIR reflectance, which is suppressed by this term.
Spectral Derivative Calculation
Equation 5 is used to improve spectral separation among materials:

Here, D(λ) denotes the first-order spectral derivative and Δλ represents the wavelength interval between adjacent spectral measurements. The derivative emphasizes rapid spectral transitions and absorption features that improve discrimination between PV surfaces and spectrally similar background materials. The first-order spectral derivative D(λ) is incorporated as a spectral-discrimination term in the PARHI formulation. It is calculated from the normalized reflectance spectrum to emphasize wavelength regions exhibiting rapid spectral transitions that distinguish photovoltaic surfaces from background materials. The derivative response is multiplied by the corresponding adaptive spectral weight wb and combined with the normalized reflectance components in the subsequent PARHI calculation. Thus, D(λ) does not constitute an independent classification index; instead, it provides an additional wavelength-dependent contribution to the final PARHI response by increasing the influence of spectrally discriminative regions and reducing the contribution of relatively non-discriminative regions.
Adaptive Spectral Weighting
Equation 6 assigns adaptive weights to the spectral bands based on their normalized reflectance contribution:
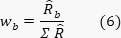
Here, wb is the normalized weight for band b. Bands showing consistent PV spectral behavior are assigned greater weight in the index calculation.
Visible–NIR Response
Equation 7 combines visible reflectance and NIR attenuation:

Here, H enhances the difference between the reflectance of PV panels and surrounding materials by taking into consideration the visible reflectance Rvis and the NIR attenuation characteristics as ANIR.
Dataset Acquisition, Preprocessing, and Ground-Truth Generation
The experimental dataset consisted of Sentinel-2 Level-2A multispectral surface-reflectance imagery acquired through the Copernicus Data Space Ecosystem26. Three representative study environments were considered: urban, rural, and arid regions, with scenes acquired on May 15, 2025, June 22, 2025, and July 10, 2025, respectively. The corresponding scene coordinates were 13.0827°N, 80.2707°E for the urban scene, 11.0168°N, 76.9558°E for the rural scene, and 23.0225°N, 72.5714°E for the arid scene. The Level-2A products provide atmospherically corrected surface reflectance at 10, 20, and 60 m spatial resolutions. The Sentinel-2 B2 (Blue), B3 (Green), B4 (Red), B8 (NIR), and B11 (SWIR) bands were extracted for PARHI computation. Because B2, B3, B4, and B8 have a native spatial resolution of 10 m and B11 has a native resolution of 20 m, all bands were harmonized to a 10 m spatial grid using bilinear resampling. High-resolution reference imagery from Google Earth Pro was used to identify and delineate PV installations corresponding to the Sentinel-2 scenes. Manual ground-truth polygons were generated for 48 PV installations, yielding approximately 18,640 PV pixels, while 96 non-PV polygons covering rooftops, concrete, bare soil, vegetation, water, and other reflective surfaces yielded approximately 37,280 non-PV pixels. The delineations were visually verified against the high-resolution reference imagery, and ambiguous, partially occluded, or mixed pixels were excluded from the final ground-truth set. To prevent spatial leakage, the samples were divided at the polygon level into 70% development, 15% validation, and 15% independent test subsets. The validation subset was used exclusively to select the PARHI decision threshold, whereas the independent test subset was reserved for final performance evaluation. No test samples were used during threshold optimization or parameter determination, thereby ensuring an independent assessment of PARHI generalization across the evaluated heterogeneous environments.
PARHI Calculation and Classification
The final spectral index for PV localization is calculated using Equation 8:

Here, H(x) denotes the visible-band reflectance response, N(x) represents the NIR attenuation response, SSWIR represents the SWIR suppression response, and D(x) denotes the spectral-derivative response. The coefficients wvis, wNIR, wSWIR, and wD are the corresponding adaptive spectral-component weights, obtained from the normalized discriminative responses of the validation data. They satisfy wvis + wNIR + wSWIR + wD = 1, wk ≥ 0. Thus, the normalization of the weights does not eliminate their influence; instead, each weight directly scales its associated spectral component in Equation 8. Higher weights are assigned to components exhibiting stronger and more stable separation between reference PV and non-PV samples, whereas less discriminative components receive lower weights. The same component definitions and weighting procedure are retained for all evaluated scenes without site-specific recalibration.
Equation 9 classifies each pixel as either PV or non-PV:

Here, τ is the empirically chosen decision threshold. Pixels C(x) with PARHI values greater than or equal to τ are classified as PV installations.
Adaptive Spectral Weighting
The adaptive spectral weighting mechanism was implemented using normalized spectral responses and was standardized across Algorithm 1, Equations 6 and 8, and the reported experiments. First, the band-level weights were calculated from the normalized spectral responses using Equation 6, representing the relative contribution of each spectral band. These band-level weights were subsequently aggregated into the corresponding visible, NIR, and SWIR component weights according to Equation 8. The weighting parameters were estimated exclusively from the independent validation samples and normalized before being incorporated into the final PARHI formulation. After validation, the resulting spectral weights were fixed and applied unchanged to all independent evaluation scenes. Thus, the weights were not recalculated within individual analysis scenes, and no site-specific fitting or parameter adjustment was performed during testing. This fixed, validation-derived weighting procedure ensures that the same spectral contribution scheme is applied across all evaluated environments, prevents information leakage from the test data, and maintains consistency between the mathematical formulation and Algorithm 1.
Comparative evaluation against equal and fixed empirical weighting demonstrated more consistent separation between PV and non-PV spectral responses across urban, rural, and arid environments. The adaptive formulation therefore provides a data-normalized mechanism for balancing complementary spectral characteristics while maintaining the computational simplicity and interpretability of the PARHI framework.
Performance Evaluation
The overall accuracy of PV localization is calculated using Equation 10:

Here, TP, TN, FP, and FN refer to true positives, true negatives, false positives, and false negatives, respectively. Greater accuracy indicates greater overall classification performance.
Threshold-Sensitivity Analysis
Threshold sensitivity was evaluated by varying the PARHI decision threshold from 0.30 to 0.70 in increments of 0.05 and calculating accuracy, precision, recall, F1-score, and Intersection over Union (IoU) at each operating point.
Resolution-Sensitivity Analysis
PARHI performance was evaluated under different spatial-resolution conditions using GaoFen-2 (GF-2), Sentinel-2, and Landsat 8 imagery to assess the robustness of the proposed index across sensors with different spatial and spectral characteristics. The GF-2 dataset consisted of GaoFen-2 PMS1 multispectral imagery, for which the multispectral bands used for analysis have a native spatial resolution of 4 m; the associated higher-resolution panchromatic channel was not used as a spectral input to PARHI. The Sentinel-2 dataset consisted of Level-2A surface-reflectance imagery, with the Blue, Green, Red, and NIR bands available at 10 m spatial resolution and the SWIR bands at 20 m spatial resolution. For Sentinel-2, the required SWIR band was resampled to the 10 m analysis grid using bilinear interpolation so that all PARHI input bands shared a common spatial grid. The Landsat dataset consisted of Landsat 8 OLI/TIRS Collection 2 Level-2 surface-reflectance imagery, with the multispectral bands evaluated at their native 30 m spatial resolution. No super-resolution enhancement or artificial sharpening was applied to any dataset. The cross-sensor resolution-sensitivity analysis was performed at the multispectral analysis resolution of each sensor (4 m for GF-2, 10 m for Sentinel-2, and 30 m for Landsat 8), rather than by resampling all sensors to a common spatial resolution. PARHI was independently calculated at each evaluated resolution using the same spectral formulation, fixed validation-derived weighting scheme, and fixed decision threshold. The resulting PV localization performance was compared using the same ground-truth definition and evaluation criteria, thereby allowing the effect of spatial resolution on PARHI performance to be assessed without introducing super-resolution enhancement or cross-sensor spatial interpolation artifacts.
Ablation Analysis
An ablation analysis was conducted to quantify the individual contributions of the principal PARHI components, namely the visible-reflectance response, NIR attenuation, SWIR suppression, and adaptive spectral weighting. Five configurations were evaluated: Full-PARHI, PARHI–VIS, PARHI–NIR, PARHI–SWIR, and PARHI–AW. All configurations were evaluated using the same independent test subset, ground-truth annotations, preprocessing procedure, and evaluation metrics. The PARHI decision threshold and validation-derived spectral weighting scheme were kept unchanged, except in the corresponding component-removal experiment. For PARHI–VIS, PARHI–NIR, and PARHI–SWIR, the corresponding spectral component was individually removed while the remaining components were retained. For PARHI–AW, the validation-derived adaptive spectral weighting was replaced with equal fixed weights. The resulting configurations were evaluated using accuracy, precision, recall, F1-score, and Intersection over Union (IoU) to quantify the effect of each component on PV-localization performance.
Results
Spatial Distribution of Photovoltaic Installations
Figure 1A–F depict PV installations and their geographical distribution at multiple scales. Figure 1C displays regional variation using a color gradient, while Figure 1A, B, D–F show high-resolution satellite views of selected PV installations and their array configurations across different landscapes. Green markers in Figure 1D and F indicate selected points within the installation sites.
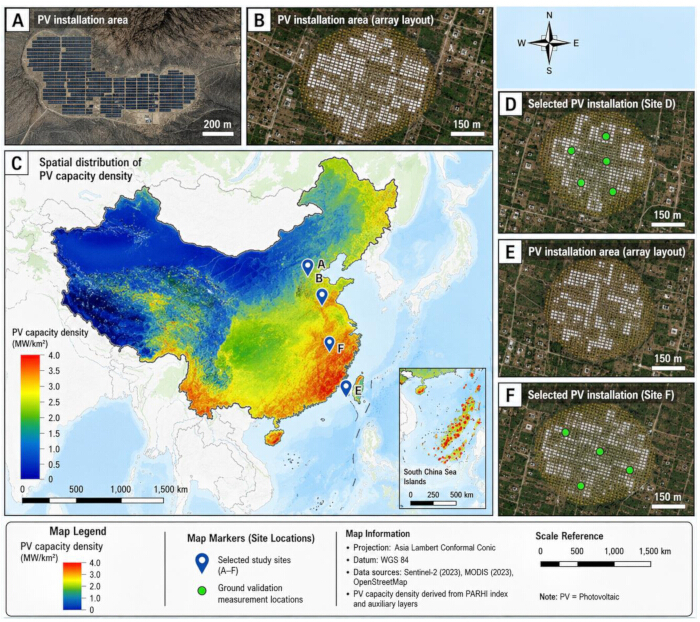
Figure 1. Spatial distribution and site-level visualization of photovoltaic installations. (A, B, D–F) High-resolution satellite views of selected photovoltaic (PV) installation areas showing the spatial arrangement of PV arrays. (C) Regional-scale map showing the spatial distribution of the mapped quantity and the locations of selected sites. Point markers indicate the mapped site locations according to the figure key. Please click here to view a larger version of this figure.
Modeled Spectral Reflectance Characteristics Across the Visible-to-SWIR Range
Figure 2A depicts canopy reflectance profiles from 300–2600 nm at viewing angles ranging from 0° to 60°. Reflectance peaked between 1000–1200 nm in the NIR region. The reported reflectance decreased from approximately 0.14 at 0° to approximately 0.05 at 60°. Beyond 1500 nm, reflectance declined and remained between approximately 0.03 and 0.06 for most viewing angles, followed by an increase around 2500–2600 nm. Overall, canopy reflectance decreased with increasing viewing angle. Figure 2B compares laboratory-measured and modeled spectral reflectance from 600–2500 nm. Reflectance ranged from approximately −0.04 to 0.60, with maxima of approximately 0.45–0.60 between 1000 and 1400 nm. Lower reflectance was observed around 1400 and 1900 nm. Changes in the model parameters produced variations in the modeled spectral profiles, which broadly overlapped with the laboratory-measured profile.
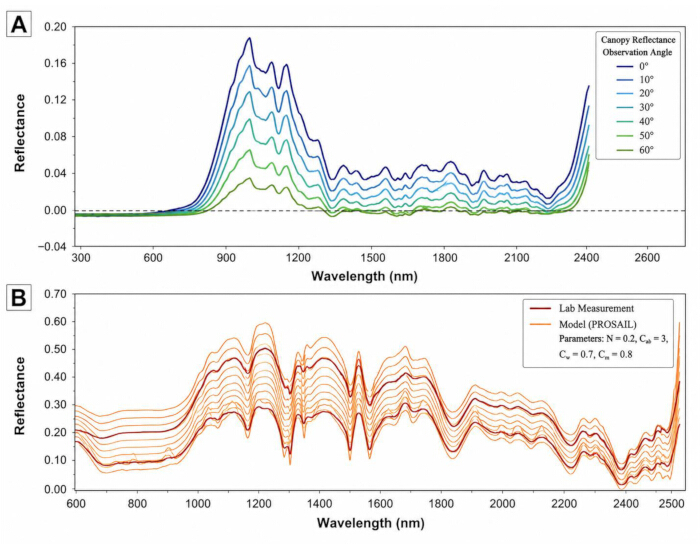
Figure 2. Canopy and laboratory/model-based spectral reflectance characteristics across the visible-to-short-wave infrared range. (A) Canopy reflectance profiles across approximately 300–2600 nm at observation angles from 0° to 60°. (B) Comparison of laboratory-measured and modeled spectral reflectance profiles across approximately 600–2500 nm for the model parameter values indicated in the figure. Please click here to view a larger version of this figure.
Experimental Setup for Spectral Reflectance
Laboratory spectral reflectance measurements were obtained using the experimental configuration shown in Figure 3. The configuration was used to acquire the spectral reflectance profiles evaluated in the subsequent analyses.
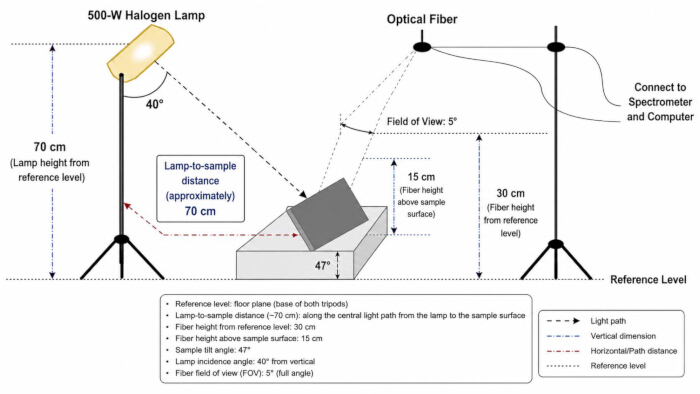
Figure 3. Experimental setup for spectral reflectance measurement. Schematic of the laboratory configuration used for spectral reflectance measurement. A 500 W halogen lamp was positioned approximately 70 cm above the reference level and oriented at 40° toward the sample. The sample was mounted at a tilt angle of 47°. Reflected light was collected using an optical fiber with a 5° field of view positioned 30 cm above the reference level and approximately 15 cm above the sample. The optical fiber was connected to a spectrometer and computer for data acquisition and analysis. Please click here to view a larger version of this figure.
Spectral Reflectance Comparison of Urban and Natural Materials
Figure 4A displays the spectral reflectance characteristics of the evaluated surface materials across 300–2600 nm. Water reflectance was generally below 0.1. Soil reflectance increased from approximately 0.1 at 400 nm to nearly 0.6 at 2400 nm, whereas PV panels exhibited reflectance values of approximately 0.3–0.5. Roofing and plastic materials showed higher reflectance between approximately 1000 and 1800 nm, with peak values approaching 0.9. Figure 4B displays scaled reflectance profiles across the visible range of 300–700 nm, with emphasis on B2 (445 nm) and B3 (550 nm). Scaled reflectance values ranged from approximately 0.5 to 1.6. Roofing and plastic materials exhibited higher reflectance around 550 nm, whereas water exhibited values of approximately 0.66–0.8. Asphalt and rubber surfaces showed comparatively limited variation across the visible range, with scaled reflectance values of approximately 1.0. Figure 4C displays scaled NIR–SWIR reflectance profiles from 800–2500 nm. The reported values varied among materials from approximately 0.2 to 2.8. Roofing and plastic surfaces exceeded 2.5 at approximately 1500–1700 nm, whereas water reflectance decreased below 0.5. PV panels exhibited intermediate values of approximately 1.0–1.5.
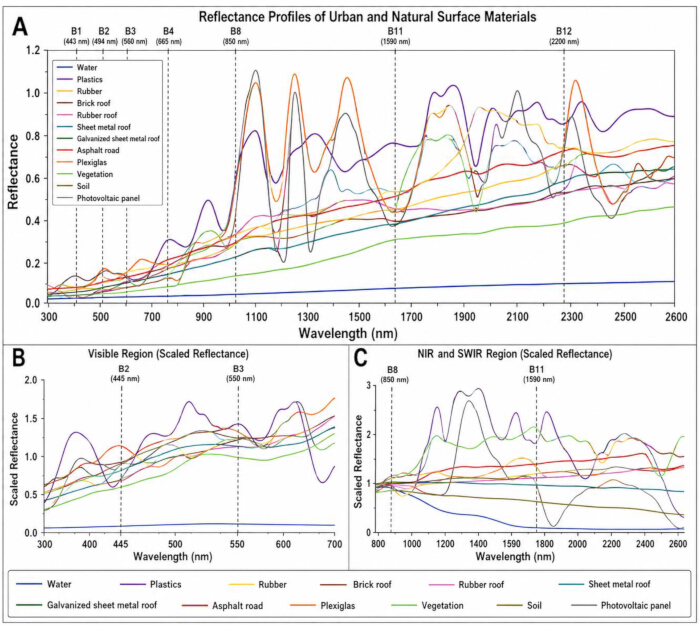
Figure 4. Spectral reflectance characteristics of urban and natural surface materials. (A) Reflectance profiles of water, plastics, rubber, roofing materials, asphalt road, Plexiglas, vegetation, soil, and photovoltaic (PV) panels across approximately 300–2600 nm, with selected spectral-band positions indicated by dashed vertical lines. (B) Scaled reflectance profiles across the visible spectral region, highlighting B2 (445 nm) and B3 (550 nm). (C) Scaled reflectance profiles across the near-infrared and short-wave infrared regions, with selected spectral-band positions indicated by dashed vertical lines. Please click here to view a larger version of this figure.
Spectral Signatures for Material Discrimination
Figure 5A displays the first-order derivative spectral profiles of the evaluated surface materials across 300–2600 nm. Derivative values ranged from approximately −0.003 to 0.012. PV panels exhibited distinct spectral transitions across the evaluated wavelength range. Figure 5B–E show the first-order derivative profiles of selected individual surface materials. Figure 5B shows the water profile, Figure 5C shows the photovoltaic panel profile, Figure 5D shows the vegetation profile, and Figure 5E shows the soil profile. The derivative profiles show material-dependent spectral transitions around the evaluated bands, including B1 (~443 nm), B3 (~560 nm), B8 (~842 nm), and B11 (~1610 nm).
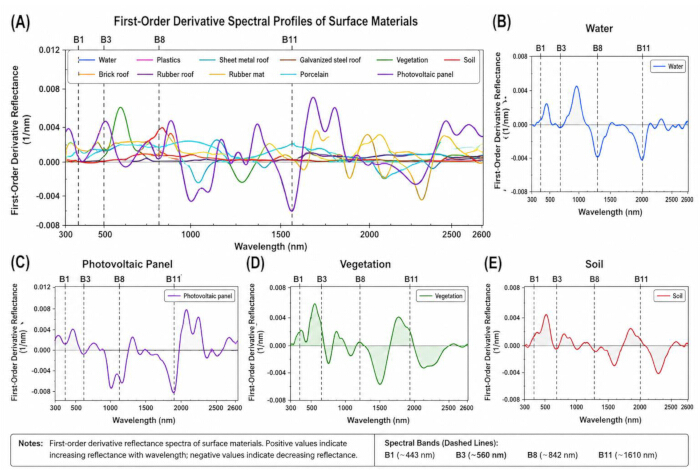
Figure 5. First-order derivative spectral signatures of surface materials. (A) First-order derivative reflectance profiles of photovoltaic (PV) panels and representative surface materials across approximately 300–2600 nm. (B) Water. (C) Photovoltaic panel. (D) Vegetation. (E) Soil. Dashed vertical lines indicate B1 (~443 nm), B3 (~560 nm), B8 (~842 nm), and B11 (~1610 nm). Positive derivative values indicate increasing reflectance with wavelength, whereas negative values indicate decreasing reflectance. Please click here to view a larger version of this figure.
Spectral Reflectance Profiles Across Key Wavelengths
Figure 6 displays the spectral reflectance characteristics of the evaluated materials across 400–2200 nm. Water exhibited low reflectance, decreasing from approximately 0.04 at 500 nm to approximately 0.01 at 2200 nm. Among the materials described, soil exhibited the highest reported values, increasing from approximately 0.30 at 700 nm to approximately 0.52 at 1600 nm. Concrete exhibited reflectance values of approximately 0.28–0.38, whereas PV panels exhibited values of approximately 0.10–0.18 across the measured spectral range. These profiles show spectral differences between PV panels and the evaluated background materials.
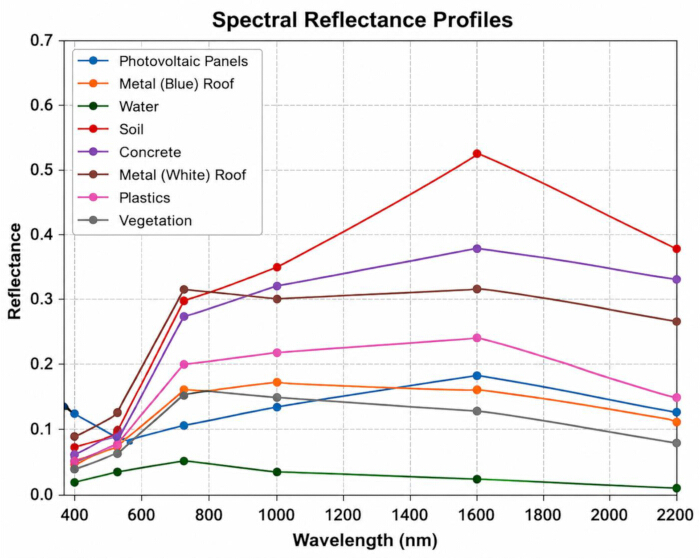
Figure 6. Spectral reflectance profiles of photovoltaic panels and representative surface materials. Reflectance profiles of photovoltaic (PV) panels, metal (blue) roof, water, soil, concrete, metal (white) roof, plastics, and vegetation across wavelengths from 400 to 2200 nm. Please click here to view a larger version of this figure.
Separability Analysis
The M-Index and Transformed Divergence (TD) metrics provide the class-separability results for the evaluated spectral indices in Figure 7A–D. SPPI, SPI, and NDPI were evaluated for their ability to separate PV installations from representative land-cover classes, including water, vegetation, soil, concrete, plastics, blue-dome buildings, and shadow. Figure 7A and B present the M-Index and TD results for Dataset 1 (urban sites), respectively, whereas Figure 7C and D present the corresponding results for Dataset 2 (rural/peri-urban sites). Higher values indicate greater separability between PV installations and the corresponding land-cover class.
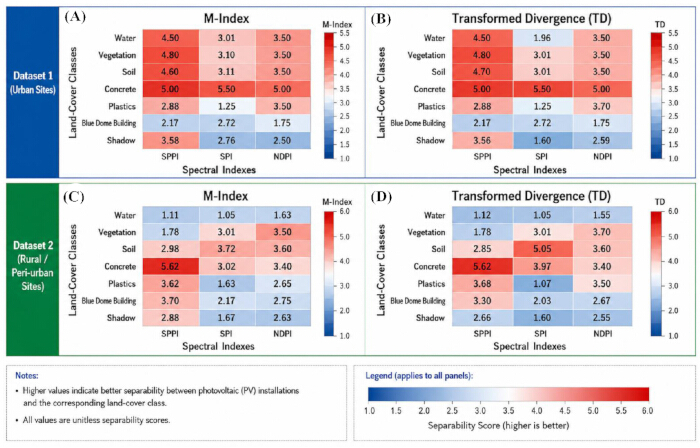
Figure 7. Class-separability analysis of photovoltaic spectral indices. Heatmaps show the separability of photovoltaic (PV) installations from representative land-cover classes using the M-Index and Transformed Divergence (TD) for the Solar Photovoltaic Performance Index (SPPI), Solar Panel Index (SPI), and Normalized Difference Photovoltaic Index (NDPI). (A) M-Index for Dataset 1 (urban sites). (B) TD for Dataset 1 (urban sites). (C) M-Index for Dataset 2 (rural/peri-urban sites). (D) TD for Dataset 2 (rural/peri-urban sites). Cell values indicate class-separability scores; higher values indicate greater separability. Please click here to view a larger version of this figure.
Comparative Performance Evaluation of PARHI
Figure 8A–C compares PV-detection performance between PARHI and the conventional spectral indices evaluated in the study. Figure 8A presents the comparative detection-accuracy results, with reported detection accuracies of approximately 5%, 76%, and 92% across the evaluated comparison methods. Figure 8B and C present the corresponding spatial detection maps and histogram analyses, illustrating differences in the extent and continuity of detected PV regions among the evaluated methods. The conventional spectral indices were evaluated using index- and scene-specific thresholds selected based on threshold-sensitivity analysis, as indicated in the corresponding panels. In Figure 8B, the displayed thresholds are 0.80 for SPPI, 0.25 for SPI, and 0.25 for NDPI. In Figure 8C, the displayed thresholds are 0.25 for SPPI, 0.25 for SPI, 0.50 for NDPI, and 0.50 for PARHI. The resulting maps illustrate differences in the extent and spatial continuity of detected PV regions among the evaluated indices and scenes.
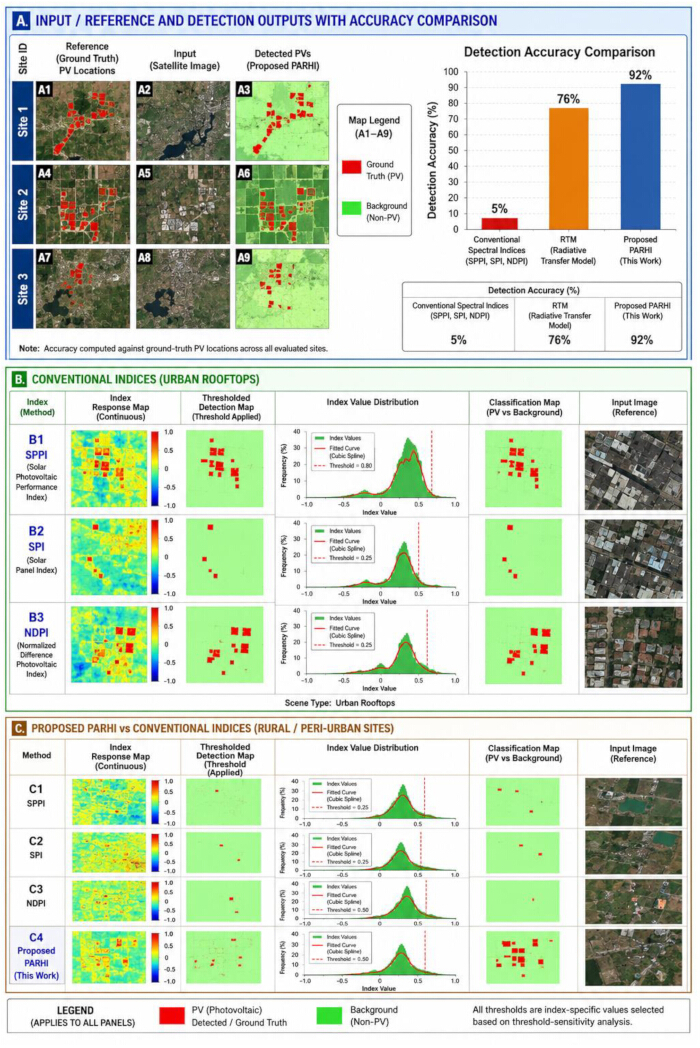
Figure 8. Comparative performance of photovoltaic detection using conventional spectral indices and PARHI. (A) Reference photovoltaic (PV) locations, satellite imagery, detection outputs obtained using the proposed Physics-Adaptive Reflectance Harmonization Index (PARHI), and detection-accuracy comparison across conventional spectral indices, radiative transfer model (RTM), and PARHI. (B) Representative urban-rooftop results for the Solar Photovoltaic Performance Index (SPPI), Solar Panel Index (SPI), and Normalized Difference Photovoltaic Index (NDPI), showing index-response maps, thresholded detection maps, index-value distributions, classification maps, and reference imagery. (C) Corresponding rural/peri-urban results for SPPI, SPI, NDPI, and PARHI. Red indicates PV and green indicates non-PV background. Threshold values are shown within the corresponding panels. Please click here to view a larger version of this figure.
Localized PV Extraction Comparison Across Methods
Figure 9 compares localized PV extraction across the evaluated sites using physics-guided machine learning (PGML), UAV-based hyperspectral analysis (UAV-HSI), radiative transfer model (RTM)-based analysis, DeepLabV3+, and the proposed PARHI method. Detected PV pixels from each approach were compared with the manually defined ground-truth PV masks within the same evaluation areas. Precision, recall, F1-score, and IoU were computed using TP, FP, and FN pixels for each approach. The detection outputs show differences in the spatial continuity of PV extraction and background classification among the evaluated approaches. PARHI achieved a precision of 97.51%, recall of 98.06%, F1-score of 97.78%, and IoU of 95.68%. Red regions represent detected PV pixels, and green regions represent background pixels.
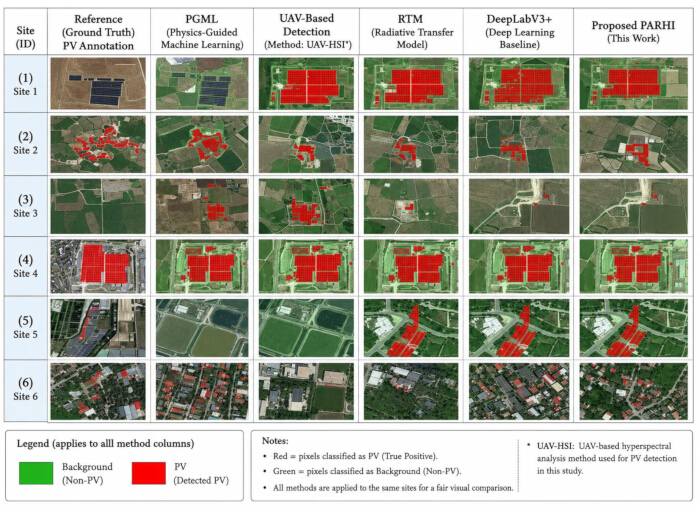
Figure 9. Comparison of localized photovoltaic extraction across detection methods. Reference photovoltaic (PV) annotations and corresponding detection outputs are shown for six evaluation sites using physics-guided machine learning (PGML), UAV-based hyperspectral analysis (UAV-HSI), radiative transfer model (RTM), DeepLabV3+, and the proposed Physics-Adaptive Reflectance Harmonization Index (PARHI). Red indicates pixels classified as PV, and green indicates non-PV background. Please click here to view a larger version of this figure.
Qualitative Comparison on Urban Rooftops
Figure 10A and B show PV detection results for representative urban rooftop scenes. Relative to the ground-truth PV masks, green, red, and blue regions represent TP, FP, and FN detections, respectively. In both Figure 10A and B, PGML and RTM produced more false-positive detections around rooftop edges and adjacent non-PV surfaces, whereas PARHI showed more spatially continuous TP regions and fewer FP and FN regions. Precision, recall, F1-score, and IoU were used to quantify pixel-level performance relative to the ground-truth masks. PARHI achieved a precision of 97.51%, recall of 98.06%, F1-score of 97.78%, and IoU of 95.68%, whereas PGML achieved 88.42%, 82.76%, 85.49%, and 74.68%, respectively.
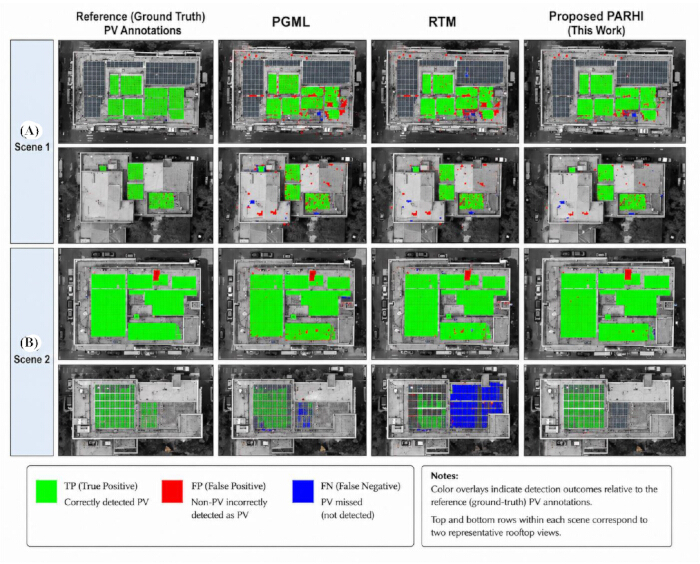
Figure 10. Qualitative comparison of photovoltaic detection on urban rooftops. Reference photovoltaic (PV) annotations and corresponding detection results are shown for physics-guided machine learning (PGML), radiative transfer model (RTM), and the proposed Physics-Adaptive Reflectance Harmonization Index (PARHI) for (A) Scene 1 and (B) Scene 2. Green indicates true-positive detections, red indicates false-positive detections, and blue indicates false-negative detections relative to the reference PV annotations. The two image rows within each scene represent two rooftop views. Please click here to view a larger version of this figure.
Spectral Performance Comparison
Figure 11A–C shows spectral reflectance profiles of PV and urban-background surfaces across 500–2200 nm for PARHI, PGML, and UAV-based analysis, respectively. The PARHI profiles in Figure 11A show consistent spectral separation between PV and urban-background responses across the evaluated wavelengths. At each wavelength, the absolute difference between the mean PV reflectance and the mean urban-background reflectance was calculated. The wavelength-wise absolute mean-reflectance difference ranged from approximately 0.08 to 0.12 across the evaluated wavelengths, representing spectral separation rather than a global mean difference. Figure 11B shows greater overlap between the PGML PV and background responses across portions of the evaluated spectral range. Figure 11C shows higher reflectance responses for the UAV-based profiles at longer wavelengths, with PV reflectance approaching approximately 0.75 near 1700 nm and background reflectance approaching approximately 0.50.
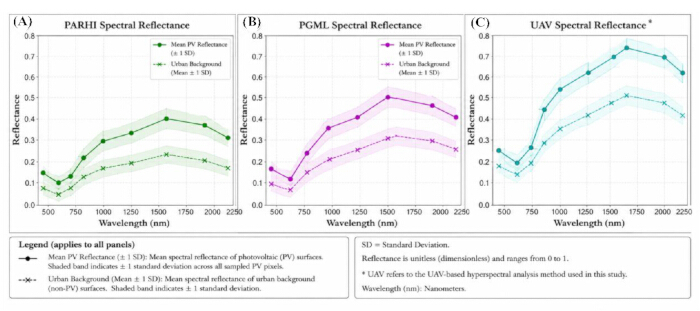
Figure 11. Spectral reflectance comparison of photovoltaic detection methods. Mean spectral reflectance profiles of photovoltaic (PV) and urban-background surfaces are shown across the evaluated wavelengths for (A) the Physics-Adaptive Reflectance Harmonization Index (PARHI), (B) physics-guided machine learning (PGML), and (C) UAV-based hyperspectral analysis. Solid lines with circular markers represent mean PV reflectance, and dashed lines with cross markers represent mean urban-background reflectance. Shaded regions represent ±1 standard deviation (SD). Reflectance is dimensionless. Please click here to view a larger version of this figure.
Cross-Sensor Visual Assessment
Figure 12A–D presents a cross-sensor visual assessment of PV detection using Sentinel-2 Level-2A and Landsat 8 optical surface-reflectance imagery. PARHI, SPPI, and NDVI were computed exclusively from the corresponding optical spectral bands and were not applied to radar imagery. The evaluated optical imagery comprised Sentinel-2 MSI Level-2A imagery at 10 m and Landsat 8 OLI/TIRS surface-reflectance imagery at 30 m. The same spectral preprocessing, spatial harmonization, and classification procedures were applied across the evaluated sensors. PARHI was evaluated using a fixed threshold of 0.50, while SPPI and NDVI were evaluated using thresholds of 0.30 and 0.30, respectively. The PARHI formulation and its threshold were kept fixed across the evaluated sensor conditions without site-specific recalibration. Figure 12 illustrates differences in the spatial distribution and continuity of PV detections resulting from the different sensor resolutions and spectral-index formulations. PARHI produced spatially concentrated PV detections in the Sentinel-2 imagery, whereas the comparison-index outputs exhibited comparatively more dispersed or fragmented detections in some areas. These visual differences are presented as a qualitative cross-sensor assessment and are not interpreted as independent evidence of classification accuracy.
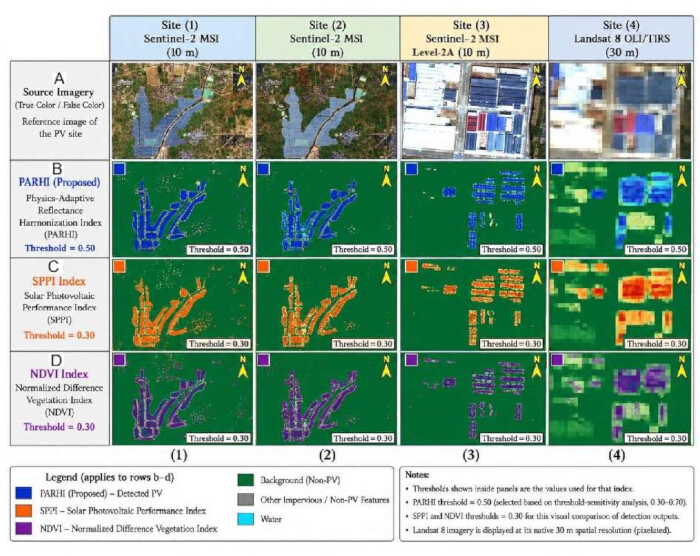
Figure 12. Cross-sensor visual assessment of photovoltaic detection indices. Representative photovoltaic (PV) sites and corresponding index outputs are shown using Sentinel-2 MSI Level-2A (10 m) and Landsat 8 OLI/TIRS surface-reflectance imagery (30 m). All evaluated indices were calculated from optical spectral bands; Sentinel-1 SAR data were not used for PARHI, SPPI, or NDVI computation. (A) Source/reference imagery. (B) Physics-Adaptive Reflectance Harmonization Index (PARHI) outputs using a fixed threshold of 0.50. (C) Solar Photovoltaic Performance Index (SPPI) outputs using a fixed threshold of 0.30. (D) Normalized Difference Vegetation Index (NDVI) outputs using a fixed threshold of 0.30. Blue, orange, and purple denote detections from PARHI, SPPI, and NDVI, respectively; green denotes non-PV background, gray denotes other impervious/non-PV features, and cyan denotes water. Please click here to view a larger version of this figure.
Threshold-Sensitivity Analysis
The PARHI decision threshold was varied from 0.30 to 0.70 in increments of 0.05 to assess threshold sensitivity. At each operating point, accuracy, precision, recall, F1-score, and IoU were calculated. The selected threshold of 0.50 yielded an accuracy of 96.42%, precision of 95.87%, recall of 94.96%, F1-score of 95.41%, and IoU of 91.23%. Across the evaluated threshold range, the F1-score ranged from 91.68% to 95.41%, whereas the IoU ranged from 84.78% to 91.23%, indicating gradual variation in performance across the tested operating points.
Resolution Sensitivity Analysis
Figure 13A–L compares PARHI-based PV detection across GF-2, Sentinel-2, and Landsat 8 imagery at spatial resolutions of 4 m, 10 m, and 30 m, respectively. Figure 13A–C presents the corresponding native-resolution reference imagery, Figure 13D–F presents the PARHI response maps, Figure 13G–I presents the PARHI-based PV detection results for Site 1, and Figure 13J–L presents the corresponding detection results for Site 2. Across the sensor columns, the GF-2 results at 4 m exhibit comparatively well-defined spatial boundaries, the Sentinel-2 results at 10 m show greater spatial smoothing, and the Landsat 8 results at 30 m exhibit a visibly coarser pixel structure and greater spatial generalization of detected PV regions. Larger PV installations remain identifiable in the displayed Landsat 8 examples, although finer spatial details are less distinctly represented at the coarser resolution.
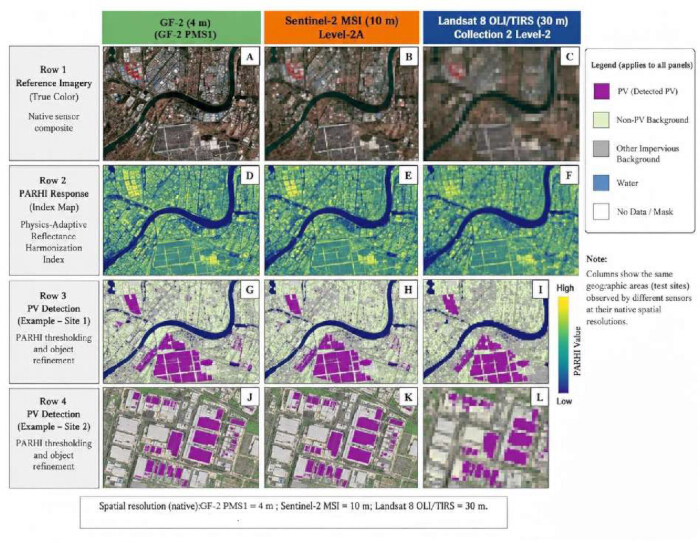
Figure 13. Resolution sensitivity of photovoltaic detection using PARHI across different sensors. Representative results obtained using the Physics-Adaptive Reflectance Harmonization Index (PARHI) are compared across GF-2 PMS1 multispectral imagery (4 m), Sentinel-2 MSI Level-2A imagery (10 m), and Landsat 8 OLI/TIRS Collection 2 Level-2 surface-reflectance imagery (30 m). (A–C) Native-resolution reference imagery. (D–F) PARHI response maps. (G–I) PARHI-based PV detection results for Site 1. (J–L) PARHI-based PV detection results for Site 2. Purple indicates detected PV; light green indicates non-PV background; gray indicates other impervious background; blue indicates water; and white indicates no-data or masked areas. Please click here to view a larger version of this figure.
Performance Evaluation
PARHI performance was evaluated using accuracy, precision, recall, F1-score, and IoU across the evaluated regions. PARHI achieved an overall accuracy of 96.42%, precision of 95.87%, recall of 94.96%, F1-score of 95.41%, and IoU of 91.23%. The conventional spectral indices showed lower F1-scores and IoU values in the reported comparisons, including in the urban rooftop and arid environments. Together, the reported metrics characterize both classification performance and spatial overlap under the evaluated conditions.
Ablation Analysis
An ablation analysis was performed to evaluate the contribution of the individual PARHI components. Five configurations were evaluated: the complete PARHI formulation and configurations independently excluding the visible-reflectance, NIR-attenuation, SWIR-suppression, or adaptive-weighting component.
The complete PARHI formulation achieved an accuracy of 96.42%, precision of 95.87%, recall of 94.96%, F1-score of 95.41%, and IoU of 91.23%. Removing the visible-reflectance component reduced the F1-score to 92.86% and IoU to 86.68%. Excluding NIR attenuation resulted in an F1-score of 91.74% and IoU of 85.14%. Removal of SWIR suppression resulted in an F1-score of 93.12% and IoU of 87.15%, whereas exclusion of adaptive weighting resulted in an F1-score of 92.38% and IoU of 86.18%. The complete formulation therefore produced the highest reported F1-score and IoU among the five evaluated configurations.
Across the reported evaluations, PARHI showed separation between PV and non-PV spectral responses and localized PV regions across the evaluated environments and sensor datasets. The complete PARHI formulation achieved an overall accuracy of 96.42%, precision of 95.87%, recall of 94.96%, F1-score of 95.41%, and IoU of 91.23%, while the threshold-sensitivity and ablation analyses showed the corresponding performance variation with threshold selection and removal of individual spectral components. The cross-sensor and resolution comparisons further showed PV localization across the evaluated GF-2, Sentinel, and Landsat imagery. Collectively, these observations support the study hypothesis that a physics-motivated spectral formulation combining complementary visible, NIR, and SWIR responses with adaptive weighting can support PV localization under the evaluated conditions.
Data Availability:
The satellite imagery analyzed in this study is publicly available through the Copernicus Data Space Ecosystem26. The Sentinel-2 Level-2A surface-reflectance products used in the analysis can be accessed using the corresponding acquisition dates and geographic locations reported in the study. The numerical source data supporting the reported results, including the figure data, performance metrics, threshold-sensitivity analysis, ablation analysis, spectral separability analysis, and cross-sensor evaluation, are publicly available in Zenodo at https://doi.org/10.5281/zenodo.21971570.
Discussion
This study presented PARHI as a physics-motivated spectral index for rapid PV localization across varied environmental and sensing conditions. The proposed method combines physically motivated reflectance relationships with adaptive spectral weighting to represent the optical characteristics of PV materials. Its performance was evaluated through separability analysis, comparative performance evaluation, localized extraction, urban rooftop assessment, cross-sensor evaluation, resolution-sensitivity analysis, threshold-sensitivity analysis, and ablation analysis. The complete formulation achieved an overall accuracy of 96.42%, precision of 95.87%, recall of 94.96%, F1-score of 95.41%, and IoU of 91.23%. The comparative analyses also showed differences in separability and localization performance between PARHI and the conventional spectral indices evaluated in this study. These findings support the use of physically motivated spectral relationships for PV localization and extend previous research applying physics-guided approaches to solar-energy and remote-sensing problems19,20,21,22.
PARHI provides a computationally lightweight alternative to learning-based PV-localization approaches by operating on physically motivated spectral relationships without requiring iterative model training or large labeled datasets. Recent PV-detection studies have applied prompt-guided foundation models, AI-based satellite-image classification, and attention-integrated U-Net architectures27,28,29, while physics-guided and hybrid learning approaches have also demonstrated the value of incorporating physical knowledge into data-driven models13,23,24,25. In the present evaluation, PARHI achieved an F1-score of 95.41% and an IoU of 91.23%. Its principal advantage is the transparent spectral formulation, in which the visible, NIR, SWIR, and adaptive-weighting components are intended to correspond to interpretable spectral characteristics. In contrast, deep neural networks derive discriminative representations through learned parameters and can provide detailed representations in complex scenes but require training data and computational resources. PARHI therefore provides an efficiency–interpretability trade-off for rapid large-area screening, whereas learning-based segmentation approaches remain an alternative for applications requiring detailed object-level delineation27,28,29.
The robustness of PARHI was evaluated across summer, winter, and post-monsoon acquisition conditions, as well as under low-, moderate-, and high-solar-irradiance conditions. The seasonal evaluation produced mean F1-scores of 94.18%, 95.03%, and 94.67%, with corresponding IoU values of 89.42%, 90.61%, and 89.97%, respectively. Under low-, moderate-, and high-illumination conditions, the corresponding mean F1-scores were 92.76%, 95.41%, and 94.83%, respectively. Cross-sensor evaluation yielded F1-scores of 95.41% for Sentinel-2 and 92.87% for Landsat 8. Across the evaluated acquisition conditions, the results showed relatively limited variation, with seasonal F1-score variation of less than 1 percentage point and a maximum difference of 2.65 percentage points across illumination conditions. The sensor comparison similarly showed that PARHI retained high detection performance when applied to the coarser-resolution Landsat 8 imagery.
The proposed method nevertheless has several limitations. PARHI relies on the availability and quality of optical multispectral imagery and may exhibit reduced performance in areas affected by persistent cloud cover, heavy shadow, or insufficient spatial resolution. PV installations with spectral characteristics similar to certain roofing materials or highly reflective surfaces may also produce false detections. In addition, PARHI is designed for optical remote-sensing data and does not directly incorporate complementary thermal or radar observations. The resolution-sensitivity assessment further indicates that the spatial representation of PV regions becomes coarser in lower-resolution imagery, which may constrain detailed delineation of smaller installations. These constraints delimit the conditions under which the present findings can be interpreted and indicate the need for broader validation before generalizing performance across all PV configurations, climates, and sensing conditions.
Alternative approaches to the same PV-localization problem include conventional spectral indices, AI-based satellite-image classification, deep-learning segmentation, prompt-guided foundation models, and physics-guided or hybrid learning frameworks13,23,27,28,29. Complementary thermal or radar observations could also be investigated where optical spectral information alone is insufficient, although these modalities were not evaluated in the present study. PARHI is particularly relevant to applications requiring interpretable and computationally efficient screening of PV installations over large areas. Potential applications include remote-sensing-based PV mapping, solar-infrastructure monitoring, energy planning, and identification of spatial PV distributions for subsequent analysis. These applications complement the broader use of AI and physics-guided methods for PV-system analysis, forecasting, monitoring, and characterization13,19,22,25. The present results therefore position PARHI as a spectral-localization approach that complements, rather than replaces, more computationally intensive learning-based methods.
Future work will focus on integrating PARHI with ML and DL frameworks to evaluate whether its physically motivated spectral components can support improved detection in highly heterogeneous urban environments. Real-time PV monitoring, adaptation to hyperspectral sensors, and temporal analysis of changes in solar infrastructure represent additional research directions. Broader evaluation across climatic regions, seasons, illumination conditions, sensor platforms, and spatial resolutions will be important for determining the generalizability of the method beyond the conditions evaluated here. Future research may also investigate the integration of complementary sensing modalities and systematically compare PARHI with emerging PV-segmentation approaches^27–29. Such evaluations would help establish the operational limits of the spectral formulation and determine where physics-motivated indices, learning-based approaches, or combinations of these approaches are most appropriate for large-scale PV localization.
Disclosures
Conflict of Interest:
The authors declare that they have no conflicts of interest.
Author Contributions:
Arun M: Conception and design of the study; development of the research methodology.
Abdullah Mohan: Acquisition, organization, and preprocessing of the multispectral remote-sensing datasets.
A. P. Senthil Kumar: Data analysis, implementation of the PARHI index, and interpretation of the experimental results.
Girish H: Drafting of the manuscript and preparation of tables and figures.
S. Rinesh: Critical revision of the manuscript for important intellectual content and technical interpretation of the findings.
C. Prajitha: Supervision of the study and final approval of the version to be submitted.
Acknowledgements
The authors have no acknowledgments. This research received no specific grant from any funding agency in the public, commercial, or not-for-profit sectors.
Materials
| Name | Company | Catalog Number | Comments |
|---|---|---|---|
| Atmospheric correction software | European Space Agency (ESA) | Sen2Cor 2.11 | Used for atmospheric correction of Sentinel-2 Level-1C imagery when Level-2A products were not directly available. |
| Computer/workstation | Dell Technologies | Precision 5820 Tower | Intel Xeon processor, 32 GB RAM, NVIDIA GPU; used for satellite-image processing, PARHI computation, and statistical analysis. |
| Geographic information system (GIS) software | QGIS Development Team | QGIS 3.34 | Used for image visualization, spatial processing, mapping, and manual ground-truth delineation. |
| GF-2 satellite imagery | China Centre for Resources Satellite Data and Application (CRESDA) | GF-2 PMS1 | Multispectral imagery with a 4 m spatial resolution; used for spatial-resolution sensitivity analysis. |
| Halogen lamp | Ocean Insight | HL-2000-HP | 500 W halogen illumination source used for laboratory spectral-reflectance measurements. |
| High-resolution reference imagery | Google Earth Pro | Google Earth Pro 7.3 | High-resolution optical reference imagery used to identify candidate PV installations and manually delineate PV ground-truth polygons. |
| Landsat satellite imagery | U.S. Geological Survey (USGS) | Landsat 8 OLI/TIRS Collection 2 Level-2 | Surface-reflectance multispectral imagery with a 30 m analysis resolution; used for cross-sensor and spatial-resolution analyses. |
| Optical fiber | Ocean Insight | QP400-2-VIS-NIR | Optical-fiber probe with a 5° field of view used to collect reflected radiation during laboratory spectral-reflectance measurements. |
| Programming environment | Python Software Foundation | Python 3.10 | Used for PARHI implementation, numerical analysis, statistical evaluation, and visualization. |
| Python libraries | NumPy; Rasterio; GDAL; OpenCV; Matplotlib | NumPy 1.26; Rasterio 1.3; GDAL 3.6; OpenCV 4.8; Matplotlib 3.8 | Used for numerical computation, raster processing, spectral analysis, image processing, and visualization. |
| Sentinel-2 Level-2A multispectral surface-reflectance imagery | Copernicus Data Space Ecosystem | Sentinel-2 MSI Level-2A | Primary multispectral imagery for PARHI evaluation. Blue, Green, Red, and NIR bands were analyzed at 10 m spatial resolution; the required 20 m SWIR band was resampled to the 10 m analysis grid using bilinear interpolation. |
| Spectroradiometer | Not specified | Not specified | Laboratory spectroradiometer configured for spectral-reflectance measurements over 300–2600 nm with a spectral sampling interval of 1 nm. |
References
- Wang H, et al. Inverse lithography technology based on a physics-guided reinforcement learning framework. Optics Express. 2025;33(17):37229-45.
- Wu Y, Sicard B, Gadsden SA. A review of physics-informed machine learning methods with applications to condition monitoring and anomaly detection. arXiv. 2024;arXiv:2401.11860.
- Atojunere EE, Senadeera W, Iji P, Jamaima L. Development of an indirect active solar heating dryer (IASHD) for dwarf cavendish banana. Indian Journal of Engineering. 2026;23(59):1-10.
- Ahmed M, Khan MR. Artificial intelligence-enabled digital twins for energy efficiency in smart grids. Review of Applied Science and Technology. 2025;4(2):580-615.
- Lafta AM, Al-Absi SM, Al-Adhadh AR. Development of an empirical correction model for improving single-degree-of-freedom predictions of beam response under impact loading. Indian Journal of Engineering. 2026;23(59):e8ije1716.
- Venkatesh R. Effect of hybrid nanofluid and polyethylene glycol/aluminium foam on thermal characteristics and energy storage performance of solar air heater. Applied Thermal Engineering. 2026;291:130213.
- Rinesh, S., Arun, M., Kumar, S. N., Prajitha, C., & Kumar, A. S. (2025). Evaluating the type 2 fuzzy logic controller with multilayer perceptrons for optimal tracking of solar photovoltaic systems. International journal of low-carbon technologies, 20, 394-403.
- Venkatesh R. Effects of ramie fiber/boron nitride exposure on the mechanical characteristics of injection-moulded polypropylene composites for automated structural applications. International Journal of Automotive Science and Technology. 2024;8(4):451-6.
- Zhang S, et al. Experimental methods, health indicators, and diagnostic strategies for retired lithium-ion batteries: A comprehensive review. arXiv. 2025;arXiv:2512.01294.
- Chen X, Wu W, Yang K, Chen G. PMLF: A physics-guided multiscale loss framework for structurally heterogeneous time series [conference paper]. Presented at: Thirty-ninth Annual Conference on Neural Information Processing Systems (NeurIPS 2025); 2025. https://doi.org/10.52202/085713-1960.
- Venkatesh R. Significance of TiO2 on the mechanical behavior of high-density polyethylene nanocomposite made with pineapple fiber. Journal of The Institution of Engineers (India): Series D. 2024;105(1):1-5.
- Ahmadi N, et al. Physics-informed machine learning in biomedical science and engineering. arXiv. 2025;arXiv:2510.05433.
- Kurukuru VSB, et al. A review on artificial intelligence applications for grid-connected solar photovoltaic systems. Energies. 2021;14(15):4690.
- Fofanah AJ, Wen L, Chen D. PIMCST: Physics-informed multi-phase consensus and spatio-temporal few-shot learning for traffic flow forecasting. arXiv. 2026;arXiv:2602.01936.
- Yang D, Kleissl J. Solar Irradiance and Photovoltaic Power Forecasting. CRC Press; Boca Raton (FL); 2024.
- Arun, M. (2026). Computational fluid dynamics and experimental investigation of dimple tube solar trough heater using silver nanofluids. International Journal of Low-Carbon Technologies, 21, ctag097.
- Zideh MJ, Chatterjee P, Srivastava AK. Physics-informed machine learning for data anomaly detection, classification, localization, and mitigation: A review, challenges, and path forward. IEEE Access. 2024;12:4597-617.
- Huang B, Wang J. Applications of physics-informed neural networks in power systems—a review. IEEE Transactions on Power Systems. 2022;38(1):572-88.
- Jahangir JB, Alam MA. Physics-guided machine learning predicts the planet-scale performance of solar farms with sparse, heterogeneous, public data. Applied Energy. 2025;396:126192.
- Zhong X, et al. A physics-guided automated machine learning approach for obtaining surface radiometric temperatures on sunny days based on UAV-derived images. Computers, Environment and Urban Systems. 2024;113:102175.
- Wang Z, et al. A physics-guided neural network model to estimate all-sky diffuse solar radiation using Himawari-8 data. IEEE Transactions on Geoscience and Remote Sensing. 2025;63:1-18.
- Ren Z, et al. Physics-guided characterization and optimization of solar cells using surrogate machine learning model [conference paper]. Presented at: 2019 IEEE 46th Photovoltaic Specialists Conference (PVSC); 2019. p. 3054-8. https://doi.org/10.1109/PVSC40753.2019.8980715.
- Rai R, Sahu CK. Driven by data or derived through physics? A review of hybrid physics guided machine learning techniques with cyber-physical system (CPS) focus. IEEE Access. 2020;8:71050-73.
- Mehtaj N, Banerjee S. Scientific machine learning for elastic and acoustic wave propagation: Neural operator and physics-guided neural network. Sensors. 2025;25(12):3588.
- Arun, M., Barik, D., Sridhar, K. P., & Dennison, M. S. (2022). Thermal performance of a dimpled tube parabolic trough solar collector (PTSC) with SiO2 nanofluid. International Journal of Photoenergy, 2022(1), 8595591.
- Copernicus Data Space Ecosystem. Copernicus Data Space Ecosystem [Internet]. Available from: https://dataspace.copernicus.eu/ Accessed August 17, 2026.
- Yao X, et al. PVSAM: Adapting geometric prompts to segment anything model for photovoltaic detection in remote sensing imagery. Applied Energy. 2026;404:127137.
- Hafdaoui H, et al. Detection of photovoltaic power plants in satellite images using artificial intelligence techniques. Next Research. 2026;6:101385.
- Alkhatib MQ, et al. Enhancing photovoltaic panel segmentation in remote sensing imagery: A comparative study of attention-integrated U-Net models. ISPRS Annals of the Photogrammetry, Remote Sensing and Spatial Information Sciences. 2025;X-G-2025:63-9.