This retrospective cohort study found that patients receiving early stepwise rehabilitation after wrist arthroscopy had more favorable observed wrist function, pain scores, nerve conduction indicators, psychological status, rehabilitation compliance, and satisfaction than those receiving conventional rehabilitation, supporting further evaluation of structured, staged postoperative rehabilitation pathways.
Research Article
Association of Early Stepwise Rehabilitation Nursing with Wrist Function and Pain Outcomes After Wrist Arthroscopy: A Retrospective Cohort Study
* These authors contributed equally
In This Article
Summary
Abstract
Wrist arthroscopy is widely used as a minimally invasive treatment for wrist disorders. Postoperative rehabilitation is an important component of functional recovery. Conventional rehabilitation often follows a relatively uniform schedule and relies primarily on pharmacological pain management; consequently, stage-specific and individual needs may not be fully addressed. This single-center retrospective cohort analysis compared observed postoperative outcomes between patients receiving early stepwise rehabilitation care and those receiving the traditional rehabilitation model. The intervention group (n = 94) adopted a phased rehabilitation plan in which training intensity was dynamically adjusted according to the Numeric Rating Scale (NRS), with additional physical therapy, psychological support, and family participation. The conventional group received conventional rehabilitation. At 3 and 6 months postoperatively, the intervention group showed higher Modified Mayo Wrist Score (MMWS), greater range of motion (ROM), stronger grip strength, and lower NRS scores than the conventional group (P < 0.001). Postrehabilitation complications were numerically less frequent in the intervention group than in the conventional group, but the difference was not statistically significant (6.4% vs. 15.3%, P = 0.080). The intervention group also showed higher postrehabilitation sensory conduction velocity (SCV), motor conduction velocity (MCV), and sensory nerve action potential (SNAP) amplitude, shorter two-point discrimination distance, lower Self-Rating Anxiety Scale (SAS) and Self-Rating Depression Scale (SDS) scores, higher rehabilitation compliance, and higher satisfaction than the conventional group (P < 0.05). Early stepwise rehabilitation was associated with more favorable functional, pain, neurophysiological, sensory, psychological, adherence, and satisfaction outcomes; however, given the single-center retrospective design and non-random treatment allocation, these findings should be interpreted as associations rather than evidence of causal effectiveness.
Introduction
The wrist joint, as one of the most flexible joints in human activities, bears key functions such as grasping and rotating1. Wrist injuries commonly result from sports injuries, occupational strain, and degenerative conditions, often causing pain in the wrist joint, limited mobility, and even functional impairment, which seriously affects the quality of life of patients2. Wrist arthroscopy permits minimally invasive visualization, diagnosis, and treatment of intra-articular wrist pathology and has been increasingly used in clinical practice3,4. Given the relationship between postoperative rehabilitation quality and functional outcomes, supporting joint function recovery and pain management through structured nursing remains a clinical concern5,6.
Postoperative rehabilitation after wrist arthroscopy commonly follows the traditional model of early passive movement followed by progressive active training. Although early intervention is emphasized, the rehabilitation regimen may be relatively uniform, with poorly defined stage boundaries7. Postoperative pain and fear of movement may limit participation in rehabilitation and contribute to stiffness or disuse-related weakness8,9. Pain and fear of movement may also complicate rehabilitation progression and require individualized assessment and adjustment10. Existing research has focused on individual rehabilitation measures11, with insufficient attention to phased, individualized, stepwise nursing interventions. There is a lack of systematic research on dynamic assessment and adjustment strategies across different recovery stages after surgery. Because wrist arthroscopy is performed for heterogeneous conditions, rehabilitation should be adapted to the underlying pathology and procedure rather than applied as a universal protocol. Current postoperative wrist rehabilitation recommendations remain heterogeneous, and no universally accepted protocol has been established for several wrist conditions, including triangular fibrocartilage complex (TFCC)-related procedures12. Therefore, the main gap concerns not only whether early rehabilitation is useful, but also how postoperative rehabilitation can be organized using explicit decision criteria, including pain intensity, swelling, wound condition, range of motion, exercise tolerance, adherence, and neurological symptoms.
To address this gap, this study retrospectively evaluated an early stepwise rehabilitation care model used in routine clinical practice. Rather than relying on postoperative time alone, the model combined postoperative timing with the patient's functional status and divided rehabilitation into three stages—protective immobilization, functional activation, and intensive training—each with targeted goals. Meanwhile, changes in pain intensity were dynamically monitored by using the Numeric Rating Scale (NRS), supplemented by multi-dimensional measures such as physical therapy, psychological support, and family participation. This study aimed to examine whether receipt of early stepwise rehabilitation nursing was associated with differences in wrist function, pain, complications, neurophysiological and sensory indicators, psychological status, adherence, and satisfaction compared with conventional rehabilitation after wrist arthroscopy.
Protocol
The study was approved by the Ethics Committee of Cangzhou Hospital of Integrated Traditional and Western Medicine (approval No.: CZX2023042). Because this study used retrospective, de-identified clinical data, the ethics committee waived the requirement for written informed consent. All data were handled in accordance with institutional data protection requirements.
Sample size calculation
The primary endpoint was the Modified Mayo Wrist Score (MMWS) at 3 months post operation. The sample size estimation was conducted using the method for comparing the means of two independent samples. Based on previous studies13, it was assumed that the difference in MMWS before and after the intervention was 15 points. With α = 0.05 and β = 0.20, G*Power 3.1 indicated a required sample size of 89 patients per group. Because this was a retrospective cohort study, the calculation was used only to assess the adequacy of the available cohort for the MMWS analysis and did not determine recruitment or group allocation.
Study participants
This single-center retrospective cohort study screened patients who underwent wrist arthroscopy at Cangzhou Hospital of Integrated Traditional and Western Medicine from August 2022 to May 2025. The cohort time zero was defined as the start of postoperative rehabilitation. T0 referred to the baseline assessment before rehabilitation initiation, T1 referred to 3 months after rehabilitation initiation, and T2 referred to 6 months after rehabilitation initiation. Inclusion criteria were: (1) age 18–65 years; (2) first wrist arthroscopy for an eligible wrist disorder; and (3) initiation of postoperative rehabilitation at this hospital. Exclusion criteria were: (1) severe ipsilateral upper-limb trauma, neurovascular injury, or previous wrist surgery; (2) a prerehabilitation condition that prevented implementation of the planned rehabilitation pathway, including severe postoperative infection, active wrist mobility less than 50% of the contralateral side, deep-vein thrombosis, or another condition requiring interruption of rehabilitation; (3) cognitive or psychiatric impairment that precluded rehabilitation assessment; and (4) more than 20% unavailable follow-up data. Complications occurring after rehabilitation initiation were retained and analyzed as safety outcomes.
Patients were classified according to the rehabilitation pathway documented in the available retrospective dataset. Both rehabilitation pathways were used during the same study period, although the clinical rationale for selecting one over the other was not documented. The recorded diagnostic categories included triangular fibrocartilage complex (TFCC) pathology, carpal tunnel syndrome, wrist synovitis, and persistent wrist symptoms after distal radius fracture. Specific arthroscopic procedure type was not consistently available in the analytic dataset and therefore could not be summarized reliably or used for procedure-specific analyses. The conventional group received conventional postoperative rehabilitation, whereas the intervention group received the early stepwise rehabilitation pathway. No prospective recruitment, randomization, allocation concealment, or trial registration was performed. The available analytic dataset included 192 analyzed patients and contained complete values for all recorded variables.
Rehabilitation protocol
Rehabilitation pathway, exercise completion, pain score, rehabilitation compliance, and protocol adjustment were recorded in the available retrospective dataset or, when available, in rehabilitation records. The conventional group received routine postoperative rehabilitation nursing. Therapist-assisted passive wrist flexion and extension (0°–40°) were initiated 24–48 h after surgery, followed by active-assisted exercises at postoperative week 1 and active exercises at week 2; no predefined stage boundaries were used. Pain management relied primarily on non-steroidal anti-inflammatory drugs (NSAIDs) as needed. In the conventional group, progression was primarily determined by postoperative time and patient tolerance, without predefined stage-specific decision thresholds.
The intervention group followed a three-stage pathway comprising protective immobilization, functional activation, and intensive training (Table 1). During the early protective stage, physical cooling was used to control pain and swelling, and continuous passive wrist flexion and extension were limited to 0°–30°. During functional activation, active wrist flexion and extension were progressively advanced toward approximately 60° by postoperative week 3, whereas the later intensive stage focused on progressive functional use and strengthening through completion of the 3-month rehabilitation period. Progression between stages was guided by postoperative time, NRS score, swelling, wound condition, range of motion, postexercise tolerance, and the absence of aggravated pain or new neurological symptoms. If NRS was ≥4, swelling increased, or pain persisted after exercise, training intensity was reduced, and the patient was reassessed. Rehabilitation was supervised by qualified rehabilitation staff, with one supervised session provided each week for approximately 15 min; family members assisted with completing home exercises and reported any increased pain, swelling, wound abnormalities, or new neurological symptoms. The available retrospective records did not consistently specify fixed calendar cutoffs for every stage transition or a standardized resistance load; therefore, the pathway is reported according to the documented clinical criteria and functional targets rather than an unrecorded dose schedule. Both groups received rehabilitation for 3 months, and rehabilitation compliance was defined as the proportion of planned rehabilitation days completed as documented in the available records.
Outcomes
The MMWS14 and NRS15 were assessed at T0, T1, and T2. MMWS ranges from 0 to 100, with higher scores indicating better wrist function; MMWS at 3 months after rehabilitation initiation was defined as the primary outcome, whereas the remaining outcomes were considered secondary or exploratory. NRS ranges from 0 to 10, with higher scores indicating greater pain intensity. In addition, wrist range of motion (ROM), including dorsiflexion and palmar flexion, was measured, and grip strength of the affected hand was assessed using an electronic grip dynamometer. Recorded postrehabilitation complications included joint stiffness, muscle atrophy, and heterotopic ossification; muscle atrophy was retained because it was documented in the source records, although it is uncommon after wrist arthroscopy. Median nerve sensory conduction velocity (SCV), ulnar nerve motor conduction velocity (MCV), and superficial radial nerve sensory nerve action potential (SNAP) amplitude were measured before and after rehabilitation using neurophysiological testing. These measurements were extracted from the available clinical records and analyzed as exploratory outcomes.
Two-point discrimination was assessed before and after rehabilitation as an exploratory measure of hand tactile function. Psychological status was assessed before and after rehabilitation using the Self-Rating Anxiety Scale (SAS) and Self-Rating Depression Scale (SDS)16, with higher scores indicating more severe symptoms; both scales were treated as exploratory outcomes related to rehabilitation participation rather than measures of surgical efficacy. Finally, patients' rehabilitation compliance (the proportion of days completed as planned) was recorded, and their satisfaction with rehabilitation services was evaluated after rehabilitation using a 5-point Likert scale14. The available dataset included group, age, disease duration, sex, occupation, education, diagnosis, surgical side, postrehabilitation complications, satisfaction, rehabilitation compliance, NRS, MMWS, wrist ROM, grip strength, SCV, MCV, SNAP, two-point discrimination distance, SAS, and SDS. Body mass index (BMI), comorbidities, surgical complexity, time from surgery to rehabilitation initiation, analgesic or anti-inflammatory drug use, therapist identity, patient-level deviations from the planned session frequency or duration, total rehabilitation dose, and assessor blinding were not recorded in the available dataset.
Statistical analysis
Continuous variables were analyzed according to their distribution, which was evaluated with the Shapiro–Wilk test and Q–Q plots. Data meeting normality assumptions are reported as mean (standard deviation [SD]); between-group and within-group comparisons were performed using independent-samples and paired t tests, respectively. For variables that did not follow a normal distribution, results are presented as median (interquartile range), with the Mann–Whitney U test used for between-group comparisons and the Wilcoxon signed-rank test for within-group comparisons. Categorical variables were summarized as n (%), and between-group comparisons were performed using the χ2 test or Fisher’s exact test, as appropriate. For 2 × 2 comparisons of total postrehabilitation complications and the proportion of patients who were satisfied or very satisfied, the continuity-corrected χ2 test was used; the overall satisfaction distribution was compared using the Pearson χ2 test. P < 0.05 was used as the significance threshold. Because this was a retrospective observational study, between-group differences were interpreted as associations rather than causal effects.
Changes over time in MMWS, NRS, wrist range of motion, and grip strength were evaluated with generalized estimating equation models. A Gaussian distribution and identity link were specified, with an exchangeable structure used to account for within-subject correlation and robust standard errors used for inference. The models included rehabilitation group, time, the group-by-time interaction, age, disease duration, sex, diagnosis, and surgical side; the group-by-time interaction was used to determine whether changes over time differed between groups. Outcomes measured only before and after rehabilitation were analyzed using baseline-adjusted linear regression with heteroskedasticity-consistent type 3 (HC3) robust standard errors and the same available covariates. To control the family-wise type I error rate across the four exploratory neurophysiological and sensory outcomes, P values for SCV, MCV, SNAP amplitude, and two-point discrimination were adjusted using the Holm method. Effect estimates with 95% confidence intervals (CIs) were reported where available. Multiple secondary outcomes were interpreted cautiously.
Results
Baseline characteristics of study participants
The final analytic cohort comprised 98 patients in the conventional group and 94 in the intervention group, with no missing value among the variables recorded in the available dataset. Baseline age, disease duration, sex, occupation, education level, diagnosis, surgical side, NRS, MMWS, ROM, grip strength, SCV, MCV, SNAP, two-point discrimination distance, SAS, and SDS were comparable between groups (P > 0.05, Table 2). However, residual confounding could not be excluded because this was a retrospective study and because BMI, comorbidities, surgical complexity, time from surgery to rehabilitation initiation, and medication use were not available in the dataset.
Comparison of joint function
The groups showed no significant differences in MMWS, ROM, or grip strength at T0 (P > 0.05). At T1 and T2, the intervention group showed higher MMWS than the conventional group (T1: 78.63 ± 8.84 vs. 69.69 ± 8.61; T2: 91.43 ± 4.77 vs. 82.06 ± 6.71; P < 0.001). Dorsiflexion ROM, palmar flexion ROM, and grip strength were also higher in the intervention group at T1 and T2 (P < 0.001). The adjusted group-by-time interaction was significant for MMWS (Wald χ2[2] = 32.16, P < 0.001), dorsiflexion ROM (χ2[2] = 17.55, P < 0.001), palmar flexion ROM (χ2[2] = 8.43, P = 0.015), and grip strength (χ2[2] = 13.06, P = 0.001). The adjusted MMWS differences between the intervention and conventional groups were 8.80 points at T1 (95% CI, 6.39–11.21; P < 0.001) and 9.23 points at T2 (95% CI, 7.58–10.88; P < 0.001). The corresponding adjusted differences were 6.13° and 8.04° for dorsiflexion ROM, 6.08° and 5.70° for palmar flexion ROM, and 4.31 kg and 3.96 kg for grip strength at T1 and T2, respectively (Figure 1).
For clinical context, the adjusted between-group MMWS differences were 8.8 points at T1 and 9.2 points at T2. A recently reported 11.5-point minimal clinically important difference (MCID) for the Mayo Wrist Score was derived after isolated carpal tunnel release and therefore cannot be applied directly to this heterogeneous cohort; neither adjusted MMWS difference exceeded that condition-specific threshold. The adjusted NRS differences of 0.6 and 0.9 points were below the approximately 1-point MCID reported for chronic musculoskeletal pain, while the adjusted grip-strength differences of 4.3 and 4.0 kg were below the 6.5-kg MCID reported after distal radius fracture. No validated diagnosis-independent MCID was identified for wrist ROM; these comparisons are therefore contextual rather than definitive because the published thresholds were derived in different populations and generally refer to within-patient change rather than between-group differences.
Comparative pain and safety assessments
The NRS score at T0 was similar between the groups (5.05 ± 1.63 vs. 5.28 ± 1.62, P = 0.336). At T1 and T2, the intervention group showed lower NRS scores than the conventional group (T1: 3.83 ± 1.15 vs. 4.40 ± 0.98; T2: 2.15 ± 0.82 vs. 3.03 ± 0.99; P < 0.001). The reduction from T0 to T2 was also greater in the intervention group (-3.13 ± 1.68 vs. -2.02 ± 1.94, P < 0.001). Postrehabilitation complications were numerically less frequent in the intervention group than in the conventional group, but the difference was not statistically significant (6.38% vs. 15.31%, P = 0.080; Table 3). The adjusted group-by-time interaction was significant for NRS scores (Wald χ2[2] = 18.19, P < 0.001). The adjusted between-group differences were −0.56 points at T1 (95% CI −0.85 to −0.26, P < 0.001) and −0.87 points at T2 (95% CI −1.13 to −0.61, P < 0.001).
Comparison of neurological functions
SCV, MCV, and SNAP were comparable between groups before rehabilitation (P > 0.05). After rehabilitation, the intervention group showed higher SCV (52.09 ± 6.19 vs. 47.30 ± 6.37, P < 0.001), MCV (52.13 ± 6.33 vs. 49.56 ± 6.27, P = 0.005), and SNAP (16.48 ± 2.73 vs. 14.33 ± 2.76, P < 0.001) than the conventional group. After adjustment for the corresponding baseline measurement, age, disease duration, sex, diagnosis, and surgical side, the intervention group had higher postrehabilitation SCV (adjusted difference, 4.62; 95% CI 2.73–6.51; Holm-adjusted P < 0.001), MCV (2.37; 95% CI 0.50–4.24; Holm-adjusted P = 0.013), and SNAP amplitude (2.29; 95% CI 1.48–3.10; Holm-adjusted P < 0.001), together with a shorter two-point discrimination distance (−2.59; 95% CI −3.24 to −1.94; Holm-adjusted P < 0.001; Figure 2).
Comparison of psychological status
Regarding psychological status, the conventional group showed little change in SAS and SDS scores after rehabilitation (P > 0.05). In the intervention group, both SAS and SDS scores decreased after rehabilitation and were lower than those in the conventional group (SAS: 37.70 ± 7.03 vs. 45.12 ± 8.95; SDS: 40.11 ± 6.65 vs. 48.00 ± 8.44; P < 0.001; Figure 3). After adjustment for the corresponding baseline score and the available covariates, the intervention group had lower postrehabilitation SAS scores (adjusted difference, −7.80; 95% CI −10.18 to −5.42; P < 0.001) and SDS scores (−8.08; 95% CI −10.30 to −5.86; P < 0.001).
Comparison of rehabilitation compliance and patient satisfaction
The intervention group showed a higher rehabilitation compliance rate than the conventional group (84.34 ± 7.24% vs. 76.04 ± 8.65%, P < 0.001). According to the satisfaction survey results, the overall distribution of satisfaction differed between groups (P = 0.029), and the proportion of patients who were satisfied or very satisfied was higher in the intervention group than in the conventional group (91.49% vs. 79.59%, P = 0.033; Table 4). Taken together, the adjusted findings were consistently more favorable for several functional, pain, neurophysiological, sensory, psychological, adherence, and satisfaction outcomes in the stepwise rehabilitation group; however, postrehabilitation complications did not differ significantly, and several statistically significant between-group differences did not exceed available condition-specific clinically meaningful thresholds, so the results should be interpreted as associative rather than as evidence of efficacy.
Data Availability
All raw data in this study have been uploaded as Supplementary Table S1.
FIGURES AND TABLES:
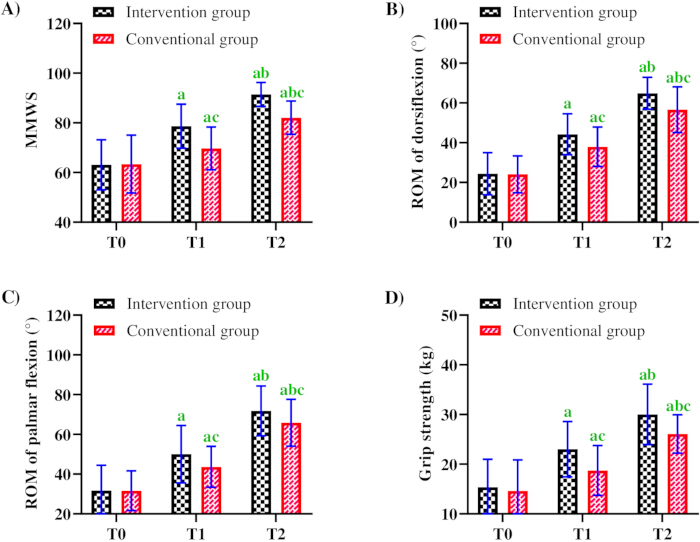
Figure 1: Functional outcomes according to rehabilitation pathway. The panels show comparisons of MMWS (A), ROM of dorsiflexion (B), ROM of palmar flexion (C), and grip strength (D) between the two groups at T0, T1, and T2. T0, before rehabilitation initiation; T1, 3 months after rehabilitation initiation; T2, 6 months after rehabilitation initiation. Data are presented as mean ± SD. aP < 0.05 compared with T0 within the same group; bP < 0.05 compared with T1 within the same group; cP < 0.05 compared with the conventional group. Combined letters indicate that the corresponding comparisons were statistically significant. Please click here to view a larger version of this figure.
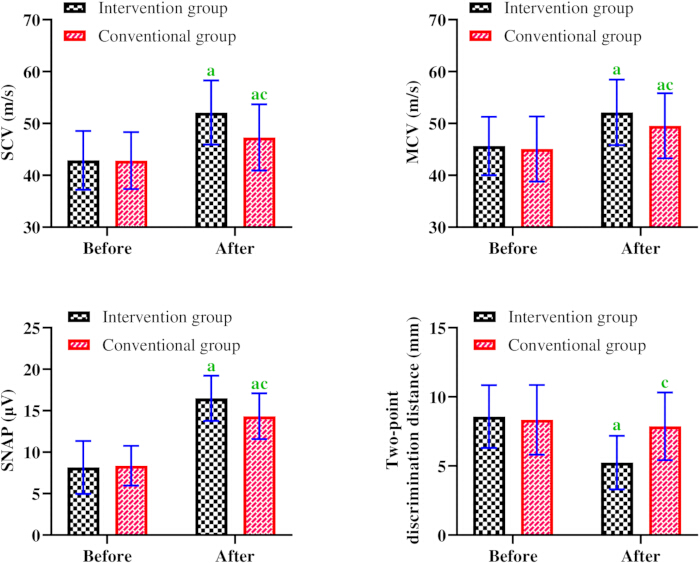
Figure 2: Neurophysiological and sensory outcomes according to rehabilitation pathway. The panels show sensory conduction velocity (SCV; A), motor conduction velocity (MCV; B), sensory nerve action potential (SNAP) amplitude (C), and two-point discrimination distance (D) before and after rehabilitation. Data are presented as mean ± SD. Adjusted between-group differences were estimated using baseline-adjusted regression controlling for age, disease duration, sex, diagnosis, and surgical side; P values were adjusted across the four outcomes using the Holm method. aP < 0.05 compared with before rehabilitation within the same group; cP < 0.05 compared with the conventional group. Combined letters indicate that the corresponding comparisons were statistically significant. Please click here to view a larger version of this figure.
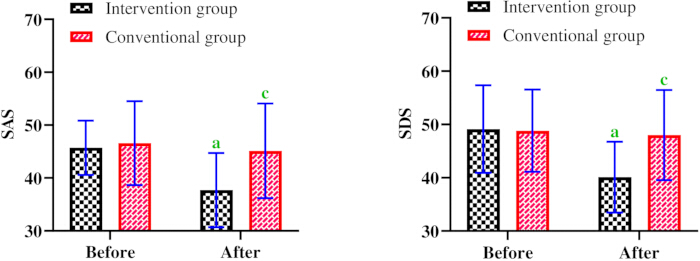
Figure 3: Psychological outcomes according to rehabilitation pathway. The panels show comparisons of SAS (A) and SDS (B) between the two groups before and after rehabilitation. Data are presented as mean ± SD. aP < 0.05 compared with before rehabilitation within the same group; cP < 0.05 compared with the conventional group. Please click here to view a larger version of this figure.
| Stage | Timing and primary goal | Rehabilitation content | Progression and adjustment criteria | Supervision and home rehabilitation |
| Protective immobilization | Early postoperative phase; pain and swelling control | Physical cooling; continuous passive wrist flexion and extension limited to 0°–30° | Progression was considered according to postoperative time, NRS score, swelling, wound condition, ROM, post-exercise tolerance, and the absence of aggravated pain or new neurological symptoms. If NRS was ≥4, swelling increased, or pain persisted after exercise, training intensity was reduced and reassessment was performed. | One supervised session per week, approximately 15 min per session; family-assisted home exercise and reporting of increased pain, swelling, wound abnormalities, or new neurological symptoms |
| Functional activation | After the early protective stage; active flexion and extension progressed toward approximately 60° by postoperative week 3 | Progressive active wrist flexion and extension within tolerance, with gradual advancement of functional use | The same symptom- and function-based criteria were used for progression; worsening pain, swelling, or neurological symptoms prompted reduction of training intensity and reassessment. | Weekly supervised rehabilitation combined with family-assisted home exercise |
| Intensive training | After achievement of functional-activation targets through completion of the 3-month rehabilitation period | Progressive functional training and wrist/grip strengthening according to recovery status and tolerance | Functional demand and strengthening were advanced only while pain, swelling, wound condition, exercise tolerance, and neurological status remained acceptable; NRS ≥4 or symptom aggravation prompted reduction of intensity and reassessment. | Weekly supervised rehabilitation combined with continued home exercise and family participation |
Table 1: Stage-specific components and progression criteria of the early stepwise rehabilitation pathway. Exact calendar cutoffs between stages and a fixed resistance-training dose were not consistently documented in the retrospective records; therefore, stage progression depended on postoperative timing and the clinical and functional criteria shown above. Abbreviations: NRS = Numeric Rating Scale; ROM = range of motion.
| Intervention group | Conventional group | Statistical value | P value | ||
| n=94 | n=98 | χ2 or t | |||
| Age (years old) | 45.61±10.58 | 45.65±11.29 | 0.03 | 0.977 | |
| Sex | Male | 58 (61.70) | 52 (53.06) | 1.46 | 0.226 |
| Female | 36 (38.30) | 46 (46.94) | |||
| Type of occupation | Athletes | 22 (23.40) | 21 (21.43) | 0.81 | 0.668 |
| Office worker | 18 (19.15) | 24 (24.49) | |||
| Manual laborer | 54 (57.45) | 53 (54.08) | |||
| Level of education | < high school | 38 (40.43) | 34 (34.69) | 0.67 | 0.412 |
| ≥ high school | 56 (59.57) | 64 (65.31) | |||
| Types of wrist disorders | TFCC | 19 (20.21) | 18 (18.37) | 1.19 | 0.88 |
| Carpal tunnel syndrome | 15 (15.96) | 18 (18.37) | |||
| Wrist synovitis | 28 (29.79) | 24 (24.49) | |||
| Distal radius fracture | 28 (29.79) | 32 (32.65) | |||
| Other | 4 (4.26) | 6 (6.12) | |||
| Duration of disease (d) | 18.29±5.42 | 19.34±4.86 | 1.41 | 0.159 | |
| Side of operation | Left | 42 (44.68) | 40 (40.82) | 0.29 | 0.588 |
| Right | 52 (55.32) | 58 (59.18) |
Table 2: Baseline demographic, clinical, and pre-rehabilitation outcome characteristics of the study cohort. Note: Data are presented as mean ± standard deviation or n (%), as appropriate. Statistical values are presented as χ² or t values. Abbreviations: MMWS, Modified Mayo Wrist Score; NRS, Numeric Rating Scale; ROM, range of motion.
| Intervention group | Conventional group | Statistical value | P value | ||
| n=94 | n=98 | χ2 or t | |||
| NRS | T0 | 5.28±1.62 | 5.05±1.63 | 0.96 | 0.337 |
| T1 | 3.83±1.15a | 4.40±0.98a | 3.69 | <0.001 | |
| T2 | 2.15±0.82ab | 3.03±0.99ab | 6.72 | <0.001 | |
| Complications | Stiff joints | 3 (3.19) | 8 (8.16) | ||
| Muscle atrophy | 2 (2.13) | 5 (5.10) | |||
| Heterotopic ossification | 1 (1.06) | 2 (2.04) | |||
| Total | 6.38% | 15.31% | 3.92 | 0.047 |
Table 3: Pain scores, changes in pain scores, and post-rehabilitation complications according to rehabilitation pathway. Note: Data are presented as mean ± standard deviation or n (%), as appropriate. NRS, Numeric Rating Scale; T0, before rehabilitation initiation; T1, 3 months after rehabilitation initiation; T2, 6 months after rehabilitation initiation. aP < 0.05 compared with T0 within the same group; bP < 0.05 compared with T1 within the same group. Statistical values are presented as χ² or t values, as appropriate. Abbreviation: NRS = Numeric Rating Scale.
| Intervention group | Conventional group | Statistical value | P value | |
| n=94 | n=98 | χ2 or t | ||
| Rehabilitation compliance rate | 84.34±7.24 | 76.04±8.65 | 7.2 | <0.001 |
| Very satisfied (5 points) | 46 (48.94) | 34 (34.69) | ||
| Satisfaction (3-4 points) | 40 (42.55) | 44 (44.90) | ||
| Not satisfied (1-2 points) | 8 (8.51) | 20 (20.41) | ||
| Satisfaction rate (3-5 points) | 91.49% | 79.59% | 5.45 | 0.02 |
Table 4: Rehabilitation compliance and patient satisfaction according to rehabilitation pathway. Note: Data are presented as mean ± standard deviation or n (%), as appropriate. Rehabilitation compliance rate is expressed as a percentage. Patient satisfaction was assessed using a 5-point satisfaction scale. The satisfaction rate represents the proportion of patients rated as satisfied or very satisfied (3–5 points). Statistical values are presented as χ² or t values, as appropriate.
Supplementary Table S1. Raw data used in this study. Please click here to download this file.
Discussion
In this retrospective cohort study, patients who received early stepwise rehabilitation nursing after wrist arthroscopy showed more favorable observed outcomes than those who received conventional rehabilitation, including wrist function, pain scores, neurophysiological and sensory indicators, psychological status, rehabilitation compliance, and satisfaction. Specifically, MMWS, ROM, and grip strength were more favorable in the intervention group than in the conventional group at 3 and 6 months postoperatively, and the intervention group showed greater reductions in NRS scores. Postrehabilitation complications were numerically less frequent in the intervention group, but this difference was not statistically significant. The intervention group also showed more favorable postrehabilitation neurophysiological measures and a shorter two-point discrimination distance. In addition, the intervention group showed larger decreases in SAS and SDS scores, higher rehabilitation compliance, and greater patient satisfaction. These findings suggest an association between the documented stepwise rehabilitation pathway and more favorable multidimensional postoperative outcomes, but they do not establish causal effectiveness.
The observed functional differences may be related to the staged progression from protective immobilization to functional activation and intensive training. Previous evidence supports early rehabilitation for some functional and pain outcomes after distal radius fracture17 and highlights the role of progressive wrist stability training18, whereas TFCC-specific studies show substantial variation in immobilization and the timing of motion12,19. In the present cohort, the staged pathway was associated with more favorable functional outcomes; however, the retrospective nonrandomized design does not allow these differences to be attributed to the rehabilitation pathway itself17. Furthermore, the NRS score was lower in the intervention group than in the conventional group at follow-up, whereas the incidence of complications was only numerically lower and did not reach statistical significance. These findings suggest a possible association between dynamic pain monitoring and more favorable pain-related outcomes. The conventional pathway relied primarily on NSAIDs as needed, whereas the stepwise pathway incorporated NRS-based adjustment of rehabilitation intensity and nonpharmacological measures, such as physical cooling, when NRS was ≥4. Because medication use and dose were not recorded in the retrospective dataset, no between-group inference regarding analgesic consumption can be made. Psychological factors have been associated with outcomes after wrist surgery20,21, which is broadly consistent with the observed differences in SAS and SDS scores. This interpretation is consistent with previous reports showing variability in postoperative wrist and TFCC rehabilitation recommendations, particularly regarding protection, timing of motion, and progression criteria12.
The more favorable nerve conduction and two-point discrimination findings in the intervention group indicate differences in exploratory neurophysiological and sensory outcomes; however, these measurements do not directly demonstrate reduced nerve entrapment, axonal regeneration, or tissue-level nerve repair. Because the cohort included several diagnoses, the observed neurophysiological differences cannot be attributed to reduced nerve adhesion, decompression, or another mechanism specific to carpal tunnel syndrome; these measurements should therefore be interpreted as exploratory and diagnosis-dependent. Finally, the higher compliance observed in the intervention group may be related to the individualized and structured features of the stepwise pathway, although unmeasured differences between groups cannot be excluded. The conventional pathway used time-based progression without predefined stage-specific thresholds, whereas the stepwise pathway incorporated symptom-based adjustment and family participation; nevertheless, the same overarching three-stage framework was applied across different diagnoses and was not fully pathology-specific. The satisfaction survey showed that 91.49% of patients in the intervention group were satisfied or very satisfied, suggesting greater patient acceptance of the structured nursing model.
Previous studies have primarily evaluated diagnosis-specific rehabilitation after distal radius fracture or TFCC repair. Early rehabilitation after distal radius fracture surgery has been associated with more favorable short-term functional outcomes17, whereas surveys and reviews of TFCC repair have shown substantial variation in immobilization duration, timing of motion, and progression criteria10,12,19. The present findings are broadly consistent with the potential value of structured progression, but the inclusion of several diagnoses limits direct comparison with these condition-specific studies.
Taken together, the findings suggest that a structured stepwise rehabilitation pathway may be a useful care-organization model after wrist arthroscopy, but its clinical effectiveness should be evaluated prospectively using predefined allocation procedures and standardized outcome assessment. Because the clinical rationale for pathway selection was not recorded, confounding by indication and other residual confounding cannot be excluded; assessor blinding was also undocumented, and BMI, comorbidities, surgical complexity, time from surgery to rehabilitation initiation, analgesic or anti-inflammatory medication use, therapist identity, patient-level rehabilitation dose, and other unmeasured factors could not be incorporated into the adjusted analyses. Neurophysiological and sensory outcomes may also reflect different pathophysiological mechanisms across diagnoses and procedures; although diagnosis was included as a covariate, procedure-level data were unavailable, and subgroup sizes were insufficient for reliable diagnosis-specific analyses. In addition, the available dataset included the final analytic cohort but did not contain a separate screening log of all potentially eligible patients, including those excluded or lost to follow-up. Longer postoperative follow-up is needed to assess the maintenance of functional outcomes beyond 6 months. Finally, the lack of stratified analysis based on comorbidities such as diabetes and other metabolic or vascular conditions may affect the interpretability of neurological function recovery, because diabetes has been associated with differences in nerve conduction or short-term recovery after carpal tunnel release in previous studies22,23. Future studies should include prospective designs, longer follow-up periods, diagnosis-specific or stratified analyses, clearer reporting of rehabilitation dose and adherence, and standardized, blinded outcome assessment when feasible.
In conclusion, in this single-center retrospective cohort study, receipt of early stepwise rehabilitation nursing after wrist arthroscopy was associated with more favorable wrist function, pain scores, neurophysiological and sensory indicators, psychological status, rehabilitation compliance, and satisfaction compared with conventional rehabilitation nursing. Postrehabilitation complications were numerically less frequent in the stepwise rehabilitation group, but the difference was not statistically significant. These findings support further prospective controlled evaluation of structured, criteria-based postoperative rehabilitation pathways, but they do not establish causal effectiveness.
Disclosures
The authors have no conflicts of interest to declare.
Author Contributions:
Lili Men and Xin Liu contributed equally to this work and were responsible for the conception and design of the study. Lulu Wei, Wei Zhao, and Pengcheng Xu contributed to data acquisition, collection, and extraction from the available clinical records. Lulu Wei and Pengcheng Xu performed the data analysis and visualization. Wei Zhao provided methodological and technical support. Xing Wu supervised the study and contributed to the critical revision of the manuscript. All authors reviewed and approved the final version of the manuscript.
Acknowledgements
This work was supported by the Hebei Key Laboratory of Integrated Traditional and Western Medicine in Osteoarthrosis Research (Preparing), Project: Arthroscopy-assisted precise minimally invasive treatment of wrist and hand joint fractures and diseases, Grant No.: 222106113
Materials
| Name | Company | Catalog Number | Comments |
|---|---|---|---|
| 5-Point Likert Satisfaction Scale | Rensis Likert / standardized non-commercial Likert-type rating method | 5-point Likert response format | Five-category Likert-type rating format used after rehabilitation to evaluate patients' satisfaction with rehabilitation services. |
| Baseline 2-Point Aesthesiometer / Two-Point Discriminator | Fabrication Enterprises, Inc., USA; corresponding two-point discrimination equipment supplier reported by the same hospital team: Shanghai Ruishi Biological Technology Co., Ltd., China | Baseline® Model 12-1480 | Sensory examination instrument used to assess two-point discrimination distance and cutaneous tactile discrimination. The same hospital team reported a two-point discrimination tester from Shanghai Ruishi Biological Technology Co., Ltd.; Model 12-1480 is a commercially identifiable Baseline® two-point aesthesiometer suitable for this measurement. |
| G*Power Statistical Power Analysis Software | Heinrich Heine University Düsseldorf / G*Power Development Team, Düsseldorf, Germany | Version 3.1 | Statistical power and sample-size calculation software used to estimate the sample size required for comparison of the primary endpoint, the Mayo Modified Wrist Score (MMWS), between two independent groups. G*Power 3.1 was developed by Faul, Erdfelder, Buchner, and Lang. |
| Jamar Plus+ Digital Goniometer | Performance Health / Jamar®, USA | 8-inch Digital Goniometer; Item/SKU No. 081660133 | Digital joint-angle measurement instrument corresponding to the wrist ROM assessment reported in the study; suitable for measuring wrist dorsiflexion and palmar flexion in degrees. Manufacturer instructions identify 081660133 as the 8-inch Jamar Plus+ Digital Goniometer. |
| Jamar Plus+ Digital Hand Dynamometer | Performance Health / Jamar®, USA; corresponding equipment source reported by the same hospital team: Shanghai Yuyan Scientific Instruments Co., Ltd., China | Jamar Plus+ Digital; Item No. 081406453; Catalog No. 563213 | Electronic hand dynamometer used to quantify grip strength of the affected hand. The digital model uses electronic load-cell technology and measures grip force from 0 to 200 lb (90 kg). The same hospital research team previously reported use of a Jamar Plus grip-strength instrument supplied by Shanghai Yuyan Scientific Instruments Co., Ltd. |
| Kinetec Maestra Hand & Wrist Continuous Passive Motion Machine | Kinetec USA, Inc. / Kinetec®, USA | Maestra™; SKU 4621005001 | Hand- and wrist-specific continuous passive motion (CPM) system corresponding to the CPM machine mentioned in the manuscript for controlled passive wrist mobilization. The Maestra provides programmable passive movements for postoperative hand and wrist rehabilitation. |
| Modified Mayo Wrist Score (MMWS) | Mayo Clinic / Cooney WP et al., Rochester, MN, USA | 100-point MMWS, 1987 version | Clinician-based wrist-function assessment comprising four domains: pain, function, range of motion, and grip strength, each contributing 25 points to a maximum score of 100; higher scores indicate better wrist function. |
| MyoTrace 400 Electromyography System | Noraxon U.S.A., Inc., Scottsdale, AZ, USA | MyoTrace 400; Catalog/Model No. 042; UDI 00816271020827 | Electromyographic/neurophysiological testing system corresponding to the nerve-conduction measurements in the study, including SCV, MCV, and SNAP-related electrophysiological assessment. The same hospital team explicitly reported a Noraxon MyoTrace 400 for neurophysiological measurements. FDA GUDID identifies Noraxon U.S.A., Inc. as the manufacturer and 042 as the catalog/model number. |
| Numerical Rating Scale (NRS) | Standardized non-commercial clinical rating scale | 11-point NRS, 0–10 | Numerical pain-intensity scale ranging from 0 to 10, with higher scores indicating greater pain. In the stepwise rehabilitation protocol, NRS was also used to dynamically adjust exercise intensity. |
| Self-Rating Anxiety Scale (SAS) | William W. K. Zung, Duke University Medical Center, USA; instrument licensing/distribution information available through Mapi Research Trust/ePROVIDE | Zung SAS; 20-item; 4-point response format; 1971 version | Self-administered psychological scale developed by Zung to quantify anxiety symptoms. It contains 20 items rated from 1 to 4; higher scores indicate greater anxiety severity. |
| Self-Rating Depression Scale (SDS) | William W. K. Zung, Department of Psychiatry, Veterans Administration Hospital and Duke Medical Center, Durham, NC, USA | Zung SDS; 20-item; 4-point response format; 1965 version | Self-administered scale developed to quantify the presence and severity of depressive symptoms; higher scores represent greater depressive symptom burden. |
References
- Ahmad K, Vashista G. A wrist injury. BMJ. 2021;372:n101.
- Rabinovich RV, et al. Midcarpal instability. J Am Acad Orthop Surg. 2023;31(15):834-44.
- Babst RH, Beeres FJP. Wrist surgery. Oper Orthop Traumatol. 2023;35(6):317-8.
- Neumeister MW, Chair E. Surgery about the wrist. Hand (N Y). 2023;18(2 Suppl):5S.
- Feng W, et al. Impact of rapid rehabilitation surgery on perioperative nursing in patients undergoing cardiac surgery: a meta-analysis. J Card Surg. 2022;37(12):5326-35.
- Zhu H, You M, Wei J, Fang S. Orem's self-care model of nursing care: a retrospective study with elders after hip arthroplasty. Nurs Sci Q. 2024;37(2):148-53.
- Lawson A, et al. Wrist deformity, bother and function following wrist fracture in the elderly. BMC Res Notes. 2020;13(1):169.
- Wei G, et al. Effects of lower-limb active resistance exercise on mobility, physical function, knee strength and pain intensity in patients with total knee arthroplasty: a systematic review and meta-analysis. BMC Musculoskelet Disord. 2024;25(1):730.
- Larsen JB, et al. Exercise and pain neuroscience education for patients with chronic pain after total knee arthroplasty: a randomized clinical trial. JAMA Netw Open. 2024;7(5):e2412179.
- McCarron L, Coombes BK, Bindra R, Bisset L. Current rehabilitation recommendations following primary triangular fibrocartilage complex foveal repair surgery: a survey of Australian hand therapists. J Hand Ther. 2023;36(4):932-9.
- Guo Z, et al. Corticomuscular integrated representation of voluntary motor effort in robotic control for wrist-hand rehabilitation after stroke. J Neural Eng. 2022;19(2):026004.
- McCarron L, Bindra R, Coombes BK, Bisset L. Wrist and forearm range of motion commencement time following primary triangular fibrocartilage complex foveal repair surgery: a scoping review. J Hand Ther. 2023;36(1):179-95.
- Wang Y, Xu Q. Design and testing of a soft parallel robot based on pneumatic artificial muscles for wrist rehabilitation. Sci Rep. 2021;11(1):1273.
- Josifovski B, et al. Validation of the Croatian versions of DASH, PRWE and Mayo Wrist Score in patients with distal radius fractures. J Clin Med. 2025;14(22):7924.
- Shafshak TS, Elnemr R. The visual analogue scale versus numerical rating scale in measuring pain severity and predicting disability in low back pain. J Clin Rheumatol. 2021;27(7):282-5.
- Philippot A, et al. Impact of physical exercise on depression and anxiety in adolescent inpatients: a randomized controlled trial. J Affect Disord. 2022;301:145-53.
- Zhou Z, Li X, Wu X, Wang X. Impact of early rehabilitation therapy on functional outcomes in patients post distal radius fracture surgery: a systematic review and meta-analysis. BMC Musculoskelet Disord. 2024;25(1):198.
- Dopfer B, Gleißner W. Wrist stability through training. Handchir Mikrochir Plast Chir. 2025;57(3):161-9.
- McCarron L, Coombes BK, Bindra R, Bisset L. Post-surgical rehabilitation guidelines for triangular fibrocartilage complex foveal repair: a survey of Australian hand and wrist surgeons. J Hand Surg Asian Pac Vol. 2024;29(4):302-8.
- Woo AOF, et al. Dorsal triangular fibrocartilage complex arthroscopic repair. J Wrist Surg. 2025;14(6):516-25.
- Sward EM, et al. The impact of psychological factors on outcome after salvage surgery for wrist osteoarthritis. J Hand Surg Eur Vol. 2022;47(8):805-11.
- Thomsen NOB, Rosén I, Dahlin LB. Neurophysiologic recovery after carpal tunnel release in diabetic patients. Clin Neurophysiol. 2010;121(9):1569-73.
- Ebrahimzadeh MH, Mashhadinejad H, Moradi A, Kachooei AR. Carpal tunnel release in diabetic and non-diabetic patients. Arch Bone Jt Surg. 2013;1(1):23-7.