This study presents the Adaptive Dual-Attention Network (ADA-Net), a two-stage framework for automated industrial quality inspection. It combines DenseNet-121 with ECA and SE attention mechanisms to enhance feature learning. Evaluation on the VisA dataset demonstrates its effectiveness, robustness, and interpretability for industrial anomaly detection.
Research Article
Adaptive Dual-Attention DenseNet for Object-Aware Two-Stage Industrial Defect Detection
In This Article
Summary
Abstract
Industrial visual anomaly detection is crucial in intelligent manufacturing to achieve automated quality inspection with low dependency on manual inspection. Nevertheless, traditional single-stage deep learning methods struggle to detect both object classes and fine-grained anomalies across various industrial products. Furthermore, most existing channel attention mechanisms rely on a single attention type, limiting their ability to capture both global contextual information and local channel dependencies. In this paper, we present an Adaptive Dual-Attention Network (ADA-Net) for high-shot, two-stage, supervised industrial anomaly detection. The framework has a hierarchical architecture of two consecutive stages – Stage I for multi-class object classification and Stage II for binary object anomaly detection. The backbone network for feature extraction in both stages is pretrained DenseNet121. We provide an Adaptive Dual-Attention (ADA) module that uses a globally learned scalar fusion coefficient to combine Efficient Channel Attention (ECA) and Squeeze-and-Excitation (SE) representations for improved feature representation. ADA-Net is tested on the VisA dataset using the conventional 2cls_highshot supervised setup. It employs the weighted cross-entropy loss function, adaptive learning-rate scheduling, and early stopping in training. Experiment results show that our proposed ADA-Net can reach 100% Accuracy, Recall, Precision, ROC-AUC, F1-score, Cohen's Kappa, and MCC in Stage I, and Stage II results include 97.11% Accuracy, 92.84% Precision, 92.45% Recall, 92.64% F1-score, 98.00% ROC-AUC, 0.8529 MCC, and 0.8529 Cohen's Kappa. Ablation experiments and qualitative Grad-CAM analysis support the validity and explainability of the suggested framework on the evaluated VisA benchmark.
Introduction
Visual inspection in industry has become a vital part of intelligent manufacturing systems, enabling automatic defect recognition during the manufacturing process, ensuring product quality, reducing inspection costs, and increasing manufacturing efficiency. Along with the rapid development of Industry 4.0, automated inspection systems have found applications in industries such as electronics, automotive, textiles, metallurgy, and precision manufacturing. Manual inspection is usually time-consuming, highly subjective, and inconsistent, particularly for subtle surface defects. Hence, deep learning-based industrial anomaly detection provides an efficient approach for learning discriminative visual representations for defect identification. However, serious difficulties persist in industrial settings due to the diversity of object classes, defect properties, background complexity, and limited generalization across products.
Several deep learning architectures have recently been proposed to improve the accuracy of industrial anomaly detection. Chen et al.1 designed the Center-aware Residual Anomaly Synthesis (CRAS) architecture for detecting multiclass industrial anomalies by introducing center-aware residual learning and distance-guided anomaly synthesis, thereby enabling a unified model to detect anomalies across multiple industrial objects. Li et al.2 introduced multiscale feature fusion with spatial- and channel-interaction-aware attention techniques to provide the Interaction-aware Global Attention framework.
Recent research has also addressed robust feature extraction and transfer learning for industrial inspection. Wang et al.3 presented the Multi-Modal 3D Model for Novelty Recognition (M3DM-NR) system, in which RGB images, 3D point clouds, and multimodal denoising methods are used to enable robust industrial anomaly detection in the presence of noise. Chen et al.4 developed the Hard-normal Example-aware Template Mutual Matching (HETMM) system, which uses hard-normal template matching to improve anomaly localization in industrial inspection. Semitela et al.5 showed that transfer learning from pretrained convolutional neural networks can facilitate accurate surface-defect detection while reducing the requirement for large training datasets.
Related studies have also explored unsupervised and few-shot industrial inspection, attention-based defect detection, and lightweight defect-detection architectures. Lyu6 investigated industrial surface inspection using unsupervised and few-shot learning, Tong et al.7 developed a dual-attention few-shot defect-detection method for wood, Shi et al.8 proposed a double-branch attention-guided network for few-shot PCB defect detection, Chen et al.9 introduced an attention-guided lightweight framework for few-shot clothing-trademark defect detection, and Qiao et al.10 reviewed metal surface-defect detection technologies for industrial applications.
Considerable attention has also been paid to generative learning, multimodal representation learning, and foundation models for industrial anomaly detection. Jin et al.11 presented a Dual-Interrelated Diffusion Model that generates realistic anomalous images to address insufficient defective training data in few-shot settings. Yang et al.12 reviewed foundation models for defect detection across industries, highlighting the increasing use of vision foundation models and multimodal learning technologies in intelligent manufacturing systems. Lyu et al.13 proposed MVRec, a multi-view region-context system that learns discriminative context representations from multi-image regions to improve few-shot defect classification. Ma et al.14 proposed Receptive Multi-Path Anomaly Detection (ReMP-AD), a retrieval-enhanced multimodal prompt-fusion framework combining retrieval technology with a vision-language model for industrial few-shot anomaly identification. Li et al.15 proposed the multimodal anomaly inspection framework, FIND, which uses normal training data and vision-language representations to eliminate the need to train on defect images. Gu et al.16 proposed UniVAD, a training-free unified model for few-shot visual anomaly detection. Damm et al.17 proposed AnomalyDINO, which uses Self-Distillation with No Labels v2 (DINOv2) feature representations to improve patch-based industrial anomaly detection.
Transfer learning and foundation models for vision tasks have likewise become increasingly prominent in industrial quality inspection. Zhai et al.18 demonstrated the effectiveness of large-scale visual representations and pretrained vision foundation encoders for identifying industrial anomalies using a small number of samples without fine-tuning. Megahed et al.19 explored Contrastive Language–Image Pre-training (CLIP) for manufacturing quality control and demonstrated its capability for few-shot image inspection across manufacturing processes. Ilani and Banad20 developed TransMatch, a transfer learning-based framework demonstrating the potential of pretrained deep neural networks to improve defect-detection accuracy and reduce training complexity in laser powder bed fusion additive manufacturing.
Recent studies have also explored few-shot detection, automated quality grading, industrial anomaly datasets, and surface-defect detection. Related vision-based approaches have addressed image-quality assessment, surface analysis, production-line inspection, and crack detection21,22,23,24,25,26,27,28,29.
Attention mechanisms and enhanced feature representations have also been investigated for object and defect detection. Zhu et al.30 explored channel attention to improve 3D object detection, Lin et al.31 investigated adaptive object detection using an inter-domain Wasserstein metric, Wang et al.32 combined infrared instance segmentation with dual-modality vision calibration for façade-defect quantification, and Wang et al.33 proposed DABF-Net, combining dual-branch attention with bidirectional feature enhancement. Other studies have focused on improving industrial inspection and feature extraction. Wang et al.34 used image analysis for multi-target workpiece measurement, whereas He et al.35 developed an energy-efficient YOLO-based detector. He et al.36 examined thermal imaging for detecting internal CFRP defects. Qin et al.37 proposed multilevel cross-scale feature fusion for low-resolution industrial defect images, while Chi et al.38 and Ge et al.39 demonstrated that enhanced feature extraction and aggregation can improve damage detection.
Despite these advances in anomaly synthesis, few-shot learning, transfer learning, multimodal learning, foundation models, and attention-based feature extraction, several limitations remain. First, many state-of-the-art methods focus on few-shot or unsupervised anomaly detection and do not fully explore high-shot supervised learning when sufficient labeled training data are available. Second, several approaches rely on resource-intensive vision-language foundation models, multimodal networks, or transformers, which may limit their applicability in industrial settings with restricted computational resources. Third, existing methods often rely on individual attention mechanisms or large transformer architectures rather than lightweight adaptive combinations of complementary channel-attention mechanisms. In addition, industrial anomaly detection systems commonly use single-stage classification and seldom separate object identification from object-specific anomaly classification. Explainable artificial intelligence also remains comparatively underexplored in industrial anomaly detection. A comparative analysis of representative approaches, including their methodologies, contributions, advantages, and limitations relative to the proposed approach, is provided in Supplementary Table 1.
To address these limitations, this study presents an Adaptive Dual-Attention Network for High-Shot Supervised Two-Stage Industrial Anomaly Detection using the VisA benchmark dataset. A pretrained DenseNet-121 model is used to extract discriminative visual features. An Adaptive Dual-Attention (ADA) block integrates Squeeze-and-Excitation (SE) and Efficient Channel Attention (ECA) representations through a learned global scalar fusion coefficient to improve channel-wise feature representation. The framework performs two-stage supervised classification: Stage I predicts the object category, and Stage II performs object-specific anomaly classification. Grad-CAM is used to provide a qualitative visualization of the image regions that contribute to model predictions. The framework is evaluated using accuracy, precision, recall, F1-score, ROC-AUC, Matthews correlation coefficient, Cohen's kappa, confusion matrices, learning curves, Grad-CAM visualizations, and ablation analyses.
Protocol
Anomaly detection in industrial images remains difficult due to the wide diversity of visual features across different classes of industrial objects and the low visibility of defects in those objects. Traditional one-stage classification methods aim to learn a uniform decision boundary across product classes, resulting in reduced discriminative power and poorer generalization when encountering heterogeneous industrial objects. Also, some previous methods use only a single type of attention mechanism, which is not suitable for capturing both the local and global interactions needed for effective anomaly detection. To circumvent those restrictions, this paper introduces an Adaptive Dual-Attention (ADA) fusion mechanism that combines the complementary representations from the established SE and ECA channel-attention branches using a globally learned scalar fusion coefficient.
Some methods used in existing industrial vision systems have explored hybrid or dual-attention networks by combining attention mechanisms to improve feature representation. The methods have shown that various attention mechanisms can provide different spatial and channel relationships. However, the ADA method differs in that it applies a unique approach that combines parallel SE and ECA channel-attention mechanisms with a globally learned scalar fusion coefficient in a high-shot, supervised, object-aware, two-stage anomaly classification process. The proposed scalar coefficient is global, unlike the gate-based architecture, and is jointly learned with the classifier.
The complete pipeline for the proposed framework included six steps, as shown in Figure 1. In Step 1, the VisA benchmark dataset was organized according to the 2-class high-shot supervised protocol, and object category and anomaly labels were created for training. In Step 2, image preprocessing and data augmentation were performed by converting the images to RGB, resizing them, applying ImageNet normalization, randomly flipping them horizontally, slightly rotating them, and applying color jitter. In Step 3, the pretrained DenseNet-121 architecture was used to extract feature vectors from the industrial images. Due to the dense connections of the DenseNet-121 model, it can preserve both high-level semantic features and low-level texture information from the input images while enabling efficient gradient flow. After extraction, the feature vectors were refined using the Adaptive Dual-Attention (ADA) module, which employs Squeeze-and-Excitation (SE) and Efficient Channel Attention (ECA).
Step 4 comprised a hierarchical two-stage classification based on a supervised learning approach. In Stage I, object categories were determined using a multiclass classifier. Depending on the predicted label, each input image was routed to Stage II, where an object-specific anomaly detector classified it as either normal or anomalous. Owing to this hierarchical design, each Stage-II detector specializes in the defect characteristics of a single object category. Interpretability analysis and model evaluation constituted Steps 5 and 6, respectively. To ensure convergence in a class-imbalanced setting, the proposed model was trained using cross-entropy loss, the Adam optimizer, learning-rate scheduling, and early stopping. Additionally, the model was evaluated using accuracy, precision, recall, F1-score, ROC-AUC, Matthews correlation coefficient (MCC), and Cohen's kappa. Grad-CAM was used to visualize the discriminative regions in the images that contributed to the model's predictions. The proposed method integrated transfer learning, optimization, hierarchical object-aware anomaly classification, adaptive dual-attention-based feature refinement, and explainable artificial intelligence. The overall workflow of the proposed Adaptive Dual-Attention (ADA) Network is depicted in Figure 1, while detailed descriptions of all components of the approach are provided in the following paragraphs.
Dataset preparation and data description
VisA benchmark dataset
The proposed model was evaluated using the publicly available Visual Anomaly (VisA) benchmark dataset. The VisA data set consists of 10,821 high-quality color images from 12 industrial object classes: macaroni1, macaroni2, cashew, chewing gum, fryum, pipe fryum, capsules, candle, pcb1, pcb2, pcb3, and pcb4. All these object classes present various industrial products characterized by different textures, shapes, structural patterns, and defect features.
Dataset source: https://github.com/amazon-science/spot-diff?
The VisA data set includes 1,200 anomalous images and 9,621 normal images, where the anomalous images are characterized by various manufacturing defects, such as scratches, cracks, dents, missing components, discoloration, deformations, and contamination. This high diversity of object classes and defect types presents a very challenging benchmark for supervised industrial anomaly detection. In addition, the natural class imbalance of anomalous and normal samples resembles industrial inspection conditions. The official 2-class high-shot supervised protocol provided by the VisA benchmark was used to evaluate the proposed Adaptive Dual-Attention Network. This protocol allowed training on both normal and anomalous images while retaining an independent test set. The Image Distribution of the Dataset is presented in Supplementary Table 2. The summary of the VisA benchmark dataset and the corresponding label encoding used for training and evaluating the proposed Adaptive Dual-Attention Networks is presented in Supplementary Table 3. Representative Industrial sample images for each class are shown in Supplementary Figure 1.
Unlike the traditional one-class anomaly detection approach, which trains only on normal samples, the framework used the standard 2-class high-shot supervised split of the VisA dataset. According to this protocol, approximately 60% of the normal and anomalous samples for each object class were used for training, while the remaining samples were reserved for testing. The split file provided by the benchmark was used without modification for the official train/test assignment to ensure experimental reproducibility and prevent data leakage. To permit model selection without compromising the held-out evaluation data, the validation set was derived exclusively from the official training partition. All images designated as test samples in the official split file were retained unaltered and used solely for final evaluation, and a programmatic assertion verified that no test sample was reassigned. Within the official training partition, a stratified 80:20 train-validation split was performed independently for each of the 12 object categories, with stratification by anomaly label to preserve the normal-to-anomalous ratio in both subsets. For any category containing a single anomaly class, an unstratified random split was applied instead. The partition was generated using fixed random seeds (42, 123, and 2024 for the three independent runs) and exported as a CSV file. This procedure yielded 5,191 training, 1,302 validation, and 4,328 test images. In this split file, each sample has a record that includes the object class, the data split (training/testing), the anomaly label (normal/anomaly), and the image path. Such a supervised learning protocol allows the proposed framework to learn discriminative features of both normal and defective objects and compare its performance with other supervised industrial anomaly detection frameworks.
Data organization and label encoding
To create the complete training and testing datasets, the official split file was examined. The images were assigned labels based on their object class and anomaly status. Two separate target labels were generated to implement the hierarchical two-stage classification strategy.
In the initial classification stage, integer labels from 0 to 11 were used to represent the 12 industrial object categories in the VisA dataset. In the second stage, the condition labels were represented by binary values, with 0 denoting a normal object and 1 denoting an anomalous object. After the object category was identified in Stage I, the corresponding object-specific detector used these binary labels to classify the sample as normal or anomalous.
To improve data-loading efficiency, a custom PyTorch Dataset was developed to load images as needed. During network training, images were automatically converted to RGB, transformed according to the predefined preprocessing procedure, and delivered to the network through a DataLoader with mini-batch sampling, pinned memory, and parallel workers enabled. The summary of the VisA benchmark dataset and the corresponding label encoding used for training and evaluating the proposed Adaptive Dual-Attention Networks is presented in Supplementary Table 3.
Image preprocessing and data augmentation
To meet the input requirements of the pretrained DenseNet-121 network, all images were converted to RGB and resized to 224 x 224 pixels before training. The ImageNet mean and standard deviation were used for normalization. To improve generalization and reduce overfitting, data augmentation techniques, including color jittering, random rotation (±10°), and horizontal flipping, were applied exclusively to the training images. Only resizing and normalization were applied to the validation and test images. Table 1 shows the entire preparation workflow.
Feature extraction using DenseNet-121
DenseNet-121 was used as the backbone neural network because of its efficient feature reuse, reduced parameter redundancy, and robust representation-learning capabilities. ImageNet-pretrained weights were used to initialize the DenseNet-121 model for transfer learning.
The DenseNet-121 model processes each input image by utilizing the dense connection mechanism, in which all the layers have access to the feature information of all previous layers. In doing so, efficient gradient flow can be ensured, and important texture features and semantics can be learned from images, which are crucial for distinguishing normal from abnormal images. The feature maps generated by DenseNet-121 were subsequently fed into the ADA module. The feature extraction method can be represented as:
 (1)
(1)
where I denotes the input image, fDenseNet-121(⋅) represents the pretrained DenseNet-121 feature extractor, and F is the extracted deep feature representation used by the subsequent attention module.
Proposed adaptive dual-attention (ADA) module
The suggested method adds an Adaptive Dual-Attention (ADA) block, based on the DenseNet-121 architecture, to enhance the discriminative power of the derived feature maps. To find complementary dependencies between channels, the ADA block uses both the Squeeze-and-Excitation (SE) attention mechanism and Efficient Channel Attention (ECA). The ECA method finds local channel-wise relationships without any dimensional reduction, whereas the SE pathway uses feature recalibration to capture global channel-wise dependencies.
A learnable scalar fusion coefficient was incorporated into the architecture to combine the outputs of the SE and ECA branches. This coefficient, denoted α, is a single scalar value learned during training and shared globally across all input samples; it is not conditioned on or generated from individual input features. The adaptive attention operation is formulated as:
 (2)
(2)
where FSE and FECA denote the feature maps generated by the SE and ECA branches, respectively, and α = sigmoid(a) is the fusion coefficient, obtained by applying the sigmoid function to a global learnable scalar parameter a (implemented as a zero-dimensional nn.Parameter). Thus, α is a scalar shared across all channels, spatial locations, and input samples rather than a channel-wise, spatial, or input-conditioned gating vector. The sigmoid function constrains α to the range (0,1), ensuring a valid relative weighting between the two attention branches. The parameter α was initialized to 0, resulting in an initial fusion coefficient of α = 0.5, which assigned equal weight to the SE and ECA branches at the beginning of training. During optimization, α was jointly learned with the other network parameters, allowing the model to determine the relative contribution of the two attention branches. Therefore, in this work, the term adaptive refers to the learned global weighting of the complementary SE and ECA representations during training, rather than to sample-dependent gating during inference. The resulting refined feature representation FADA is subsequently forwarded to the two-stage hierarchical classification network.
Squeeze-and-excitation (SE) branch
Informative channels are strengthened, and the global reliance between channels is modeled using the SE branch. Initially, a compact channel descriptor is obtained by applying a global average pooling layer to the feature maps. To create channel attention weights, the channel descriptor is further processed with two fully connected layers in a bottleneck architecture, followed by a sigmoid activation. To adjust each channel's response and highlight valuable features while suppressing irrelevant ones, these weights are ultimately multiplied by the feature maps. The SE operation is formulated as:
 (3)
(3)
where F is the input feature map, z is the global average pooled feature vector, W1 and W2 are learnable weight matrices, δ denotes the ReLU activation function, σ(⋅) represents the sigmoid activation, and ⊙ denotes element-wise multiplication. The recalibrated feature map is further fed into the adaptive fusion block.
Branch of Efficient Channel Attention (ECA)
To capture local cross-channel interactions without significantly increasing computational complexity, the Efficient Channel Attention (ECA) branch is integrated. ECA effectively models channel dependencies while preserving feature information by directly applying a lightweight one-dimensional convolution to the global average-pooled channel descriptor, in contrast to traditional attention techniques that rely on dimensionality reduction. To improve discriminative power, a sigmoid function is applied to the generated attention weights, which are then multiplied by the input feature maps. It is well-suited for industrial anomaly detection due to its lightweight architecture, which efficiently enhances feature representation with minimal computational overhead. The ECA operation is expressed as:
 (4)
(4)
where F denotes the input feature map, z represents the globally pooled channel descriptor, Conv1D (⋅) is the one-dimensional convolution operation for local channel interaction, σ(⋅) denotes the sigmoid activation function, and ⊙ represents element-wise multiplication. The resulting feature map FECA is then forwarded to the adaptive attention fusion module.
Adaptive attention fusion mechanism
The SE and ECA feature maps are combined using the same globally learned scalar fusion coefficient α defined in Equation (2) (α = σ(a)). Rather than treating both attention outputs as equally important, this learned coefficient allows the network to weight the relative contributions of each branch. The coefficient is learned jointly with the rest of the network during training and is shared across all input samples rather than being computed per input.
As this is the same fusion operation defined in Equation (2), it is not repeated here; see Equation (2) for the exact formulation. The refined feature map FADA is subsequently forwarded to the hierarchical two-stage classification network for object recognition and anomaly detection. The fused feature representation is computed as:
 (5)
(5)
where FSE and FECA represent the feature maps generated by the SE and ECA branches, respectively, and α is a learnable gating coefficient constrained within the range [0,1]. The refined feature map FADA is subsequently forwarded to the hierarchical two-stage classification network for object recognition and anomaly detection.
Hierarchical two-stage classification
The designed structure follows a hierarchical two-phase classification scheme to enhance the efficiency of anomaly detection in industry. Rather than classifying all object-defect pairs with a single classifier, the classification process is carried out in two sequential phases. The network uses the adaptive attention-based feature extracted from the data to classify the object class in the first phase. The second phase determines whether the sample falls into the normal or anomalous category by selecting the appropriate classifier for the object class based on the first phase's prediction. The two-stage prediction process is expressed as:
 (6)
(6)
 (7)
(7)
where FADA represents the refined feature map generated by the Adaptive Dual-Attention module, Po(⋅) denotes the object classification network, yo is the predicted object category, Pa(yo)(⋅) represents the corresponding object-specific anomaly classifier, and ya denotes the final anomaly prediction. Figure 2 shows the general hierarchical two-stage classification approach used in the suggested framework.
Stage I: object classification
At this point, the improved feature representation from the ADA module is used to classify the object category. Because the ADA module operates channel-wise, the refined feature map FADA retains the spatial dimensions of the DenseNet-121 output (7 x 7 x 1024). It is therefore reduced to a feature vector by global average pooling over the spatial dimensions before classification:
 c = 1, 2, ..., C (8)
where H = W = 7, C = 1024, and z is the resulting 1024-dimensional pooled feature vector. A fully connected classification layer with a softmax activation function is then applied to z, producing one of the 12 classes in the VisA dataset. Each sample can be directed to the appropriate anomaly classifier once an accurate object classification is complete. The object classification is formulated as:
 (9)
(9)
 (10)
(10)
where FADA denotes the refined feature vector, Wo and bo represent the learnable weights and bias of the object classifier, po is the probability distribution over the object categories, and yo is the predicted object label. The predicted object class is then used to activate the corresponding anomaly detection model in Stage II.
Stage II: object-specific anomaly detection
A softmax classification layer, which is similar in structure to the Stage I object classifier but limited to the two anomaly classes (Normal, Anomaly), is used to predict anomalies:
 (11)
(11)
 (12)
(12)
where FADA denotes the refined feature representation, Wa(yo) and ba(yo) are the learnable parameters of the two-class object-specific anomaly classifier corresponding to the predicted object category yo, pa(yo) is the resulting probability distribution over {Normal, Anomaly}, and ya denotes the final anomaly prediction, with 0 indicating a normal sample and 1 indicating an anomalous sample. During Stage-II training, samples were routed using the ground-truth object categories, so that each object-specific classifier was trained on a correctly assigned subset. During inference, the predicted Stage I object label was used to route each image to its corresponding object-specific Stage II classifier; therefore, the reported end-to-end performance incorporated any Stage I routing errors.
Inference strategy
During inference, each input image was first passed through the DenseNet-121 backbone and the Adaptive Dual-Attention (ADA) module. The Stage I classifier first predicted the object category, and this predicted category was then used to select the corresponding object-specific Stage II classifier, which classified the image as normal or anomalous. This hierarchical classification approach improves accuracy by making anomaly detection class-based. Because Stage I achieved 100% accuracy on the evaluated split, the Stage II results obtained per object category coincided with those obtained through Stage-I-routed inference; no Stage I routing errors were observed in the reported evaluation. The final prediction is represented as:
 (13)
(13)
where yo denotes the predicted object category and ya represents the corresponding anomaly status (Normal or Anomaly). The proposed hierarchical inference approach enables efficient implementation of anomaly detection in industrial settings.
Loss function
To train both stages of the hierarchical framework, weighted cross-entropy loss was used. Unlike a jointly optimized multitask objective, the two stages were trained independently and sequentially. The object classification network (Stage I) was first trained to convergence using multiclass weighted cross-entropy loss, after which a separate object-specific anomaly classifier (Stage II) was trained for each object category using its own weighted cross-entropy loss. The stage-wise loss functions are defined as:
 (14)
(14)
 (15)
(15)
where Lobj is the weighted cross-entropy loss for the Stage I object classifier, Lanom(yo) is the weighted cross-entropy loss for the object-specific Stage II anomaly classifier corresponding to the predicted object category yo, and wa,i, wa,i are inverse-frequency class weights computed separately for each stage. Training each stage independently allows the object-specific anomaly classifiers to specialize on the defect characteristics of their respective object category without being constrained by a shared multi-task objective.
Optimization strategy
The proposed Adaptive Dual-Attention Network was trained using the Adam optimizer. The learning rate was adaptively adjusted using the ReduceLROnPlateau scheduler, which reduced it whenever the monitored validation macro F1-score did not improve. An early-stopping mechanism halted training when the monitored validation F1-score showed no improvement for four consecutive validation epochs. The parameter update at each iteration is expressed as:
 (16)
(16)
where θt denotes the model parameters at iteration t, η is the learning rate, and ∇L(θt) represents the gradient of the loss function. This kind of optimization enables stable convergence and improved generalization for the proposed approach in industry-based anomaly detection problems.
Algorithm 1. Proposed adaptive dual-attention networks for high-shot supervised two-stage industrial anomaly detection
Input: VisA benchmark dataset (official 2-class high-shot supervised split)
Output: Predicted object class Yo and Ya anomaly class
- Load the VisA benchmark dataset.
- Read the official high-shot supervised split file.
- Sort the pictures into sets for testing, validation, and training.
- Use the pre-established object mapping to assign object labels.
- Assign anomaly labels (Normal = 0, Anomaly = 1).
- Convert all images to RGB format.
- Resize images to 224 x 224 pixels.
- Normalize images using the ImageNet mean and standard deviation.
- Apply data augmentation to the training photos, including color jitter, random rotation, and random horizontal flipping.
- Initialize the DenseNet-121 backbone with ImageNet-pretrained weights.
- Extract deep feature representations from the input images.
- Generate channel attention using the Branch of Squeeze-and-Excitation (SE).
- Generate channel attention using the Branch Efficient Channel Attention (ECA).
- Fuse the SE and ECA feature maps using the proposed learned global scalar fusion coefficient α = σ(a) (Equation 2).
- Generate the refined feature representation using the Adaptive Dual-Attention (ADA) module.
- Initialize the object classification network using the refined ADA feature representation.
- Train the Stage I object classifier using multi-class weighted cross-entropy loss.
- Use the Adam optimizer to update the Stage I network parameters.
- Adjust the Stage I learning rate using the ReduceLROnPlateau scheduler.
- Apply early stopping to Stage I based on validation F1-score.
- Repeat Stage I training until convergence and save the best-performing Stage I model.
- For each ground-truth object category, initialize a separate two-class (Normal/Anomaly) softmax classifier.
- Train each object-specific Stage II classifier independently using its own weighted cross-entropy loss.
- Update each Stage II classifier's parameters using the Adam optimizer.
- Adjust each Stage II classifier's learning rate using its own ReduceLROnPlateau scheduler.
- Apply early stopping to each Stage II classifier based on validation F1-score.
- Repeat until all object-specific Stage II classifiers converge and save the best-performing model for each.
- Use Accuracy, Precision, Recall, F1-score, ROC-AUC, MCC, Cohen's Kappa, and Confusion Matrix to assess the trained model.
- Generate Grad-CAM visualizations to interpret the model predictions.
- Return the predicted object class and anomaly detection result.
End Algorithm
Algorithm 1 summarizes the implementation of the proposed Adaptive Dual-Attention Network for High-Shot Supervised Two-Stage Industrial Anomaly Detection. The workflow included data preparation and preprocessing, DenseNet-121-based feature extraction using ImageNet-pretrained weights, adaptive feature enhancement using the proposed ADA module incorporating SE and ECA, two-stage hierarchical classification, optimization using weighted cross-entropy loss and the Adam optimizer, and performance evaluation using accuracy, precision, recall, F1-score, ROC-AUC, MCC, Cohen's kappa, and Grad-CAM visualizations.
Results
Experimental setup
The Adaptive Dual-Attention Network for High-Shot Supervised Two-Stage Industrial Anomaly Detection was implemented in Python using PyTorch. The experiments were carried out on the VisA benchmark dataset, which was split according to the official 2-class high-shot supervised split. To prevent leakage in the model selection, the official training partition was additionally split into training and validation partitions, while the official non-training partition remained untouched as a holdout test set. Consequently, the used dataset included 5,191 training samples, 1,302 validation samples, and 4,328 test samples. The training set was used for optimization, the validation set was used solely for learning-rate scheduling, checkpoint selection, and early stopping, and the holdout test set was used only for final performance evaluation.
The proposed Adaptive Dual-Attention (ADA) block integrates features extracted by the DenseNet-121 backbone, initialized with pre-trained ImageNet weights, using Squeeze-and-Excitation (SE) and Efficient Channel Attention (ECA). The Ada feature representation is obtained via a global scalar fusion coefficient that balances the contributions of the SE and ECA feature representations. This coefficient is shared across input samples and is used by the hierarchical two-stage classification pipeline to first detect the product category and then classify each sample as either normal or anomalous.
The proposed architecture was optimized using the Adam optimizer with the initial learning rate of 1 x 10⁻4. Adaptive learning-rate scheduling was implemented using the ReduceLROnPlateau scheduler with a reduction factor of 0.5 and a patience of 2 epochs, while the validation macro F1-score was used as the monitoring criterion. The early stopping strategy was applied after four consecutive validations with no improvement in the validation macro F1-score, and the best-performing checkpoint was saved. The holdout test partition was not used for learning-rate scheduling, early stopping, checkpoint selection, and hyperparameter optimization.
The input images were resized to 224 x 224 pixels and normalized according to the ImageNet mean and standard deviation. During the training stage, random rotation of ±10°, horizontal flip, and color jitter data augmentations were used, while resizing and ImageNet normalization were applied to validation and test images. Weighted cross-entropy loss was used for optimization to handle class imbalance.
To address the VisA dataset task, the Stage-I classifier was optimized to recognize 12 object categories, while object-specific Stage-II classifiers were further trained to detect normal and anomalous samples for each category. During the inference phase, the predicted category from Stage I was used to route each sample to its corresponding Stage-II classifier. Final performance metrics were reported using the holdout test partition after applying all model selections on the validation partition. Experiments were carried out on a workstation with Windows 11 OS, Intel Core processor, and NVIDIA GeForce RTX 4050 Laptop GPU with 6 GB VRAM. More implementation details and the hyperparameters used are provided in Table 2.
Evaluation metrics
Several quantitative criteria are used to evaluate the classification performance of the suggested Adaptive Dual-Attention Networks for High-Shot Supervised Two-Stage Industrial Anomaly Detection algorithm. These measures capture several aspects of prediction performance, including label consistency, handling of imbalanced classes, accuracy, and class-wise discrimination. Accuracy, Precision, Recall, F1-score, Receiver Operating Characteristic-Area Under the Curve (ROC-AUC), Matthews Correlation Coefficient (MCC), and Cohen's Kappa are the evaluation measures. Additionally, Grad-CAM visualization is used to qualitatively analyze the model's decision-making process, and the Confusion Matrix is used to assess class-wise prediction performance. The mathematical formulation of the evaluation metrics is as follows:
Accuracy
The percentage of samples that are correctly classified out of all samples is called accuracy.
 (17)
(17)
where
TP = True Positives
TN = True Negatives
FP = False Positives
FN = False Negatives
Precision
Precision is the ratio of the correctly identified positive samples to the total number of predicted positives.
 (18)
(18)
Recall
The percentage of accurately detected positives among all actual positives is known as recall.
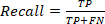 (19)
(19)
F1-score
The F1-Score uses the harmonic mean of Precision and Recall to assess categorization ability. When assessing classification performance, the F1-Score is particularly useful in class-imbalanced datasets.
 (20)
(20)
An increased F1 score suggests a better classification performance.
ROC-AUC
Based on the ratio of True Positive Rate (TPR) to False Positive Rate (FPR), the ROC-AUC statistic assesses the classifier's capacity for discriminating.
 (21)
(21)
 (22)
(22)
A higher ROC-AUC value indicates that the suggested system can distinguish between distinct classes more effectively.
Matthews Correlation Coefficient (MCC)
Every value in the confusion matrix is taken into consideration by MCC.
 (23)
(23)
Cohen's Kappa
After accounting for random agreement, Cohen's Kappa statistics evaluate the agreement between expected and actual classes.
 (24)
(24)
where Po represents the observed agreement and Pe denotes the expected agreement by chance.
Quantitative results
This section presents the quantitative results obtained for the developed Adaptive Dual-Attention Network for High-Shot Supervised Two-Stage Industrial Anomaly Detection on the VisA benchmark dataset. The hierarchical framework was evaluated against three criteria: object classification, anomaly detection, and two-stage classification results.
Stage I object classification results
In the first stage of the proposed model, the primary aim is to detect object categories before anomaly detection. Using the discriminative features captured by the ImageNet-pretrained DenseNet-121 network and then improved by the newly developed Adaptive Dual Attention (ADA) block, the model correctly identified all 12 object categories in the VisA dataset.
The Stage I confusion matrix is presented in Supplementary Figure 2, and the quantitative data are shown in Table 3. The accuracy, precision, recall, f1-score, ROC-AUC, Matthews correlation coefficient (MCC), and Cohen's Kappa scores of the suggested model were all 100%. From these results, one can conclude that the categories of objects differ markedly in their shapes, textures, and structures and are thus highly distinguishable. Moreover, using ImageNet transfer makes the backbone network's job much easier, as it enables it to capture the semantic features of objects; therefore, recognizing them becomes much easier. Thus, the object prediction in Stage I is highly reliable.
Stage II anomaly detection results
The Stage II anomaly detection model's performance metrics are presented in Table 4 as macro averages, and the confusion matrix is shown in Figure 3 with class-based analysis. Across the twelve industrial object categories, the model achieved a mean accuracy of 96.26 ± 0.92% over three independent runs. The values reported below correspond to the representative run with seed 42, from which Figure 3 and Figure 5 were generated. Based on the confusion matrix, this run achieved 97.11% accuracy, 92.84% macro precision, 92.45% macro recall, and 92.64% macro F1-score. The ROC curve showed an AUC of 98.00%. The MCC and Cohen's kappa were both approximately 0.8529, indicating strong agreement between the ground-truth and predicted labels. The two coefficients were computed independently and agreed to four decimal places in this run, as confirmed by their divergence in the remaining reported runs.
Training performance analysis
Stage I training performance
The training curves in Supplementary Figure 3 show the training and validation accuracies and losses for the Stage I object classifier, respectively. During the early epochs, convergence occurs quickly, with training and validation accuracy reaching 100% and loss values dropping to nearly zero. This indicates strong consistency in the learning process, as the training and validation curves show little difference. Such behavior is natural, as the visual differences between the object classes in the VisA dataset can be easily learned by the model.
Stage II training performance
The training and validation accuracy curves, along with the loss curves, of the object-specific anomaly detection models at Stage II are shown in Figure 4A,B, averaged across the twelve object-specific classifiers. As the graphs show, training accuracy and loss improve consistently across epochs, whereas validation accuracy and loss fluctuate in later epochs rather than following a strictly monotonic trend. This fluctuation is why checkpoint selection is performed using the monitored validation F1-score rather than relying on the final epoch, and the use of the Adam optimizer, ReduceLROnPlateau scheduler, and early stopping helps limit overfitting despite it.
ROC curve analysis
The suggested hierarchical two-stage model's discriminatory power is evaluated using the ROC curves. ROC curve analysis is used to assess classification performance in the first stage of object classification, and for object-specific anomalies in the second stage.
Stage I ROC analysis
The ROC plot for the Stage I item classification model is shown in Supplementary Figure 4. It is positioned in the upper-left section of the ROC plot, demonstrating its strong capacity to distinguish among the twelve item categories employed. The ROC-AUC for this model was 100%, indicating that the DenseNet-121 backbone and the newly designed Adaptive Dual Attention (ADA) module learned discriminative representations effectively. The reason for this performance is the unique visual features of the objects in the VisA dataset and the effective use of ImageNet-based transfer learning.
Stage II ROC analysis
Figure 5 shows the ROC curve for the object-specific anomaly detection model at Stage II. The curve's proximity to the upper-left section demonstrates a strong capacity to distinguish between typical and abnormal occurrences. The developed model achieved an ROC-AUC score of 98.00% on seed 42, thereby establishing itself as an excellent tool for detecting industrial defects. The ROC-AUC score demonstrates the effectiveness of the proposed Adaptive Dual Attention network in developing defect-sensitive feature representations. From the analysis of the results provided in Table 5, one can observe that the proposed methodology achieves good performance across all object categories under consideration; however, the anomaly discrimination difficulty is varied among categories based on the visual characteristics of the objects and defect patterns.
Comparison with SOTA models
The performance of the introduced Adaptive Dual-Attention (ADA) Network for High-Shot Supervised Two-Stage Industrial Anomaly Detection was evaluated on the VisA benchmark dataset against representative methods in industrial anomaly detection, including EfficientAD + SegAD, DevNet, and ConvNeXt-Tiny. The evaluation was conducted using popular classification metrics, including accuracy, precision, recall, F1 score, and ROC-AUC, as shown in Table 6.
The results show that the proposed ADA Network performs best among the compared approaches on all five evaluation metrics. In seed 42, the proposed framework achieves an accuracy of 97.11%, while DevNet reaches 96.71%, EfficientAD + SegAD gets 96.43%, and ConvNeXt-Tiny attains 95.12%. Furthermore, the proposed approach reaches the highest precision, recall, and F1-score of 92.84%, 92.45%, and 92.64%, respectively. Moreover, the proposed framework achieves an ROC-AUC score of 98.00%, indicating strong discriminative power in distinguishing between normal and anomalous samples. Dense121 achieves 95.28% accuracy, which is slightly lower than the proposed model.
Such improvements can be explained using the proposed Adaptive Dual-Attention (ADA) module in conjunction with the DenseNet-121 architecture. The proposed framework exploits the complementarities between the feature representations of the SE and ECA mechanisms, thereby enhancing the discriminative power of representations for industrial images. In addition, the hierarchical two-stage approach helps separate object identification and object-specific anomaly detection, avoiding confusion when processing them simultaneously.
Compared with EfficientAD + SegAD, the proposed framework improves accuracy from 96.43% to 97.11%, precision from 90.21% to 92.84%, F1-score from 91.11% to 92.64%, and ROC-AUC from 97.62% to 98.00%. Compared to DevNet, the proposed framework improves accuracy from 96.71% to 97.11%, precision from 90.23% to 92.84%, F1-score from 91.02% to 92.64%, and ROC-AUC from 97.69% to 98.00%. The improvements in the performance metrics of the proposed framework against ConvNeXt-Tiny are even greater.
Ablation study
First, an ablation study was conducted to assess the efficiency of the proposed Adaptive Dual-Attention (ADA) module by comparing it with other well-known channel-attention methods: Squeeze-and-Excitation (SE) and Efficient Channel Attention (ECA). The experiment was conducted by using the same DenseNet-121 backbone, training strategy, hyperparameter tuning, and VisA dataset. Two single-stage configurations and two two-stage configurations were examined to more closely investigate the hierarchical nature of the introduced anomaly detection framework.
According to Table 7, the two-stage configurations outperformed their single-stage counterparts, thereby demonstrating the value of the object-specific hierarchical anomaly detection strategy. In the SE configuration, the two-stage architecture achieves 96.23% accuracy, compared to 84.34% for the single-stage approach. Similarly, the two-stage ECA configuration achieves 96.13% accuracy, compared to 83.53% for the single-stage model. This effect is also observable in the F1-score, which increases from 80.24% to 91.81% for SE and from 79.39% to 91.88% for ECA. These results suggests that separating object recognition from object-specific anomaly classification allows for better discrimination between normal and anomalous samples.
The suggested ADA two-stage configuration achieves the best overall performance: 97.11% accuracy, 92.84% precision, 92.45% recall, 92.64% F1-score, and 98.00% ROC-AUC. These results are better than the two-stage SE configuration: 96.23% of accuracy, 92.81% of precision, 91.88% of recall, 91.81% of F1-score, and 97.26% of ROC-AUC, and the two-stage ECA configuration: 96.13% of accuracy, 91.06% of precision, 91.74% of recall, 91.88% of F1-score, and 97.22% of ROC-AUC.
Moreover, the comparison demonstrates the advantage of the proposed ADA fusion in balancing precision and recall. While the two-stage SE model achieves a recall of 91.88% and a precision of 92.81%, the proposed ADA increases recall to 92.45% while maintaining slightly higher precision at 92.84%. The ECA model has a recall of 91.74%, but its precision of 91.06% is lower than that of the SE and ADA models. Thus, the learned fusion of the complementary SE and ECA representations improves the balance in anomaly classification.
The agreement-based metrics also confirm the effectiveness of the suggested configuration. The two-stage ADA model achieves the highest MCC (0.8529) and Cohen's Kappa (0.8529), compared to 0.8466 and 0.8413 for SE, and 0.8479 and 0.8476 for ECA, respectively. Thus, the improvement of agreement between the predicted and ground-truth anomaly labels is observed for the suggested framework.
In summary, the ablation results confirm two complementary contributions. First, the comparison of the single-stage and two-stage configurations confirms the value of the hierarchical object-specific anomaly detection strategy. Second, among the two-stage configurations, ADA consistently delivers the highest overall performance compared with the individual SE and ECA attention mechanisms. Thus, the results confirm the effectiveness of the proposed ADA approach, which combines the complementary feature-recalibration characteristics of SE and ECA via a learned scalar fusion mechanism within the two-stage industrial anomaly detection framework.
Grad-CAM visualization
The obtained Grad-CAM visualizations for the proposed framework are shown in Figure 6. These visualizations provide qualitative interpretability of the image regions that most influenced the model's prediction, rather than quantitative defect localization, since no localization metric (e.g., AUROC, PRO, IoU, or pointing-game accuracy) was computed. As can be seen, the produced activation maps tend to concentrate on the defective parts of the industrial objects with comparatively less emphasis on background regions. In normal samples, the activation map is distributed around the characteristic object structures, excluding irrelevant background, whereas in anomalous cases, the highlighted region visually overlaps with the defect area.
By combining the local channel-wise attention computed by the ECA block with the global context information provided by the SE branch, the proposed Adaptive Dual-Attention (ADA) block enhances the feature representation used for prediction. The resulting Grad-CAM visualizations qualitatively suggest that the network attends to regions associated with contaminations, cracks, scratches, and structural distortions, though this observation is based on visual inspection rather than a quantitative localization metric. The suggested framework provides both predictive performance on the evaluated benchmark and qualitative visual explanations for its predictions, which can support the interpretability of automated industrial inspection decisions.
Statistical analysis
To assess the robustness and consistency of the proposed Adaptive Dual-Attention Network (ADA-Net), the Stage-II anomaly detection experiment was conducted independently with three predefined random seeds: 42, 123, and 2024. The same training, validation, and held-out test partitions were maintained across all three experimental runs to ensure a consistent evaluation protocol. In each run, the proposed ADA-Net configuration was trained independently using the corresponding random seed. The performance was evaluated using accuracy, precision, recall, F1 Score, ROC AUC, Matthews Correlation Coefficient (MCC), and Cohen's Kappa.
The results obtained from the three independent runs were summarized using the mean and standard deviation (SD). The mean represents the average performance across the three runs, whereas the standard deviation indicates the variability associated with stochastic training effects. The proposed framework achieved an average accuracy of 96.26 ± 0.92%, precision of 91.86 ± 0.96%, recall of 91.34 ± 0.99%, and F1-score of 91.65 ± 0.90%. The average ROC-AUC was 97.55 ± 0.56%, demonstrating strong discrimination between normal and anomalous samples across the three experimental runs. The obtained MCC was 0.8453 ± 0.0070, and Cohen's Kappa was 0.8443 ± 0.0075. The results from the three independent runs are summarized as mean ± standard deviation in Table 8.
The relatively small standard deviations across the three seeds indicate that the proposed framework maintains consistent performance under different stochastic training conditions. In particular, the standard deviations of 0.0070 for MCC and 0.0075 for Cohen's Kappa indicate low variability in agreement-based performance across the three runs.
The three-seed evaluation demonstrated consistent Stage-II anomaly detection performance for ADA-Net, with an average F1-score of 91.65 ± 0.90% and ROC-AUC of 97.55 ± 0.56% across seeds 42, 123, and 2024. Because corresponding matched-seed results were not obtained for the SE and ECA configurations, the statistical significance of the differences between these models was not assessed.
Data Availability:
The data used in this study were obtained from publicly available repositories. The Amazon Visual Anomaly (VisA) dataset can be accessed through the Amazon Science Spot-Diff repository (https://github.com/amazon-science/spot-diff) and the corresponding AWS S3 resource (arn:aws:s3:::amazon-visual-anomaly/VisA_20220922.tar). The dataset is available under the Creative Commons Attribution 4.0 International (CC BY 4.0) license. The data related to this study are also available on Zenodo at https://doi.org/10.5281/zenodo.22008252.
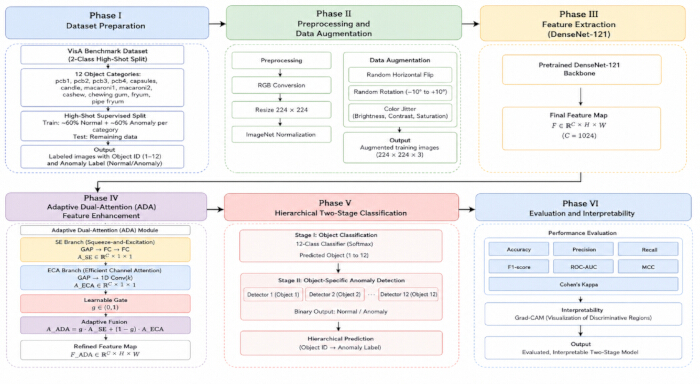
Figure 1. Workflow of the proposed industrial anomaly detection framework. Schematic overview of the workflow, including dataset preparation, image preprocessing and data augmentation, feature extraction using the pretrained DenseNet-121 backbone, Adaptive Dual-Attention feature refinement, Stage I object classification, and Stage II object-specific anomaly detection. Please click here to view a larger version of this figure.
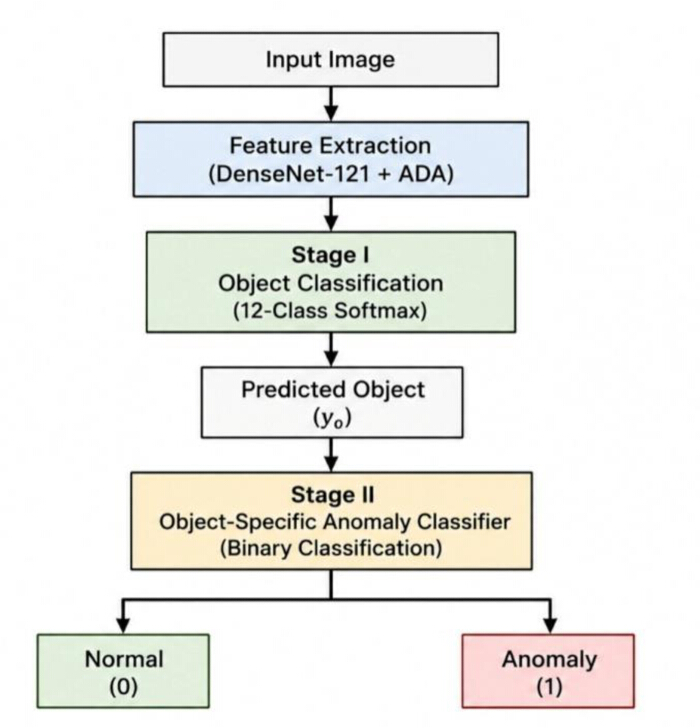
Figure 2. Hierarchical two-stage classification framework. The input image is processed using DenseNet-121 with Adaptive Dual-Attention feature extraction. Stage I predicts one of the 12 object categories, and the predicted object category routes the image to the corresponding Stage II binary classifier for classification as normal (0) or anomalous (1). Please click here to view a larger version of this figure.
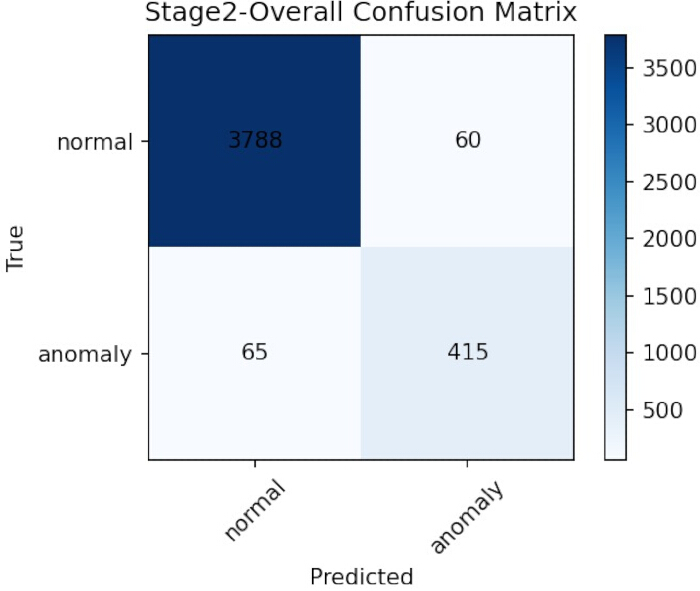
Figure 3. Overall confusion matrix for Stage II anomaly detection. Confusion matrix showing the classification of normal and anomalous samples by the object-specific Stage II anomaly detection framework, with true labels represented by rows and predicted labels represented by columns. Please click here to view a larger version of this figure.
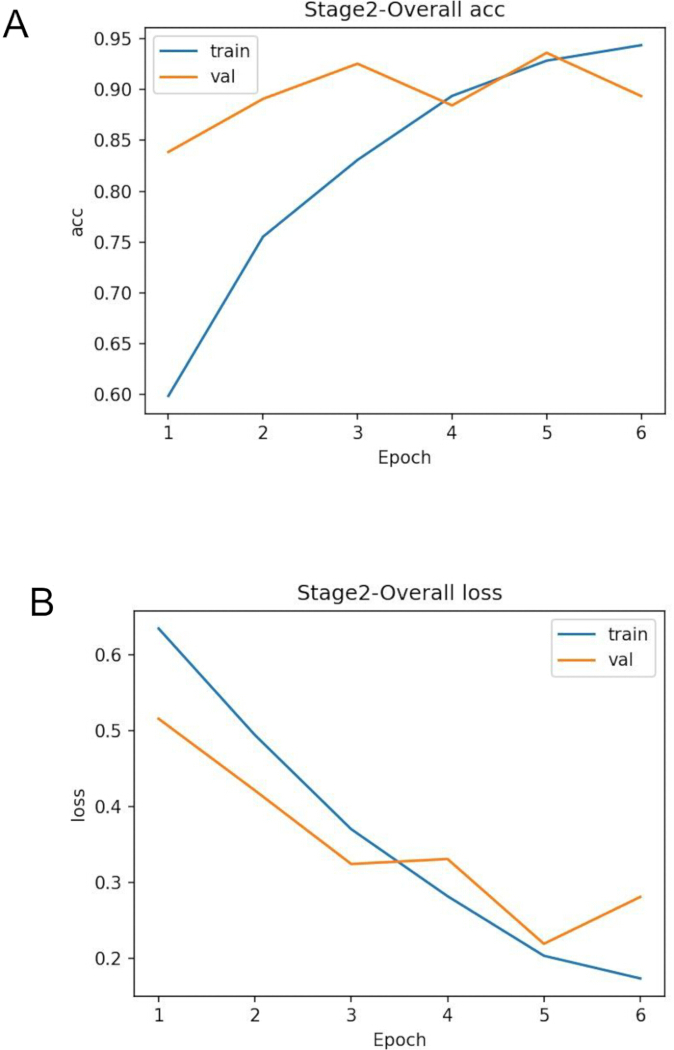
Figure 4. Training performance of the Stage II anomaly detection models. (A) Training and validation accuracy across six epochs. (B) Training and validation loss across six epochs. The curves represent the overall training behavior of the object-specific Stage II classifiers. Please click here to view a larger version of this figure.
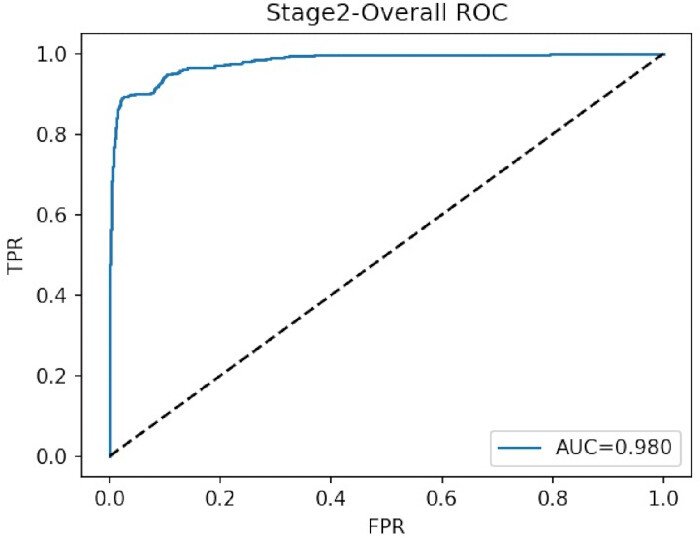
Figure 5. Receiver operating characteristic curve for Stage II anomaly detection. Overall receiver operating characteristic (ROC) curve showing the true-positive rate against the false-positive rate for Stage II classification of normal and anomalous samples; the displayed area under the curve (AUC) is 0.980. Please click here to view a larger version of this figure.
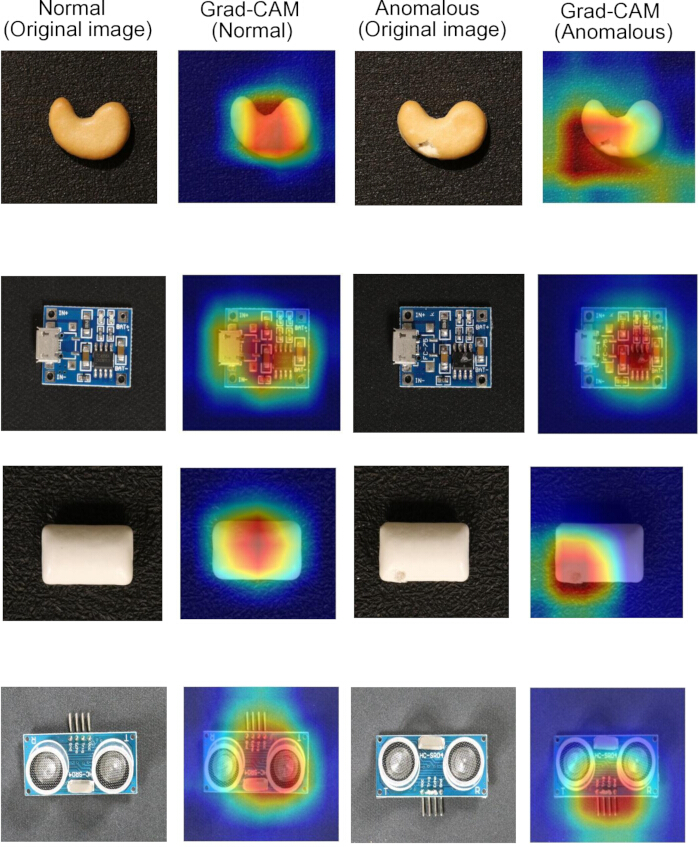
Figure 6. Grad-CAM visualization of Stage II anomaly detection. Representative normal and anomalous samples from selected VisA object categories are shown alongside their corresponding Gradient-weighted Class Activation Mapping (Grad-CAM) heatmaps, illustrating the image regions that contribute to the model's predictions. Please click here to view a larger version of this figure.
Supplementary Figure 1. Representative images from the VisA benchmark dataset. Representative samples illustrate the visual characteristics of the object categories used to train and evaluate the proposed anomaly detection framework. Please click here to download this file.
Supplementary Figure 2. Confusion matrix for Stage I object classification. Confusion matrix showing true and predicted labels for the 12 VisA object categories in the Stage I classifier. Please click here to download this file.
Supplementary Figure 3. Training performance of the Stage I object classification model. (A) Training and validation accuracy across five epochs. (B) Training and validation loss across five epochs, showing convergence of the Stage I object classifier. Please click here to download this file.
Supplementary Figure 4. Receiver operating characteristic curves for Stage I object classification. Class-wise receiver operating characteristic (ROC) curves for the 12 VisA object categories, with an area under the curve (AUC) of 1.000 for each category. Please click here to download this file.
| Operation | Training | Testing |
| RGB Conversion | Used | Used |
| Resize (224 × 224) | Used | Used |
| Random Horizontal Flip | Used | Not Used |
| Random Rotation (±10°) | Used | Not Used |
| Color Jitter | Used | Not Used |
| Tensor Conversion | Used | Used |
| ImageNet Normalization | Used | Used |
Table 1: Image preprocessing and data augmentation techniques used in the study. The preprocessing operations applied to the training and testing datasets are summarized, including image resizing, augmentation, tensor conversion, and ImageNet normalization.
| Parameter | Value |
| Programming Language | Python |
| Deep Learning Framework | PyTorch |
| Operating System | Windows 11 |
| GPU | NVIDIA GeForce RTX 4050 Laptop GPU (6 GB) |
| Backbone Network | DenseNet-121 (ImageNet Pretrained) |
| Input Image Size | 224 × 224 |
| Optimizer | Adam |
| Learning Rate Scheduler | ReduceLROnPlateau |
| Loss Function | Weighted Cross-Entropy Loss |
| Batch Size | 64 |
| Number of Epochs | 15 |
| Early Stopping | Enabled |
| Data Augmentation | Rotation (±10°), Horizontal Flip, Color Jitter |
| Evaluation Dataset | VisA (Official High-Shot Supervised Split) |
Table 2: Experimental setup and hyperparameter settings. The software environment, hardware configuration, model architecture, optimization settings, training parameters, and evaluation dataset used to develop the proposed ADA Network are summarized.
| Metric | Value (%) |
| Accuracy | 100 |
| Precision | 100 |
| Recall | 100 |
| F1-score | 100 |
| ROC-AUC | 100 |
| MCC | 1 |
| Cohen's Kappa | 1 |
Table 3: Performance of the proposed Stage I object classification model on the VisA benchmark dataset. Overall classification performance is reported using accuracy, precision, recall, F1-score, ROC-AUC, Matthews correlation coefficient (MCC), and Cohen's kappa.
| Metric | Value |
| Accuracy | 97.11% |
| Precision | 92.84% |
| Recall | 92.45% |
| F1-score | 92.64% |
| ROC-AUC | 98.00% |
| MCC | 0.8529 |
| Cohen's Kappa | 0.8529 |
Table 4: Performance of the proposed Stage II object-specific anomaly detection model. Overall anomaly classification performance is reported using accuracy, precision, recall, F1-score, ROC-AUC, MCC, and Cohen's kappa.
| Object | Accuracy (%) | Precision (%) | Recall (%) | F1-score (%) | ROC-AUC (%) | MCC | Kappa |
| Candle | 98.2 | 99 | 90 | 93.9 | 99.8 | 0.886 | 0.879 |
| Capsules | 90.4 | 81.4 | 76.7 | 78.7 | 89.6 | 0.579 | 0.576 |
| Cashew | 93.8 | 87 | 93.2 | 89.7 | 99.3 | 0.8 | 0.794 |
| Chewinggum | 97.1 | 96.1 | 93.3 | 94.6 | 98.8 | 0.893 | 0.892 |
| Fryum | 98.3 | 99 | 95 | 96.9 | 99.4 | 0.939 | 0.938 |
| Macaroni1 | 98.4 | 97.8 | 92.4 | 94.9 | 99.8 | 0.9 | 0.898 |
| Macaroni2 | 95.5 | 95.5 | 76.1 | 82.6 | 94.5 | 0.689 | 0.655 |
| PCB1 | 97.5 | 94.7 | 89.6 | 92 | 99.6 | 0.842 | 0.84 |
| PCB2 | 97.5 | 97.2 | 87.4 | 91.6 | 98.1 | 0.84 | 0.832 |
| PCB3 | 95.7 | 85.4 | 90.9 | 87.9 | 98.4 | 0.761 | 0.758 |
| PCB4 | 98.9 | 97.1 | 96 | 96.5 | 99.9 | 0.931 | 0.93 |
| Pipe Fryum | 98.8 | 99.3 | 96.3 | 97.7 | 99.6 | 0.955 | 0.954 |
Table 5: Category-wise performance of the proposed Stage II object-specific anomaly detection model. Performance across the 12 VisA object categories is reported using accuracy, precision, recall, F1-score, ROC-AUC, MCC, and Cohen's kappa.
| Method | Dataset | Accuracy (%) | Precision (%) | Recall (%) | F1-score (%) | ROC-AUC (%) |
| EfficientAD + SegAD | VisA | 96.43 | 90.21 | 92.14 | 91.11 | 97.62 |
| DevNet | VisA | 96.71 | 90.23 | 92.17 | 91.02 | 97.69 |
| ConvNeXt-Tiny | VisA | 95.12 | 89.31 | 90.12 | 89.13 | 96.53 |
| Proposed ADA Network | VisA | 97.11 | 92.84 | 92.45 | 92.64 | 98.00 |
Table 6: Comparison of the proposed ADA Network with representative anomaly detection approaches. Performance on the VisA dataset is compared using accuracy, precision, recall, F1-score, and ROC-AUC.
| Attention Module | Accuracy (%) | Precision (%) | Recall (%) | F1-score (%) | ROC-AUC (%) | MCC | Cohen's Kappa |
| DenseNet 121+SE ( Two Stage) | 96.23 | 92.81 | 91.88 | 91.81 | 97.26 | 0.8466 | 0.8413 |
| Densenet 121+SE (Single Stage) | 84.34 | 81.38 | 80.43 | 80.24 | 90.32 | 0.7936 | 0.7849 |
| Densenet 121+ECA ( Two Stage) | 96.13 | 91.06 | 91.74 | 91.88 | 97.22 | 0.8479 | 0.8476 |
| ECA (Single Stage) | 83.53 | 80.93 | 79.24 | 79.39 | 90.01 | 0.7753 | 0.7794 |
| Densenet 121+ADA (Proposed-multistage) | 97.11 | 92.84 | 92.45 | 92.64 | 98 | 0.8529 | 0.8529 |
Table 7: Ablation analysis of the attention mechanisms and classification strategies. Single-stage and two-stage configurations employing Squeeze-and-Excitation (SE), Efficient Channel Attention (ECA), and the proposed Adaptive Dual-Attention (ADA) approach are compared based on classification performance metrics.
| Metric | Seed 42 | Seed 123 | Seed 2024 | Mean ± SD |
| Accuracy (%) | 97.11 | 96.39 | 95.29 | 96.26 ± 0.92 |
| Precision (%) | 92.84 | 91.82 | 90.93 | 91.86 ± 0.96 |
| Recall (%) | 92.45 | 91.01 | 90.56 | 91.34 ± 0.99 |
| F1-score (%) | 92.64 | 91.44 | 90.87 | 91.65 ± 0.90 |
| ROC-AUC (%) | 98 | 97.72 | 96.92 | 97.55 ± 0.56 |
| MCC | 0.8529 | 0.8439 | 0.8392 | 0.8453 ± 0.0070 |
| Cohen's Kappa | 0.8529 | 0.8407 | 0.8392 | 0.8443 ± 0.0075 |
Table 8: Three-seed statistical performance of the proposed ADA Network. Performance across random seeds 42, 123, and 2024 is reported together with the mean ± standard deviation for each evaluation metric.
Supplementary Table 1. Comparison of recent industrial defect and anomaly detection methods. Representative published approaches are compared based on their methodologies, main contributions, strengths, and limitations relative to the proposed ADA Network. Please click here to download this file.
Supplementary Table 2. Distribution of images across the VisA object categories. The number of images in each of the 12 object categories and the total number of images in the VisA dataset are reported. Please click here to download this file.
Supplementary Table 3. Overview of the VisA benchmark dataset used in this study. The dataset composition, object categories, class definitions, label encoding, training protocol, image type, and classification task are summarized. Please click here to download this file.
Discussion
The experimental results of the present study demonstrated the effectiveness of the proposed framework on the evaluated VisA benchmark. In Stage I, the object classification model achieved 100% accuracy, indicating it successfully distinguished among the 12 object categories in the test set. In Stage II, the object-specific anomaly detection model achieved 97.11% accuracy, 92.84% precision, 92.45% recall, 92.64% F1-score, and 98.00% ROC-AUC. The ablation study further showed that the ADA configuration outperformed the individual SE and ECA attention configurations on this benchmark. These findings suggest that the learned scalar fusion of complementary SE and ECA representations is beneficial for anomaly classification. In addition, the Grad-CAM visualizations provided qualitative interpretability by highlighting image regions that contributed to the model predictions. Collectively, these findings indicate that the proposed framework provides accurate anomaly classification with qualitative interpretability on the evaluated VisA benchmark.
Stage II represents a more challenging classification task because the model must distinguish anomalous patterns from normal variations within the same object category. Despite this challenge, the proposed model maintained strong anomaly discrimination. The MCC and Cohen’s kappa values of 0.8529 further indicate good agreement between the predicted and ground-truth anomaly labels. The category-wise results also demonstrate that anomaly detection performance varies across VisA object categories, which may reflect differences in object appearance, defect characteristics, and visual similarity between normal and anomalous samples. The ablation results suggest that combining SE and ECA representations via learned scalar fusion can improve performance over the individual attention configurations evaluated in this study. The two-stage structure may also facilitate anomaly classification by separating object identification from object-specific defect detection, thereby allowing Stage II classifiers to focus on anomaly characteristics specific to individual object categories.
The evaluation across three independent random seeds provides additional information regarding the stability of the proposed ADA-Net configuration. Across seeds 42, 123, and 2024, the framework achieved an average accuracy of 96.26% ± 0.92%, precision of 91.86% ± 0.96%, recall of 91.34% ± 0.99%, F1-score of 91.65% ± 0.90%, and ROC-AUC of 97.55% ± 0.56%. The corresponding MCC and Cohen’s kappa values were 0.8453 ± 0.0070 and 0.8443 ± 0.0075, respectively. The relatively small variation across these runs suggests that ADA-Net's performance is reasonably consistent under different stochastic training conditions. However, these repeated-seed results demonstrate the stability of the proposed configuration rather than statistical superiority over the alternative attention configurations.
Several limitations should be considered when interpreting these findings. First, the study was evaluated on a single benchmark dataset using a high-shot supervised setting. Therefore, broader generalization to other industrial datasets, production environments, object types, defect characteristics, and imaging conditions remains unverified. Second, although repeated-seed evaluation was performed for ADA-Net, equivalent matched-seed experiments were not available for the SE and ECA configurations. Consequently, the statistical superiority of ADA-Net over these alternative attention configurations cannot be established from the current experiments. Third, computational complexity, inference latency, memory consumption, and deployment performance were not quantitatively evaluated. These factors are particularly relevant when considering implementation in real-time industrial inspection systems or resource-constrained devices. Furthermore, although Grad-CAM provided qualitative information on the image regions contributing to the model's predictions, localization performance was not quantitatively evaluated against pixel-level defect annotations. Therefore, the Grad-CAM findings should be interpreted as qualitative evidence of model interpretability rather than quantitative validation of defect localization.
Future studies could evaluate the proposed framework on larger and more diverse industrial anomaly detection datasets and under real-world production conditions to determine its generalizability across different object categories, defect types, acquisition systems, and environmental conditions. Extensions to few-shot, semi-supervised, or unsupervised anomaly detection could also be investigated when annotated defect samples are limited. In addition, transformer-based representations and other feature-extraction architectures could be evaluated to determine whether they provide complementary improvements to the proposed attention and hierarchical classification strategy. Model compression approaches, including pruning and quantization, could be investigated together with quantitative measurements of inference latency, memory requirements, and computational cost to assess suitability for resource-constrained and edge-deployment settings. The integration of multimodal inspection data could also be explored to determine whether information from multiple sensing modalities improves anomaly detection performance. These extensions should be validated experimentally before conclusions are drawn regarding computational efficiency, real-time performance, generalizability, or broader industrial deployment capabilities.
Disclosures
The authors have no conflicts of interest.
Acknowledgements
The author acknowledges the academic support and research environment provided by the Polytechnic and Agricultural College, Zhangjiajie College, which contributed to the completion of this study.
Funding:
This work was supported by the Scientific Research Project of Hunan Provincial Department of Education (24A0772).
Materials
| Name | Company | Catalog Number | Comments |
|---|---|---|---|
| Adam Optimizer | PyTorch | N/A | Optimizer used for network training. Version/Specification: torch.optim.Adam; hyperparameters reported in manuscript Resource identifier: torch.optim.Adam Product/resource URL: https://pytorch.org/docs/stable/generated/torch.optim.Adam.html |
| Adaptive Dual-Attention (ADA) Module | Custom Implementation | N/A | Proposed module combining Efficient Channel Attention (ECA) and Squeeze-and-Excitation (SE). Custom component developed in this study. Version/Specification: Custom ADA module combining ECA and SE attention Resource identifier: Custom implementation; no catalog number Manufacturer/organization: Developed in this study |
| Cross-Entropy Loss | PyTorch | N/A | Loss function used for object classification and anomaly detection. Version/Specification: torch.nn.CrossEntropyLoss Resource identifier: torch.nn.CrossEntropyLoss Product/resource URL: https://pytorch.org/docs/stable/generated/torch.nn.CrossEntropyLoss.html |
| CUDA Toolkit | NVIDIA | Version 11.x or later | GPU acceleration for model training and inference. Version/Specification: CUDA Toolkit 11.8 Resource identifier: CUDA 11.8 Product/resource URL: https://developer.nvidia.com/cuda-11-8-0-download-archive |
| DenseNet-121 | Torchvision | N/A | Pre-trained convolutional neural network backbone for feature extraction. Version/Specification: DenseNet-121; ImageNet-pretrained backbone Resource identifier: torchvision.models.densenet121 Product/resource URL: https://pytorch.org/vision/stable/models/generated/torchvision.models.densenet121.html Manufacturer/organization: PyTorch Torchvision |
| Efficient Channel Attention (ECA) | Custom Implementation | N/A | Channel attention mechanism integrated into the ADA module. Version/Specification: ECA attention block implemented in PyTorch Resource identifier: Custom implementation; no catalog number Manufacturer/organization: Custom implementation |
| Grad-CAM | Custom/PyTorch Implementation | N/A | Visualization method for model interpretability. Version/Specification: Grad-CAM implemented for model interpretability Resource identifier: Custom implementation; no catalog number Manufacturer/organization: Custom/PyTorch implementation |
| Matplotlib | Matplotlib Development Team | Version 3.x | Visualization of training curves and Grad-CAM results. Version/Specification: Version not recorded in supplied materials; Matplotlib 3.x API used Resource identifier: matplotlib Product/resource URL: https://matplotlib.org/ |
| NumPy | NumPy Developers | Version 1.x | Numerical computations. Version/Specification: Version not recorded in supplied materials; NumPy 1.x/2.x compatible API used Resource identifier: numpy Product/resource URL: https://numpy.org/ |
| NVIDIA CUDA Driver | NVIDIA | Compatible with CUDA version | Required for GPU computation. Version/Specification: CUDA 11.8-compatible driver; exact driver build not recorded in supplied materials Resource identifier: NVIDIA CUDA driver Product/resource URL: https://www.nvidia.com/Download/index.aspx |
| NVIDIA GPU | NVIDIA | RTX Series (or used GPU) | Hardware accelerator used for deep learning experiments. Version/Specification: NVIDIA GeForce RTX 4050 Laptop GPU; 6 GB class VRAM (6140 MiB reported) Resource identifier: GeForce RTX 4050 Laptop GPU Product/resource URL: https://www.nvidia.com/en-us/geforce/laptops/40-series/ |
| OpenCV | OpenCV | Version 4.x | Image loading and preprocessing. Version/Specification: Version not recorded in supplied materials; OpenCV 4.x API used Resource identifier: opencv-python Product/resource URL: https://opencv.org/ |
| Pandas | Pandas Development Team | Version 2.x | Dataset handling and result analysis. Version/Specification: Version not recorded in supplied materials; pandas 2.x API used Resource identifier: pandas Product/resource URL: https://pandas.pydata.org/ |
| Python | Python Software Foundation | Version 3.10 (or used version) | Programming language used for implementation. Version/Specification: Python 3.10 Resource identifier: CPython 3.10 Product/resource URL: https://www.python.org/downloads/release/python-3100/ |
| PyTorch | PyTorch Foundation | Version 2.x | Deep learning framework used for model development and training. Version/Specification: PyTorch 2.7.1+cu118 Resource identifier: torch==2.7.1+cu118 Product/resource URL: https://pytorch.org/ |
| Scikit-learn | Scikit-learn Developers | Version 1.x | Performance evaluation metrics including Accuracy, Precision, Recall, F1-score, ROC-AUC, and confusion matrix. Version/Specification: Version not recorded in supplied materials; scikit-learn 1.x API used Resource identifier: scikit-learn Product/resource URL: https://scikit-learn.org/ Manufacturer/organization: scikit-learn Developers |
| Squeeze-and-Excitation (SE) Block | Custom Implementation | N/A | Feature recalibration mechanism integrated into the ADA module. Version/Specification: SE attention block implemented in PyTorch Resource identifier: Custom implementation; no catalog number Manufacturer/organization: Custom implementation |
| Torchvision | PyTorch Foundation | Version 0.x | Pre-trained DenseNet-121 model and image preprocessing utilities. Version/Specification: Torchvision 0.22.1 Resource identifier: torchvision==0.22.1 Product/resource URL: https://pytorch.org/vision/0.22/ |
| VisA Benchmark Dataset | Amazon Science | N/A | Public industrial anomaly detection dataset containing 12 object categories with normal and anomalous samples. Version/Specification: VisA 20220922; 10,821 images; 12 object categories Resource identifier: VisA_20220922.tar Product/resource URL: https://registry.opendata.aws/visa/ Manufacturer/organization: Amazon Science / AWS Open Data |
References
- Chen Q, et al. Center-aware residual anomaly synthesis for multiclass industrial anomaly detection. IEEE Trans Ind Inform. 2025;21(9):7276-86. doi:10.1109/TII.2025.3575122.
- Li Z, Ge Y, Meng L. A multi-scale information fusion framework with interaction-aware global attention for industrial vision anomaly detection and localization. Inf Fusion. 2025;124:103356. doi:10.1016/j.inffus.2025.103356.
- Wang C, et al. M3DM-NR: RGB-3D noisy-resistant industrial anomaly detection via multimodal denoising. IEEE Trans Pattern Anal Mach Intell. 2025;47(11). doi:10.1109/TPAMI.2025.3592089.
- Chen Z, Xie X, Yang L, Lai JH. Hard-normal example-aware template mutual matching for industrial anomaly detection. Int J Comput Vis. 2025;133(5):2927-49. doi:10.1007/s11263-024-02323-0.
- Semitela A, et al. Improving industrial quality control: a transfer learning approach to surface defect detection. Sensors. 2025;25(2):527. doi:10.3390/s25020527.
- Lyu S. A computer vision model for industrial product surface inspection using unsupervised learning and few-shot learning [dissertation]. Hong Kong: The Hong Kong Polytechnic University; 2025. Available from: https://theses.lib.polyu.edu.hk/handle/200/13828
- Tong X, et al. DAM-Faster RCNN: few-shot defect detection method for wood based on dual attention mechanism. Sci Rep. 2025;15(1):22860. doi:10.1038/s41598-025-05479-y.
- Shi K, et al. FSPDD: a double-branch attention guided network for few-shot PCB defect detection. Multimed Tools Appl. 2025;84(19):21345-71. doi:10.1007/s11042-024-19893-3.
- Chen K, Zhou X, Ren J. DLF-YOLO: a dynamic synergy attention-guided lightweight framework for few-shot clothing trademark defect detection. Electronics. 2025;14(11):2113. doi:10.3390/electronics14112113.
- Qiao Q, Hu H, Ahmad A, Wang K. A review of metal surface defect detection technologies in industrial applications. IEEE Access. 2025;13:48380-400. doi:10.1109/ACCESS.2025.3544578.
- Jin Y, et al. Dual-interrelated diffusion model for few-shot anomaly image generation. In: Proceedings of the IEEE/CVF Conference on Computer Vision and Pattern Recognition; 2025. p. 30420-9. Available from: https://arxiv.org/abs/2408.13509
- Yang T, et al. A survey on foundation-model-based industrial defect detection [preprint]. arXiv. 2025. Available from: https://arxiv.org/abs/2502.19106
- Lyu S, et al. MVREC: a general few-shot defect classification model using multi-view region-context. In: Proceedings of the AAAI Conference on Artificial Intelligence; 2025. 39(6):5937-45. Available from: https://doi.org/10.1609/aaai.v39i6.32634
- Ma H, et al. ReMP-AD: retrieval-enhanced multi-modal prompt fusion for few-shot industrial visual anomaly detection. In: Proceedings of the IEEE/CVF International Conference on Computer Vision; 2025. p. 20425-34. Available from: https://doi.org/10.1109/ICCV55890.2025.01149
- Li Y, et al. FIND: few-shot anomaly inspection with normal-only multi-modal data. In: Proceedings of the IEEE/CVF International Conference on Computer Vision; 2025. p. 23290-9. Available from: https://doi.org/10.1109/ICCV51701.2025.02162
- Gu Z, et al. UniVAD: a training-free unified model for few-shot visual anomaly detection. In: Proceedings of the Computer Vision and Pattern Recognition Conference; 2025. p. 15194-203.
- Damm S, Laszkiewicz M, Lederer J, Fischer A. AnomalyDINO: boosting patch-based few-shot anomaly detection with DINOv2. In: Proceedings of the IEEE/CVF Winter Conference on Applications of Computer Vision; 2025. p. 1319-29. Available from: https://arxiv.org/abs/2405.14529
- Zhai G, et al. Foundation visual encoders are secretly few-shot anomaly detectors [preprint]. arXiv. 2025. Available from: https://arxiv.org/abs/2510.01934
- Megahed FM, et al. Adapting OpenAI's CLIP model for few-shot image inspection in manufacturing quality control: an expository case study with multiple application examples. J Qual Technol. 2026:1-27.
- Ilani MA, Banad YM. TransMatch: a transfer-learning framework for defect detection in laser powder bed fusion additive manufacturing [preprint]. arXiv. 2025. Available from: https://arxiv.org/abs/2509.01754
- Wang X, et al. DSG-FSOD: a few-shot object detection method based on deformable convolutions and attention integration. Complex Intell Syst. 2026;12(1):21. doi:10.1007/s40747-025-02131-0.
- Mothkur R, et al. AgroQuali-FSL: a few-shot deep learning framework with QualiProtoNet for automated quality grading of fruits and vegetables. Sci Rep. 2026. doi:10.1038/s41598-026-52715-0.
- Yang E, et al. 3CAD: a large-scale real-world 3C product dataset for unsupervised anomaly detection. In: Proceedings of the AAAI Conference on Artificial Intelligence; 2025. 39(9):9175-83. Available from: https://arxiv.org/abs/2502.05761
- Su Y, He R, Liu Y, Tian J. Surface defect detection method based on few-shot learning. Inf Control. 2025;54(3):502-12. doi:10.13976/j.cnki.xk.2024.4085.
- Ge Y, Li Z, Meng L. YOLO-MSD: a robust industrial surface defect detection model via multi-scale feature fusion. Appl Intell. 2025;55(12):840. doi:10.1007/s10489-025-06739-0.
- Gu K, et al. Infrared image quality estimation with node-to-graph regression. IEEE Trans Multimedia. 2026;28:2238-52. doi:10.1109/TMM.2026.3651047.
- Chen J, et al. 3D surface highlight removal method based on detection mask. Arab J Sci Eng. 2025;51:5977-89. doi:10.1007/s13369-025-10573-4.
- Xu H, Xu Y, Hu K. A vision-based inspection system for pharmaceutical production line. J Supercomput. 2025;81(4):625. doi:10.1007/s11227-025-07135-8.
- Zhu Y, et al. A crack detection and quantification framework for high-resolution images using Mamba and unmanned devices. Comput Aided Civ Infrastruct Eng. 2025;40(29):5672-97. doi:10.1111/mice.70118.
- Zhu M, Gong Y, Gu D, Tian C. Improving 3D object detection in neural radiance fields with channel attention. CAAI Trans Intell Technol. 2025:1446-58. doi:10.1049/cit2.70045.
- Lin Y, et al. Exploring inter-domain Wasserstein metric for adaptive object detection. IEEE Trans Multimedia. 2026;28:6616-26. doi:10.1109/TMM.2026.3668648.
- Wang Z, et al. Building façade delamination quantification framework based on infrared instance segmentation and dual-modality vision calibration. Adv Eng Inform. 2026;71:104341. doi:10.1016/j.aei.2026.104341.
- Wang F, et al. DABF-Net: a dual-branch attention-guided and bi-directional feature enhancement network for infrared small-target detection with air-to-ground benchmark. IEEE Trans Geosci Remote Sens. 2025;63:5005014. doi:10.1109/TGRS.2025.3586362.
- Wang W, Li L, Liu H. Multi-target workpiece geometric dimension measurement system based on image analysis. Adv Mech Eng. 2026;18(4):1709858889. doi:10.1177/16878132261445705.
- He Y, et al. SWS-YOLO: an energy-efficient spiking neural network for water-surface object detection. Neurocomputing. 2026;696:134066. doi:10.1016/j.neucom.2026.134066.
- He Y, et al. Quantitative evaluation of thermal camera thermal sensitivity and spatial resolution on internal defect detection in CFRP using laser thermography. IEEE Trans Instrum Meas. 2026. doi:10.1109/TIM.2026.3704085.
- Qin Z, et al. MeSIF-Net: multi-level cross-scale information fusion via knowledge distillation for low-resolution industrial surface defect detection. Inf Fusion. 2026;136:104508. doi:10.1016/j.inffus.2026.104508.
- Chi Y, et al. MAGSE-ResNet50: a deep learning approach for railway sandy ballast fouling detection. Measurement. 2026;282:122023. doi:10.1016/j.measurement.2026.122023.
- Ge X, et al. An efficient feature aggregation network for urban road damage detection using street-view images. Comput Aided Civ Infrastruct Eng. 2026;50:100110. doi:10.1016/j.cacaie.2026.100110.