This protocol describes an optimized single‑thoracotomy mouse model for myocardial ischemia‑reperfusion injury. The model uses a pull-out carbon‑synthetic fishing line after ischemia, which enables avoiding a second thoracotomy, minimizing surgical trauma, and ensuring good reproducibility.
Method Article
Establishment and Optimization of a Mouse Model of Myocardial Ischemia-Reperfusion Injury
* These authors contributed equally
In This Article
Summary
Abstract
Myocardial ischemia-reperfusion injury (MIRI) severely impairs cardiac prognosis after revascularization for acute myocardial infarction. Standardized mouse left anterior descending coronary artery (LAD) ligation models are widely used for MIRI research, yet conventional protocols rely on indwelling support tubes and secondary thoracotomy to restore reperfusion. Such procedures feature complicated operations, high risks of pneumothorax, severe thoracic trauma, and low batch modeling efficiency. To address these drawbacks, we established an optimized MIRI mouse model with a single thoracotomy and carbon-synthesis fishing line pull-out for reperfusion. Male C57BL/6 mice aged 6–8 weeks were divided into normal control (NC), traditional model (TM), and optimized model (OM) groups. Echocardiography, triphenyltetrazolium chloride (TTC) and hematoxylin-eosin (HE) staining, as well as serum inflammatory cytokines, lactate dehydrogenase (LDH), c-reactive protein (CRP), and myocardial injury marker cardiac troponin I (cTnI) levels were detected to compare modeling efficacy. Identical cardiac function, serum inflammatory cytokines, myocardial injury marker, infarct size, and myocardial pathological morphology changes were observed between TM and OM groups. The OM group displayed more homogeneous infarct regions and higher serum myocardial injury markers and cardiac function injury, indicating milder non-surgical trauma. Compared with the traditional method, this optimized procedure shortens surgical and anesthesia time, avoids fatal intraoperative pneumothorax, accelerates post-operative recovery, and improves animal survival. In conclusion, the optimized model produces equivalent MIRI lesions with higher safety, efficiency, and reproducibility. It serves as an ideal alternative to classic modeling approaches.
Introduction
Acute myocardial infarction is one of the cardiovascular diseases with the highest mortality worldwide1. Timely recanalization of occluded blood vessels to restore blood supply to ischemic tissue is the core clinical treatment. However, reperfusion induces myocardial ischemia-reperfusion injury (MIRI), activates oxidative stress and inflammatory pathways2,3, causes additional cardiomyocyte apoptosis and persistent cardiac damage, and seriously affects the long-term prognosis of patients4. Profound research of the pathogenesis of MIRI, evaluation of cardioprotective drugs, and screening of intervention targets all depend on standardized animal models with stable phenotypes, low trauma, and high survival rates. Laboratory mice have a short breeding cycle, mature gene editing technology, and low experimental costs, so they are the preferred experimental animals for in vivo research on MIRI.
The existing traditional modeling method for mouse MIRI requires thoracotomy to place a supporting pad tube5,6. The left anterior descending coronary artery (LAD) is ligated to induce ischemia, followed by a second thoracotomy to take out the tube and restore blood flow for reperfusion7. Although this method can establish myocardial ischemia-reperfusion injury, it has certain limitations. During ischemia maintenance, mice need continuous mechanical ventilation connected to a ventilator8, leading to cumbersome operations and low efficiency of batch model construction. Moreover, the second thoracotomy during reperfusion may puncture the pleura and cause pneumothorax, reducing animal survival rates. Repeated thoracotomy brings extra mechanical trauma to the chest and lungs, which may interfere with test results related to myocardial injury. Recent advanced intervention research further highlights the necessity of establishing a standardized, low-confounding MIRI model to accurately evaluate targeted therapeutic effects: studies have confirmed that neuromodulation and copper chelation can reverse sleep fragmentation-aggravated MIRI by targeting NET-induced endothelial cuproptosis, and reactive oxygen species (ROS)-responsive lutein nanoassemblies can also exert cardioprotective effects by improving mitochondrial function. Both of these targeted intervention paradigms require an MIRI modeling system that can minimize non-specific surgical trauma and unrelated experimental interference, to avoid masking or misjudging the true therapeutic effect of the tested interventions9,10. Therefore, this study urgently needs to optimize the modeling process and develop an improved model with simple operations, low trauma, and stable infarct phenotypes.
Based on the traditional LAD ligation modeling principle, this study optimizes surgical procedures to establish an improved mouse MIRI model using carbon-synthesis fishing line ligation, eliminating the need for secondary thoracotomy. Three experimental groups are set: normal control group (NC), traditional model group (TM), and optimized model group (OM). Two modeling methods are evaluated via echocardiography, triphenyltetrazolium chloride (TTC) infarct staining, hematoxylin-eosin (HE) myocardial staining, as well as serum inflammatory cytokines lactate dehydrogenase (LDH), c-reactive protein (CRP), and myocardial injury marker cardiac troponin I (cTnI)11. This study aims to verify that the improved model can induce equivalent myocardial ischemic injury compared with the traditional model. Meanwhile, it simplifies surgical operations, improves model efficiency, avoids fatal intraoperative complications such as pneumothorax, and accelerates the postoperative recovery of mice. It provides a standardized animal model with higher safety, higher operational efficiency, and better reproducibility for research on MIRI mechanisms and drug screening.
Protocol
All protocols were approved by the Animal Research Ethics Board of the Institute of Basic Theory for Traditional Chinese Medicine, China Academy of Medical Sciences (Ethical approval number is IBTCMCACMS-2611010). To avoid confounding effects arising from sex or genetic background, the study was restricted to male C57BL/6J mice; in addition, all individuals were balanced for age and weight to guarantee equivalent starting conditions. For survival operations, the aseptic principle must be followed, and the surgical procedures must be strictly standardized.
1. Animal preparation
- Remove food and water from the cages 12 h before the procedure to reduce the hazard of pulmonary aspiration.
- Sterilize all surgical instruments beforehand in a high-pressure steam autoclave.
- Anesthetize a male C57BL/6J mouse (age: 6–8 weeks; weight: 20–22 g) using 3% isoflurane delivered with 1 L/min oxygen inside an induction chamber for 3 min.
NOTE: Confirm the depth of anesthesia in the mouse by the absence of a withdrawal response to a firm toe pinch. - Connect a small animal ventilator to the gas anesthesia machine. Immediately intubate animals after anesthesia induction and connect them to the small animal ventilator.
- Set ventilator parameters as follows: tidal volume of 0.6 mL, respiratory rate of 110 breaths/min, inspiratory-to-expiratory ratio of 30: 70, and zero end-expiratory pressure. Set the peak inspiratory pressure alarm threshold at 50 cm H2O, and monitor the peak inspiratory pressure continuously during surgery.
- Position the anesthetized mouse supine with limbs secured, and place electrocardiogram (ECG) leads for continuous monitoring of cardiac electrical activity.
- Cut carbon-synthetic fishing line (1 mm diameter) into 3 cm-length segments.
2. Surgery procedure
- Following anesthesia, position the mouse supine on the operating board, securing the head and limbs with adhesive tape. Shave the fur over the neck and left anterior chest with an animal shaver, and swab the surgical field with iodophor disinfectant.
- Make a longitudinal skin incision along the midline of the neck using ophthalmic scissors.
- Separate the cervical muscles with ophthalmic forceps and expose the trachea.
NOTE: Bluntly dissect muscles and soft tissues gently to avoid excessive thyroid gland hemorrhage during this procedure. - After exposing the trachea, make a small incision in the anterior wall of the trachea between the 2nd and 3rd tracheal rings using ophthalmic scissors, and insert a tracheal tube to maintain airway patency.
- Connect the ventilator tube to the anesthesia machine, and confirm the correct intubation by observing the synchronized chest movements with the ventilator. Place the ECG electrodes on the limbs of the mouse and connect the mouse to the ECG recorder.
- Separate the underlying pectoralis muscles using ophthalmic forceps and scissors.
- Using microsurgical scissors, make an incision along the natural angle of the ribs at the 3rd and 4th intercostal spaces. Take care not to damage the heart and lungs. Also, do not cut too close to the sternum to avoid bleeding.
- Remove the pericardium and fat, and locate the LAD artery that extends from the edge of the left atrium to the apex of the heart.
- Use curved forceps to gently separate the ribs, and press the right side of the mouse’s ribcage with the ring finger to displace the heart leftward for a better view of the left ventricle. If necessary, place a cotton ball moistened with 0.9% NaCl into the thoracic cavity to protect the lungs.
- Thread and form a loop with 7-0 absorbable suture, 1–2 mm below the left atrial appendage. Ligate the left anterior descending (LAD) coronary artery and the carbon-synthesis fishing line together using the 7-0 suture. The lower left ventricle turns blanch, and the ST-segment elevation in the ECG monitoring confirms the successful ligation of the LAD.
- Remove the cotton ball to restore lung expansion. After evacuating air from the thoracic cavity, suture the ribs with 6-0 absorbable suture, and reduce the isoflurane concentration to 1%.
- Suture the chest muscles, skin, and neck skin layer by layer.
- Switch off the isoflurane supply. Keep the mouse ventilated for oxygen support during the ischemia period. Gradually decrease the tidal volume and monitor the emergence of rhythmic, rapid shallow breathing upon the return of spontaneous breathing, then remove the tracheal intubation.
- Place the mouse in a flat cage without bedding material to prevent the fish line from being scraped off after regaining consciousness.
- After 45 min of ischemia, gently pull out the fishing line to restore reperfusion.
NOTE: Pull the free end of the fishing line slowly and steadily at a constant speed within 2–3 s. Avoid excessive force to prevent suture dislodgement or coronary artery injury.
3. Echocardiography assessment
- Perform echocardiography at baseline (before surgery) and 24 h after myocardial reperfusion to assess cardiac function.
- Anesthetize the mouse by intraperitoneal injection of 2.5% tribromoethanol.
- Fix the mouse in the supine position on a dedicated platform, and remove chest hair to ensure complete skin exposure.
- Acquire M-mode echocardiographic images from the left ventricular long-axis view using an animal ultrasound diagnostic system.
- Measure the following parameters: left ventricular ejection fraction (LVEF), fractional shortening (FS), left ventricular end-diastolic diameter (LVIDd), and left ventricular end-systolic dimension (LVIDs).
- Select three representative cardiac cycles for analysis, and calculate average values for each mouse.
- Perform all echocardiography measurements by a blinded operator12,13.
4. Serum biomarker measurement
- After the echocardiography assessment, collect blood samples via orbital enucleation and euthanize the mice by cervical dislocation.
- Allow blood samples to clot at room temperature for 1 h, then centrifuge at 1000 × g (4 °C) for 15 min. Carefully collect and aliquot the supernatant serum, and store at -80 °C until further analysis. Strictly avoid repeated freeze-thaw cycles.
- Measure serum levels of lactate dehydrogenase (LDH) using an automated bioanalyzer with a commercial reagent kit following the manufacturer's instructions. Mix 75 µL of serum sample with 225 µL of ultrapure water, then run the assay on the bioanalyzer.
- Measure serum levels of C-reactive protein (CRP), and cardiac troponin I (cTnI) using commercially available enzyme-linked immunosorbent assay (ELISA) kits according to the manufacturer’s instructions.
- CRP assay:
- Add 100 µL of 80,000-fold diluted serum or serially diluted standards per well and incubate at 37 °C for 2 h. Wash the plate, then add 100 µL of biotinylated anti-mouse CRP detection antibody and incubate at 37 °C for 1 h.
- Wash again, add 100 µL of horseradish peroxidase (HRP)-avidin conjugate, and incubate at 37 °C for 40 min. Add 100 µL of 3,3',5,5'-tetramethylbenzidine (TMB) substrate and incubate at room temperature in the dark for 15 min.
- Stop the reaction with 100 µL of stop solution and immediately read absorbance at 450 nm. Construct an optical density (OD)-concentration standard curve and interpolate sample CRP concentrations (micrograms/milliliter).
- Run all samples and standards in duplicate; subtract blank values and apply dilution factors.
- Calculate the final concentration with the following equation: Final concentration = Measured concentration × Dilution factor.
- cTnI assay:
- Add 100 µL of serum or serially-diluted standards per well and incubate at 37 °C for 90 min.
- Wash the plate, then add 100 µL of biotinylated anti-mouse cTnI detection antibody and incubate at 37 °C for 1 h. Wash again, add 100 µL of HRP-avidin conjugate, and incubate at 37 °C for 30 min.
- Add 90 µL of TMB substrate and incubate at room temperature in the dark for 15 min.
- Stop the reaction with 50 µL of stop solution and immediately read absorbance at 450 nm.
- Construct an OD-concentration standard curve to interpolate sample cTnI concentrations (picograms/milliliter).
- Run all samples and standards in duplicate and subtract blank values to calculate the final concentration.
- CRP assay:
5. Detection of myocardial infarct size
- Perfuse the heart with pre-cooled 30 mM KCl solution to arrest the heart in diastole, then harvest and rinse thoroughly with saline.
- Freeze the heart at -40 °C for 8 min to harden the tissue.
- Cut the frozen heart into five transverse slices of approximately 1 mm thickness.
- Incubate slices in 2% triphenyltetrazolium chloride (TTC) solution at 37 °C for 20 min, followed by fixation in 4% paraformaldehyde for 24 h.
- Photograph the stained sections using a digital camera.
- Quantify infarct area using image analysis software (e.g., Image-Pro Plus). Define the infarct size as the ratio of infarct (TTC-unstained pale) zones to total left ventricular area14.
6. Pathological morphology assessment
- Harvest the heart and fix it in 4% paraformaldehyde overnight at room temperature.
- Embed fixed tissues in paraffin for histopathological examination.
- Section paraffin-embedded tissues into 4 µm-thick slices.
- Deparaffinize sections in xylene, rehydrate through graded ethanol, and stain with hematoxylin and eosin (HE).
- Visualize images under an optical microscope at ×200 magnification.
7. Statistical analysis
- Perform all statistical analyses using an appropriate statistical analysis software (e.g., GraphPad Prism 10.1.2).
- Present results as mean ± standard deviation (SD).
- For normally distributed data with homogeneous variances, use an independent samples t-test for comparisons between two groups.
- For comparisons among multiple groups, use one-way analysis of variance (ANOVA) followed by Dunnett’s t-test for pairwise comparisons.
Results
Cardiac function changes
After 24 h of reperfusion, assess cardiac function using a small animal ultrasound diagnostic system. As shown in Figure 1, compared with the NC group, both TM (traditional model) and OM (optimized model) groups exhibit restricted left ventricular wall motion, a significant decrease in LVEF (P < 0.001 for both) and FS (P < 0.0001 for both), a significant increase in LVIDd in the TM group (P < 0.05) and LVIDs (P < 0.001 and P < 0.01, respectively). Compared with the TM group, there is no significant difference in the OM group among these parameters (P > 0.05). These results indicate that both TM and OM groups induce comparable cardiac functional impairment.
Serum myocardial injury marker and inflammatory cytokines level changes
After 24 h of reperfusion, measure serum levels of the myocardial injury markers LDH and cTnI, as well as the inflammatory mediator CRP. As shown in Figure 2, compared with the NC group, the TM group exhibits significantly elevated LDH, CRP, and cTnI levels (P < 0.01, P < 0.01, and P < 0.05, respectively). The OM group only shows a significantly increased cTnI level (P < 0.0001) compared to the NC group. Furthermore, compared with the TM group, the OM group shows significantly increased cTnI level (P < 0.05). Analysis based on the above results shows that there are no significant differences in LDH and CRP between the two model groups, which may stem from the non-specificity of these biomarkers. LDH can be released from multiple tissues damaged by surgical manipulation15, and CRP reflects systemic inflammatory response to surgical trauma16,17, which is comparable between single and double thoracotomy procedures. In contrast, cTnI is a highly cardiac-specific biomarker that sensitively reflects the extent of ischemic myocardial damage18. The OM group exhibited higher cTnI levels, which is consistent with the results achieved by single thoracotomy using a fishing line to fix the ligation position and precisely control the ischemia duration. This approach avoids errors such as incomplete ischemia and delayed reperfusion that may occur during re-thoracotomy in TM, indicating that this optimized model can induce more uniform and sufficient myocardial reperfusion injury.
Infarct size evaluation
As shown in Figure 3, mice that undergo either traditional or optimized MIRI procedures develop myocardial infarction. Compared with the NC group, the infarct size was 28% in the TM group and 32% in the OM group (P < 0.0001 for both). The OM group shows a slightly larger infarct size than the TM group, but the difference is not statistically significant (P > 0.05).
Pathological morphology changes
After 24 h of reperfusion, assess cardiac pathological injury by HE staining. As shown in Figure 4, the NC group exhibits normal myocardial structure and morphology, with orderly arranged muscle fibers. Compared with the NC group, both TM and OM groups show enlarged left ventricles, local tissue edema, extensive necrosis in multiple regions, inflammatory cell infiltration, and markedly aggravated disruption of myocardial fibers.
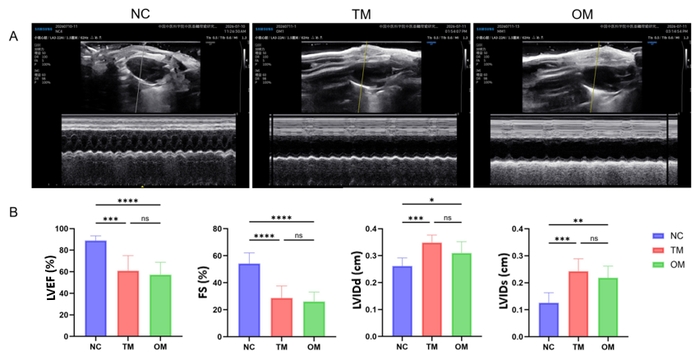
Figure 1: Cardiac function in mice subjected to ischemia/reperfusion (I/R) injury. (A) Representative M‑mode echocardiographic tracings of the left ventricle. (B) Quantitative comparisons of LVEF, FS, LVIDd, and LVIDs among the NC, TM, and OM groups. Both TM and OM groups display marked cardiac functional impairment relative to the NC group, while all four functional parameters remain comparable between the two model groups, indicating equivalent degrees of I/R-induced cardiac injury produced by the two surgical approaches (n = 7; NC group vs. TM, OM groups; TM group vs. OM group; ns, P > 0.05; **, P < 0.01; ***, P < 0.001; ****, P < 0.0001). Please click here to view a larger version of this figure.
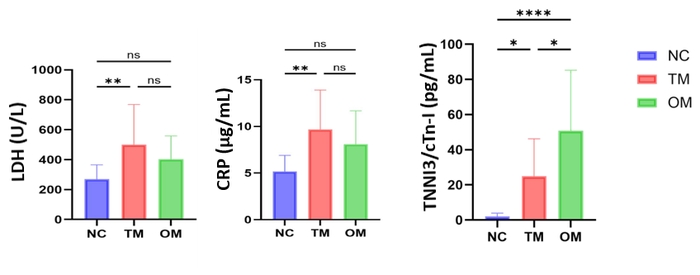
Figure 2: Serum levels of myocardial injury and inflammatory markers after I/R injury. Serum concentrations of LDH, indicating cardiomyocyte necrosis, CRP, reflecting the post‑ischemic systemic inflammatory response, and cTnI, a highly specific marker of myocardial injury in the NC, TM, and OM groups subjected to I/R. The distinct alterations in these three biomarkers among groups illustrate the differential systemic and cardiac tissue responses elicited by the modified versus conventional modeling approaches (n = 10, NC group vs. TM, OM groups, TM group vs OM group; ns, P > 0.05; *, P < 0.05; **, P < 0.01; ****, P < 0.0001). Please click here to view a larger version of this figure.
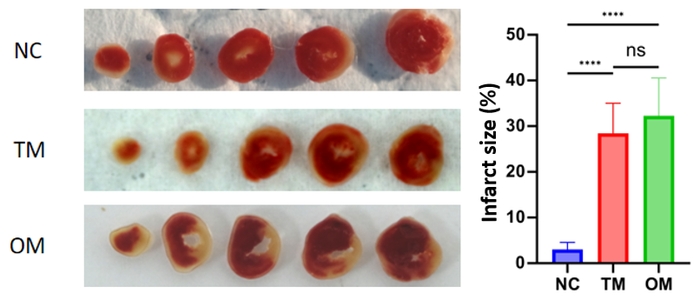
Figure 3: Myocardial infarct size determined by histochemical staining. Representative macroscopic images of cardiac cross-sections (stained with TTC, as applicable) and quantitative analysis of infarct size, expressed as a percentage of the total left ventricular area or area at risk, in the NC, TM, and OM groups. The extent of irreversible ischemic necrosis was compared to evaluate the consistency and severity of infarction induced by the different model‑establishment methods (n = 5, NC group vs. TM, OM groups, TM group vs OM group; ns, P > 0.05; *, P < 0.05; **, P < 0.01; ****, P < 0.0001). Please click here to view a larger version of this figure.
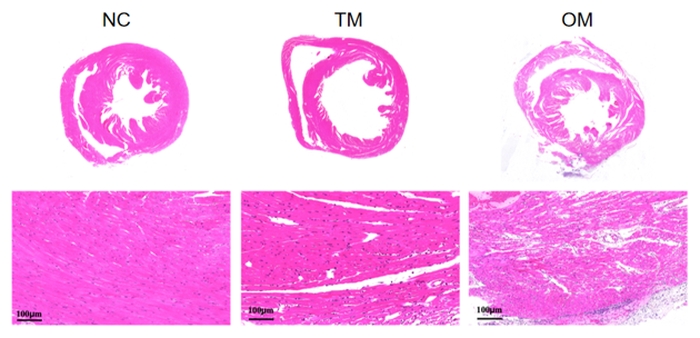
Figure 4: Histopathological evaluation of cardiac tissue injury after I/R. Representative photomicrographs of HE-stained myocardial sections to assess myocyte necrosis, vacuolization, interstitial edema, and inflammatory cell infiltration in the NC, TM, and OM groups. The TM group showed notably milder tissue disruption and reduced inflammatory infiltration compared with the OM group, corroborating the biochemical and infarct-size findings. Please click here to view a larger version of this figure.
Discussion
Reliable, minimally invasive, and reproducible mouse MIRI modeling techniques lay the foundation for exploring MIRI mechanisms and screening cardioprotective agents. Traditional MIRI models require long-term maintenance of inhalation and anesthesia, as well as re-thoracotomy to restore perfusion by removing the intravascular stent or supporting tube. Cumbersome manipulation, severe surgical trauma, and confounding non-specific injuries limit their application in standardized large-cohort experiments.
In contrast, this modified protocol retains the classic LAD ligation principle while streamlining surgical steps to minimize trauma. Carbon-synthesis fishing line ligation enables single thoracotomy. Pulling out the line directly to restore reperfusion, that will shorten surgery and anesthesia duration and boost throughput for batch model construction. Additionally, the fishing line pull-out method allows for precise control of reperfusion timing, which is critical for standardized batch experiments. Single thoracic incision preserves pleural and thoracic integrity, lowering the incidence of intraoperative complications such as pneumothorax and intrathoracic injury. Surgery-triggered stress and irrelevant myocardial damage are also alleviated, yielding lesions purely attributed to ischemia-reperfusion with minimal experimental interference.
The most critical steps for successful modeling are accurate LAD localization and secure fishing line ligation. The LAD artery is typically located 1–2 mm below the left atrial appendage, running toward the cardiac apex; careful removal of perivascular fat is required for clear visualization. At the same time, avoid tearing the myocardium when pulling out the fishing line during reperfusion, ensure the fishing line is placed parallel to the LAD artery within the ligature loop, and pull the line slowly and steadily at a uniform angle. In addition, the broken end of the fishing line may have burrs. Inspect it carefully before use to prevent laceration of the heart during extraction. Cutting the fishing line with sharp scissors can avoid this problem.
The results showed that the optimized model and the traditional model exhibit consistent electrocardiogram features, cardiac function, and myocardial pathological morphology. The infarction area in the optimized group was more uniform, and the non-specific myocardial injury was less severe, confirming the stability and credibility of its lesion phenotype. The limitations of this optimized model are as follows. First, the model was established only in male C57BL/6J mice. Differences in gender and strain may affect infarct size and severity, and further validation in other mouse strains is required. Second, this experiment only made comparisons under the condition of 45 min ischemia followed by 24 h reperfusion. Comparisons for longer ischemia or reperfusion durations remain to be further verified.
In summary, this optimized model improves surgical safety and experimental controllability, shortens surgery and anesthesia duration, while maintaining equivalent lesion quality to the traditional model. It reduces animal trauma and postoperative mortality, as well as improves model stability, sensitivity, and reproducibility, representing a favorable alternative to conventional modeling approaches. This model is particularly suitable for high-throughput cardioprotective drug screening, long-term survival observation, and efficacy evaluation of targeted therapeutic interventions. For emerging targeted studies including neuromodulation, copper chelation, and ROS-responsive nano-delivery, the low-trauma standardized MIRI model minimizes non-specific confounding interference, enables accurate quantification of therapeutic effects, and avoids false-negative results caused by surgical stress masking drug efficacy9,10. Collectively, this model holds promising translational prospects and provides a reliable experimental platform for MIRI pathogenesis research and novel drug development.
Disclosures
The authors have nothing to disclose.
Acknowledgements
This work was supported by the Project of the Institute of Basic Theory of Chinese Medicine (ZZ19-ND-03, ZZ16-ND-03).
Materials
| Name | Company | Catalog Number | Comments |
|---|---|---|---|
| 0.9% Sodium Chloride (Normal Saline) | Solarbio, China | IN9070 | |
| 2% 2,3,5-Triphenyltetrazolium Chloride (TTC) Staining Solution | Beyotime, China | C0652 | |
| 4% Paraformaldehyde | Solarbio, China | IP9320 | |
| 6-0 Absorbable Suture | Jinhuan, China | CR631 | |
| 7-0 Absorbable Suture | Jinhuan, China | CR731 | |
| Animal Shaver | AUX, China | C6 | |
| Animal Ultrasound Diagnostic System | Samsung, Korea | V7 | |
| Animal Ventilator | Reward, China | VentStar II | |
| Autoclave Sterilizer | BOXUN, China | YXQ-LB-30SII | |
| Automated Biochemistry Analyzer | URIT, China | 8210Ve | Bioanalyzer |
| Benchtop Centrifuge | Thermo, U.S. | Megafuge ST1 Plus | |
| Constant-Temperature Drying Oven | Yiheng, China | DHG-9145A | |
| Digital Camera | Fuji, Japan | GFX100 | |
| Electrocardiogram Recorder (ECG Recorder) | Zhongshi, China | MadLab-4C/5H | |
| Endotracheal Tube | Reward, China | RE20-M | |
| Ethanol | Sinopharm, China | 10009218 | |
| Gas Anesthesia Machine | Reward, China | R520 | |
| GraphPad Prism | GraphPad Software, U.S. | 10.1.2 | Statistical analysis software |
| Hematoxylin-Eosin (HE) Stain Kit | Solarbio, China | G1120 | |
| Image-Pro Plus | Media Cybernetics, U.S. | 6 | Image analysis software |
| Isoflurane | Reward, China | R510-22 | 1%–3% |
| Lactate Dehydrogenase (LDH) Activity Assay Kit | Urit, China | U84585040 | |
| Microsurgical Curved Forceps | Jinzhong, China | WA3020 | |
| Microsurgical Scissors | Jinzhong, China | WA1010 | |
| Mouse Cardiac Troponin I (cTnI) ELISA Kit | Elabscience, China | WS12646NX1661 | |
| Mouse C-Reactive Protein/CRP ELISA Kit | Proteintech, China | KE10128 | |
| Multimode Microplate Reader | Tecan, Switzerland | Spark | |
| Ophthalmic Forceps | Jinzhong, China | JD1060 | |
| Ophthalmic Scissors | Jinzhong, China | Y0030 | |
| Panoramic Imaging System | Leica, Germany | Versa 8 | |
| Paraffin Microtome | Kedee, China | Sense tech 5500 | |
| Paraffin Wax | Leica, Germany | 39601006 | |
| Potassium Chloride (KCl) | Aladdin, China | P112133 | 30 mM |
| Synthetic Fishing Line (Carbon Synthesis) | Shilu, China | 1237 | |
| Tissue Flotation Bath and Drying Station | P. S. J. Medical,China | PH60 | |
| Tissue Transparent Dewaxing Solution | Solarbio, China | G2150 | |
| Tribromethanol | Macklin, China | T831042 | 250 mg/kg i.p. |
| Ultrapure Water System | Milli-Q, Germany | EQ7000 |
References
- Han D, Ahn H, Park H. Myocardial ischemia-reperfusion injury-mechanistic insights and novel therapeutics. Int J Mol Sci. 2026;27(5):2106.
- Heusch G. Myocardial ischaemia-reperfusion injury and cardioprotection in perspective. Nat Rev Cardiol. 2020;17(12):773-789.
- Heusch G. Myocardial ischemia/reperfusion: translational pathophysiology of ischemic heart disease. Med. 2024;5(1):10-31.
- Zhang X, et al. Z-DNA-binding protein 1 exacerbates myocardial ischemia-reperfusion injury by inducing noncanonical cardiomyocyte PANoptosis. Signal Transduct Target Ther. 2025;10(1):333.
- Wang X, et al. S100a9 lactylation triggers neutrophil trafficking and cardiac inflammation in myocardial ischemia/reperfusion injury. J Clin Invest. 2025;135(24):e194664.
- Tong H, et al. Improved rodent model of myocardial ischemia and reperfusion injury. J Vis Exp. 2022;181:e63510.
- Zhong L, et al. Cardiomyocyte-derived GPX4 stabilizes BNIP3 to facilitate mitophagy and mitigate myocardial ischemia/reperfusion injury. Nat Commun. 2026;17(1):4578.
- Lv B, et al. Induction of myocardial infarction and myocardial ischemia-reperfusion injury in mice. J Vis Exp. 2022;179:e63257.
- Shi P, et al. Neuromodulation and copper chelation reverse sleep fragmentation-aggravated myocardial ischemia-reperfusion injury by targeting NET-induced endothelial cuproptosis. Research (Wash D C). 2026;9:1266.
- Shi P, et al. Targeted delivery and ROS-responsive release of lutein nanoassemblies inhibit myocardial ischemia-reperfusion injury by improving mitochondrial function. Int J Nanomedicine. 2024;19:11973-11996.
- Chen S, et al. Pharmacological upregulation of macrophage-derived itaconic acid by pubescenoside C attenuates myocardial ischemia-reperfusion injury. J Adv Res. 2025;74:571-587.
- Su J, et al. USP48 protects against myocardial ischemia-reperfusion injury by stabilizing and upregulating CNN1 in type 1 diabetes mice. Metabolism. 2025;170:156326.
- Xu Y, et al. Xanthosine alleviates myocardial ischemia-reperfusion injury through attenuation of cardiomyocyte ferroptosis. Cell Mol Biol Lett. 2025;30(1):93.
- Mei Z, et al. Tumor extracellular vesicles aggravate mitochondrial damage in myocardial ischemia/reperfusion injury. Adv Sci (Weinh). 2025;12(35):e17493.
- Hu D, et al. Elevated lactate dehydrogenase-to-albumin ratio: a novel and independent predictor of ventricular aneurysm in STEMI patients. Front Endocrinol (Lausanne). 2026;17:1775998.
- Kushner I. C-reactive protein - my perspective on its first half century, 1930-1982. Front Immunol. 2023;14:1150103.
- Rizo-Téllez SA, Sekheri M, Filep JG. C-reactive protein: a target for therapy to reduce inflammation. Front Immunol. 2023;14:1237729.
- Luo M, et al. cTnI R193H restrictive cardiomyopathy mice satisfy high-energy metabolic demands through regulating glucose metabolism. Genes Dis. 2025;13(2):101784.
Reprints and Permissions
This article has been published
Video Coming Soon